U.S. Department of Transportation
Federal Highway Administration
1200 New Jersey Avenue, SE
Washington, DC 20590
202-366-4000
Federal Highway Administration Research and Technology
Coordinating, Developing, and Delivering Highway Transportation Innovations
| TECHNICAL NOTE |
| This technical note is an archived publication and may contain dated technical, contact, and link information |
|
Publication Number: N/A
Date: 1997 |
ROSAN V - Technical NotesThis ROSANV Technical Note is in response to all the inquiries during the Transportation Research Board Annual Meeting that was held in January 1997 in Washington, D.C., and subsequent phone, fax and e-mail inquiries. The primary interest appears to be in the areas of aggregate segregation measurement, texture measurement in general, and texture measurement in combination with noise measurement. Measurement of general surface features and the potential subsequent quantification of surface features also drew much attention. BACKGROUND
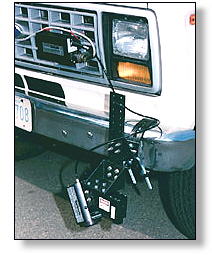
The original and primary goal of the ROSANV project at FHWA's TFHRC Pavement Surface Analysis lab was the development of a portable and automated system for the measurement of pavement texture at highway speeds along a linear path as a replacement of the manual Volumetric Patch Method as outlined by ASTM-E965 and ISO 10844. This manual measurement procedure was known previously as the "Sand Patch Test". Volumetric Patch Method procedures are valid for concrete or asphalt paving whose surface has not been treated or designed for improved drainage (such as grooving, tining, or open-graded porous asphalt) or milled to remove rutting. Prior to the completion of the ROSANV research work, ASTM Committee E-17 approved in November of 1996, ASTM Standard E1845, "Standard Practice for Calculating Pavement Macro-texture Mean Profile Depth" from a profile of pavement macrotexture. An automated measurement system such as ROSANV provides a larger quantity of valuable and less expensive texture data while greatly reducing the safety and traffic control problems inherent to the manually performed Volumetric Patch Method. The "v" in ROSANV stands for "vehicle-mounted" in that ROSANV can be quickly mounted on any vehicle using a temporary bumper hitch. APPLICATION AREAS OF ROSANV The following areas of application are feasible with the aid of ROSANV: 1. Texture measurements for Pavement Management Systems 2. Site specific texture measurements for safety investigations 3. Quality Control measurements for new
pavement for certifying pavement meeting
contract 4. Combining friction testing equipment such as a
skid trailer with ROSANV for simultaneous 5. Texture and surface detail measurements (grooving, tining) in noise research studies 6. Faulting at joints and cracks 7. Joint and crack measurement summaries over a section of pavement 8. Quality Control measurement of sawed concrete grooves 9. Groove maintenance measurements for wear and debris 10 . Memory of repaved surfaces PAVEMENT SURFACE TEXTURE AND FEATURES Data collected during the R&D project and shown on the following pages illustrates the potential uses of the ROSANV system for the measurement of pavement texture and other surface features. Jointed Concrete Pavement Figure 1 shows a graph of ROSAN ETD (Estimated Texture Depth) for each one meter analysis window of 106 meters of a concrete pavement. ROSAN ETD is fairly consistent across the graph except for some "spikes" in the data. ROSANV can be used to look at individual analysis window surface profiles.
Figure 1. One meter ETD analysis windows of a jointed concrete pavement
Shown in Figure 2 is the analysis window for one of the "spikes". The profile clearly shows a typical wide runway joint in the pavement.
Figure 2. One meter wide window showing typical runaway segment joint.
These two figures demonstrate that ROSANV does record surface features but does not yet remove joints (or cracks and grooves) from the measurement of pavement texture. ROSANV does provide statistics for ROSAN ETD such as mean, median, minimum, maximum, standard deviation, and the number of analysis windows. Because of the effect of joints and cracks, ROSAN ETD median is a more representative number than ROSAN ETD mean. With joint and crack identification algorithms, it would be possible to measure faulting. Grooved Concrete Pavement Figure 3 shows a one meter analysis window profile of a grooved concrete pavement which was recorded at a one millimeter sampling interval and 100 kph. The grooving is clearly visible although the sharp edges of the sawed grooved are somewhat rounded.
Figure 3. Grooved concrete detail, 1 mm sample interval at 100 kph.
Figure 4 shows the same grooving with a sampling interval of .25 millimeters at 40 kph. The grooves now show a much sharper edge with more surface texture showing between the grooves.
Figure 4.
Figure 5 shows the results of an uneven height setup in the equipment that was used to cut the grooves. With groove identification, the program could provide groove width, depth, and pitch measurement summaries and possible compute a texture estimate between the grooves. A beam-based system with a laser could measure texture of grooved pavement as its travel path can be set between the grooves.
Figure 5. Uneven height setup of groove sawing equipment.
Asphalt Pavement and Aggregate Segregation Figure 6 shows the graph of ROSAN ETD over a 148-meter length of asphalt pavement. The graph shows a large but expected variability in texture as compared to concrete pavement. A possible recurring pattern can be discerned within the graph.
Figure 6. Variable ETD for 148-meter section of asphalt pavement.
By using an analysis window that is four meters long, the pattern is more clearly visible as shown in Figure 7. Each of the "waves" is about 24-25 meters in length.
Figure 7. Four meter wide analysis window showing probable aggregate segregation.
These waves or "delta" pattern probably represent individual truck loads of asphalt and what is seen is the interaction of the truck with the paver and the processing of the load through the paver. FHWA R&D staff may observe a paving operation this spring -- record all paver, truck, and roller operations, and then use ROSANV to measure texture for correlation analysis with observed operations. EXPERIMENTAL DESIGN / DATA GATHERING In August 1996, the ROSANV research team went to Wallops Island, Virginia, which is a small NASA research facility located near Chincoteage, Virginia. The airport at Wallops Island has a runway with a wide range of pavement types, treatments, and textures as the facility is used for runway friction measurement testing. Texture depth varies from 0.24 mm to 2.65 mm as measured using the Volumetric Patch Method. Approximately a dozen different pavement sections of varying surface texture were recorded with the ROSANV system and the Volumetric Patch Method. For each pavement section, the ROSANV system was used to record data at five speeds (40, 60, 80, 100, and 110 kph) with each speed repeated three times. The same driver was used for all the ROSANV data collections. The driver used a "line of sight" method for positioning the vehicle a "fixed" distance offset from a longitudinal joint or seam. A location marker placed in the roadway was used to identify the beginning of each pavement section as the laser would record this object. The vehicle used in the data collection has a calibrated distance pulser. The ROSANV system utilizes the distance pulser in "research operating mode" for computation of MPD in spatially fixed analysis windows along the traveled path. These analysis windows are normally one meter in length and therefore each window could be accurately located on the pavement for the corresponding Volumetric Patch Method measurement. The three passes at 80 kph where used to locate the one meter analysis windows of interest for the Volumetric Patch Method measurement. Three Volumetric Patch Method measurements were made within each one meter window. A total of 150 analysis windows, or 450 Volumetric Patch Method measurements were taken and used as the basis for calibration. ROSANV ALGORITHMS AND CALIBRATION ASTM Standard E1845 computes a Mean Profile Depth (MPD) based on a simple computational procedure and uses a linear transform for Estimated Texture Depth (ETD). The ROSANV system relies upon an algorithm that mimics the rubber pad (puck) movement across the pavement surface as used in the Volumetric Patch Method which may be more desirable for measuring MPD as it would be the Volumetric Patch Method measurements to which the system would be calibrated. The MPD computed using the ROSAN algorithm is denoted as RMPD. Details of the statistical analyses and calibration procedures performed are too extensive to include in this document. The research team, in using the wide variety of data collected at Wallops Island, VA., were very pleased with the correlations found between the Volumetric Patch Method Results and the Mean Profile Depths (MPD) computed using the ROSAN MPD algorithms. The statistical tests and results will be included as a Research Reference Manual and will be included in papers to be submitted for publication. SPECIFICATIONS
ROSANV Main Screen CONTACTS For more information, contact: |


 In January 1997, FHWA presented its
ROad Surface ANalyzer R&D work, ROSANV
to transportation professionals at the Transportation Research Board
Annual Meeting in January in Washington, D.C. The primary objective
of research staff was to get feedback from transportation professionals
as to the need for and possible applications of ROSANV. The
interest in ROSANV exceeded expectations and has resulted
in a quickened pace to deploy the system.
In January 1997, FHWA presented its
ROad Surface ANalyzer R&D work, ROSANV
to transportation professionals at the Transportation Research Board
Annual Meeting in January in Washington, D.C. The primary objective
of research staff was to get feedback from transportation professionals
as to the need for and possible applications of ROSANV. The
interest in ROSANV exceeded expectations and has resulted
in a quickened pace to deploy the system.