U.S. Department of Transportation
Federal Highway Administration
1200 New Jersey Avenue, SE
Washington, DC 20590
202-366-4000
Federal Highway Administration Research and Technology
Coordinating, Developing, and Delivering Highway Transportation Innovations
 |
| This report is an archived publication and may contain dated technical, contact, and link information |
|
Publication Number: FHWA-HRT-10-037
Date: October 2010 |
||||||||||||||||||||||||||||||||||||||||||||||||||||||||||||||||||||||||||||||||||||||||||||||||
Step Frequency Ground Penetrating Radar Characterization and Federal Evaluation TestsAppendix F: Step Frequency GPR (SF GPR) Transmission Loss Calculations Through a Typical Concrete Bridge DeckThe following report contains supporting documentation and results of the calculations performed for the research initiative in this report. Since it is an unpublished internal working paper, it would not be otherwise accessible as a reference to use for the current report. The report in this appendix has not been edited or changed in any way from its original form as a working paper that was submitted to the SPS of the Interdepartment Radio Advisory Committee (IRAC). Note that the term Lossspreading, is the same as the later abbreviated version Lossspr found in this appendix. The terms are mathematically equivalent. The definition was inadvertently left out of the original paper. They are both defined as the spreading loss in decibels. Since the paper is being reproduced unchanged, clarification is being provided in this foreword.
February 15, 2007 The NTIA Spectrum Planning Subcommittee (SPS) Coast Guard representative requested additional documentation regarding Step Frequency GPR Transmission losses through a concrete bridge deck. This request was made to address potential interference concerns that could arise when a vessel crosses under a bridge deck while an SF GPR is being used to evaluate the bridge deck. The total losses are computed based on the assumption that radar energy is transmitted through a concrete bridge deck superstructure with an average thickness equal to 1 foot and at a position 1 meter or more below the bridge deck, which is provided for reasonable clearance of the vessel underneath the bridge deck. These assumptions are consistent with United States Coast Guard 2005 CFR Title 33, Volume 1, Subchapter J – Bridges.
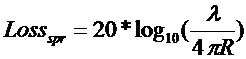
The following equation for losses was used to account for both transmission/attenuation losses and spreading losses [Daniels]: Losstotal = Losstransmission+attenuation + Lossspreading where: Za = Characteristic impedance of air = 377 W Zm = Characteristic impedance of concrete = 160 W Lossatt = Attenuation loss in concrete = 3 dB/ft at Freq<1000 MHz Lossatt = Attenuation loss in concrete = 6 dB/ft at Freq³1000 MHz
R = Radial distance from source This equation for Losstotalwas used to compute losses corresponding to each range of frequencies used by the Step Frequency GPR system. Table 1 presents the results:
Table 1. Calculations for Losstotal at representative Step Frequency GPR operating frequencies. Representative frequencies are selected as center frequencies within operating ranges defined in Tables 2 and 3. Tables 2 and 3 describe emissions of the Step Frequency GPR within its operating range and include calculations for losses due to the concrete bridge deck compared with back lobe emission levels (subtracted from bore sight emission levels).
Table 2. Maximum back lobe EIRP levels for both peak and average power (1MHz resolution BW).
Table 3. Emissions suppressed in specified bandwidths. Note that the fourth column of Table 1 corresponds to the third column of Tables 2 and 3. Also note that emissions are reduced more by concrete bridge deck losses than bore sight minus back lobe levels. Reference: Daniels, D.J., Surface Penetrating Radar, IEEE, December 1, 1996, pp. 300. |