U.S. Department of Transportation
Federal Highway Administration
1200 New Jersey Avenue, SE
Washington, DC 20590
202-366-4000
Federal Highway Administration Research and Technology
Coordinating, Developing, and Delivering Highway Transportation Innovations
 |
| This report is an archived publication and may contain dated technical, contact, and link information |
|
Publication Number: FHWA-RD-03-082
Date: December 2003 |
|||||||||||||||||||||||||||||||||||||||||||||||||||||||||||||||||||||||||||||||||||||||||||||||||||||||||||||||||||||||||||||||||||||||||||||||||||||||||||||||||||||||||||||||||||||||||||||||||||||||||||||||||||||||||||||||||||||||||||||||||||||||||||||||||||||||||||||||||||||||||||||||||||||||||||||||||||||||||||||||||||||||||||||||||||||||||||||||||||||||||||||||||||||||||||||||||||||||||||||||||||||||||||||||||||||||||||||||||||||||||||||||||||||||||||||||||||||||||||||||||||||||||||||||||||||||||||||||||||||||||||||||||||||||||||||||||||||||||||||||||||||||||||||||||||||||||||||||||||||||||||||||||||||||||||||||||||||||||||||||||||||||||||||||||||||||||||||||||||||||||||||||||||||||||||||||||||||||||||||||||||||||||||||||||||||||||||||||||||||||||||||||||||||||||||||||||||||||||||||||||||||||||||||||||||||||||||||||||||||||||||||||||||||||||||||||||||||||||||||||||||||||||||||||||||||||||||||||||||||||||||||||||||||||||||||||||||||||||||||||||||||||||||||
Minimum Retroreflectivity Levels for Overhead Guide Signs and Street-Name SignsPDF Version (837 KB)
PDF files can be viewed with the Acrobat® Reader® CHAPTER 6. DATA ANALYSISThere are a variety of factors that may impact the MR levels for overhead guide signs and street-name signs. Some of the key factors include minimum luminance, the distance which that minimum luminance represents, sign position relative to the driver, type of retroreflective sheeting, headlamp illumination, the accommodation level represented by the minimum luminance, vehicle speed, and vehicle type. Other factors also include the internal contrast of the sign (all signs under study are positive-contrast signs), ambient lighting conditions, and background complexity. This section includes an analysis of these key factors as they relate to MR levels for overhead and street-name signs. The objective of these analyses is to identify which variables have the most significant impact on the determination of the MR needs. This effort is needed to determine which variables should be considered in the development of the MR levels and, for those variables identified as needing to be considered, which values should be used to develop the MR recommendations. DISTANCE, SIGN POSITION, AND RETROREFLECTIVE SHEETINGThe results of the field evaluations show how sensitive minimum luminance is as it pertains to the distance between the observer and the sign. Specifically, less luminance is needed to read signs as the viewing distance decreases. However, countering the decreased luminance are two factors: increased observation angles and decreased headlamp illumination. Therefore, an understanding of the relationship between these variables is needed to determine where the critical distance is related to MR. For example, at the farthest distance to be studied, the observation angle is small and most signs fall near the hotspot of the headlamp illumination pattern. However, the luminance needed to read the sign at this farthest distance is high. On the other hand, at the shortest distance to be studied, the observation angle is greater and most signs will receive less headlamp illumination. Countering these issues, however, is the decrease in luminance needed to read a sign. Also, since the sign position is critical to where the sign falls within the headlamp illumination pattern, it is convenient to include sign position in the same analysis as distance. Likewise, it is also convenient to include the different type of retroreflective sheeting in the analysis. To conduct these analyses, various scenarios were studied for overhead signs, post-mounted street-name signs, and overhead street-name signs. For these analyses, the 50th percentile luminance accommodation level was used as determined from the data collection task (other accommodation levels could be used as well; however, for measuring the sensitivity of the variables under study, it is convenient to use one constant accommodation level). The MR levels shown in these analyses are not final recommendations; rather, they are for the purposes of determining the sensitivity of distance, sign position, and retroreflective sheeting as they relate to MR levels. Overhead SignsTable 20 summarizes the MR results for overhead guide signs to accommodate 50 percent of the experimental sample. In all cases and for all types of retroreflective sheeting, the most critical distance is the farthest distance. At this point, even though the observation angle is very small and the sign is located near the hotspot of the headlamp illumination pattern, the distance is overpowering. This is not surprising since light intensity diminishes with the square of the distance between the vehicle and the sign. It should be noted, however, that if one were to consider the required retroreflectivity needed to maintain the threshold luminance levels at a very short distance, there would be a point where the shorter distance would need more retroreflectivity than the longer distance. However, research has shown that drivers last look at a sign about 2.5 to 3.0 s before passing the sign. Table 20. Initial MR Levels for Overhead Guide Signs (50-Percent Accommodation)
Also, as expected, the most critical overhead signing position shown is when the vehicle is in the center lane of a three-lane highway (with 12-ft lanes) and the sign is positioned above the leftmost lane. If the vehicle were in the rightmost lane, then the MR for an overhead sign above the leftmost lane would be higher than those levels shown. Also, as the number of lanes increase (i.e., offset distance), so does the retroreflectivity needed to maintain the threshold luminance. The MR levels for different types of sheeting show trends that may indicate that the columns can be collapsed. However, the researchers felt that the different types of sheeting should be kept separate until all of the factors have been considered and the MR model is executed for the final MR runs. At that time, the trends shown in the MR levels were considered for simplification by collapsing the columns. Post-Mounted Street-Name SignsTable 21 summarizes the MR results for post-mounted street-name signs to accommodate 50 percent of the experimental sample. For post-mounted street-name signs on two-lane roadways, the most critical distance is the farthest distance (for almost all cases and for all but one type of retroreflective sheeting). Again, as the study distances grow shorter, the retroreflectivity needs will eventually become more demanding because of the increasing severity of the viewing geometry. In fact, there is a good example of this phenomenon shown for the study scenarios for four-lane roadways. More specifically, for type VII sheeting, the shortest distance (120 ft) requires more retroreflectivity than the intermediate distance (180 ft) and the farthest distance (240 ft). However, for all other types of retroreflective sheeting, the farthest distance is the most critical. The exception of type VII sheeting can be explained by its photometric performance under severe viewing geometries. Particularly, the type VII performance falls off rather quickly as the observation angle increases. This is exactly what is happening as the distance between the vehicle and the sign decreases. Table 21. Initial MR Levels for Post-Mounted Street-Name Signs (50-Percent Accommodation)
For both the two-lane and four-lane scenarios, the left shoulder-mounted signs require more retroreflectivity than the right shoulder-mounted signs. Since headlamps are generally aimed to the right, this is not surprising. Overhead Street-Name SignsTable 22 summarizes the MR results for overhead street-name signs to accommodate 50 percent of the experimental sample. Similar to the overhead guide signs, for all cases and for all type of retroreflective sheeting, the most critical distance is the farthest distance. Table 22. Initial MR Levels for Overhead Street-Name Signs (50-Percent Accommodation)
The aiming of the headlamps slightly to the right causes the overhead street-name sign directly above the vehicle to require more retroreflectivity than signs mounted closer to the shoulder. From the data shown, it can be seen that the sign mounted above the right edgeline is closest to the headlamp illumination hotspot since the retroreflectivity needs are less restrictive. However, as the sign is positioned farther to the right (i.e., closer to the shoulder), the retroreflectivity needs increase, but not to the level that is required when the sign is directly above the vehicle. Again, if the sign were positioned even farther to the right, or to the left of the vehicle centerline, the retroreflectivity needs would be even higher than the levels shown. However, overhead street-name signs are generally not mounted in these locations. Summary of Sensitivity of Distance, Sign Position, and Retroreflective SheetingThe sensitivity analyses for distance show that the farthest distance is most critical for nearly all of the scenarios. The only exception is for type VII left-shoulder, post-mounted street-name signs; however, the difference between the retroreflectivity needed at the shorter distance is not that much different from the retroreflectivity needed at the largest distance. Therefore, only the farthest distance needs to be considered in the final development of retroreflectivity recommendations. Realistic sign positions were tested to determine the impact on MR. As expected, the signs in disadvantaged locations require more retroreflectivity than the signs falling closer to the headlamp illumination hotspot. Therefore, for the final analyses, sign position was maintained as a key variable. After the final analyses were performed, the MR tables were analyzed to determine whether consolidation by sign position was feasible. All currently available types of retroreflective sheeting were analyzed. While the results show distinguishing trends that indicate that certain types of sheeting can be collapsed into a broader class, it may be useful to keep the sheeting types separate until the final analyses are performed. Then, similarly to sign position, the tables were analyzed to determine whether simplification by sheeting type was feasible. Appendix B provides additional information pertaining to the need to have different retroreflectivity levels for different types of sheeting. HEADLAMP ILLUMINATIONThe previous MR levels for shoulder-mounted signs (excluding street-name signs) were developed based on the CARTS50 headlamp isocandela profile for both the left and right headlamps.(2) Since retroreflectivity levels are directly impacted by headlamps, it is worth investigating how the CARTS50 headlamp profile compares to other published U.S. headlamp profiles and how the isocandela profiles of headlamps from the same vehicle compare. Left Versus Right HeadlampsOne of the first things to consider is the difference between the left and right headlamps. In order to compare the consistency of the light-output distributions for lamps built for the same side of a vehicle and lamps built for the two different sides of a vehicle, UMTRI measured two left headlamps and one right headlamp for each of six vehicles (three in each category). Their results show a high level of consistency for both left versus left and left versus right comparisons, with the maximum correlation for each pair of headlamps being 0.936 or greater. However, the maximum coefficients for the left versus right comparisons (the range over the six vehicles being 0.936 through 0.988) were consistently lower than those for the left versus left comparisons. These results suggest that it is easier to produce similar headlamps of the same design (for a given side of a vehicle) than it is to produce similar headlamps with different designs required by the constraints of available space on different sides of the vehicle. Nonetheless, the UMTRI research indicates that the intensity and distribution differences between the left and right headlamps of the same vehicle are statistically negligible.(61) Consequently, hereafter, it is assumed that there is no significant difference between the left and right headlamps. However, the TTI MR model does have the capability of accounting for the unique left and right headlamp profiles. Intensity ComparisonsThe CARTS50 headlamp profile was developed as part of a National Highway Traffic Safety Administration (NHTSA) study and includes a sample of 26 sealed-beam and replaceable-bulb headlamps commonly used in the United States. It represents the 50th percentile of the bulbs' photometric tables. Most of the vehicles used to develop this profile were manufactured in the late 1980s, with one vehicle from 1990. Although no mention is made in the report by Paniati and Mace, from the isocandela diagram provided in the report, researchers are fairly confident that their profile represents low beams.(2) Another source of U.S. headlamp profile data is a 1997 UMTRI report.(61) The UMTRI profiles include a sample of 35 low-beam headlamps manufactured for 23 of the best-selling passenger cars, light trucks, and vans for the 1997 model year. At the time, these 23 vehicles represented 45 percent of all vehicles sold in the United States. The photometric information for each lamp was weighted by 1997 sales figures for each corresponding vehicle. In order to compare how the CARTS50 headlamp performs versus the UMTRI headlamp profiles, tables 23 through 25 were developed for typical overhead, right shoulder-mounted, and left shoulder-mounted sign locations, respectively. Table 23. Comparison of Headlamp Profiles for Overhead Signs
Table 24. Comparison of Headlamp Profiles for Right-Shoulder-Mounted Signs
Table 25. Comparison of Headlamp Profiles for Left-Shoulder-Mounted Signs
For overhead signs, the CARTS50 headlamp profile produces illuminances considerably higher than the UMTRI 75th percentile passenger car. Based on an assumption of normally distributed data for the UMTRI headlamps, it can be shown that the CARTS50 headlamp profile produces an UMTRI passenger car profile of approximately 85 percent. For vans and light trucks, the CARTS50 headlamp profile is almost identical to the UMTRI 75th percentile profile. Therefore, for overhead signs, the CARTS50 profile is equal to about a 75th or 85th percentile UMTRI profile, which is interesting since the CARTS50 profile represents a 50th percentile headlamp (albeit, from earlier headlamps). Discovering that the CARTS50 headlamp provides more overhead illumination than expected (using the UMTRI profiles as measures) may not be surprising since there have been several attempts to harmonize world headlamp profiles, specifically the U.S., European, and Japanese patterns. The goal of the harmonization effort is to develop specifications for one headlamp pattern that satisfy worldwide illumination criteria. In general terms, the U.S. pattern has traditionally provided substantially more light above the horizon than the European and Japanese patterns. However, attempts to harmonize these headlamp patterns have resulted in several compromises among all three patterns. For the U.S. pattern, one of the more significant compromises has been the decreased amount of light above the horizon. In fact, with the 1997 revision to FMVSS 108 allowing VOA headlamps (including both VOL and VOR designs) and the 1999 agreement from the Working Party on Lighting and Light-Signaling of the World Forum for Harmonization of Vehicle Regulations (WP.29) concerning harmonized headlamps (a drastic compromise between the U.S. philosophy of maximizing visibility versus the European philosophy of minimizing glare), the amount of light above the horizon will continue to decrease. A recent report shows comparisons between U.S. conventional headlamps and the VOL, VOR, and harmonized headlamps.(48) For overhead signs at approximately 500 ft, there are consistent trends showing decreased illumination above the horizon. As mentioned in chapter 2, compared to the conventional U.S. headlamps, the VOL headlamp reduces overhead illumination by 28 percent, the VOR headlamp by 18 percent, and the harmonized headlamp by 33 percent. The data from table 24 for right shoulder-mounted signs indicate that the CARTS50 headlamp profile comes closer to the UMTRI 50th percentile headlamps (compared to the overhead illuminance data). For passenger cars, the CARTS50 illuminance falls between the UMTRI 25th and 50th percentile levels, but is closer to the 50th percentile level. For vans and light trucks, the CARTS50 illuminance is just below the respective UMTRI 50th percentile levels. The left-shoulder data in table 25 indicate that the CARTS50 headlamp profile represents something between the UMTRI 50th and 75th percentile passenger car headlamp profiles. For vans and light trucks, the CARTS50 illuminance value is nearly the same as the UMTRI 75th value. Therefore, for left shoulder-mounted signs, there appears to be a reasonably good correlation between the CARTS50 headlamp profile and more recent headlamp profiles for passenger cars, vans, and light trucks. However, it should be noted that none of these headlamp profiles include the latest headlamp designs. For instance, high-intensity discharge (HID) headlamps (such as the xenon headlamps generally found on today’s luxury vehicles) were not measured for either the CARTS50 profile or any of the UMTRI profiles. Furthermore, they do not include samples from the newer headlamp styles that have a distinct vertical cutoff designed to aim vehicle headlamps (such as the VOA-style headlamp found on the Taurus used as part of the minimum luminance data collection). Furthermore, these headlamp profiles can be considered ideal. In other words, the headlamps were perfectly aimed when measured under ideal conditions with constant voltage supplies. They do not consider variations introduced from headlamp misalignment, headlamp cleanliness, and vehicle sprung-mass orientation caused by an infinite number of vehicle loads and distributions (such as a passenger car with an overloaded trunk). Real-World Headlamp IlluminationAll of the headlamp analyses presented and discussed thus far have assumed ideal conditions. In other words, the headlamps were new and tested on a goniometer with a constant power supply. Also, the alignment was controlled to be as near perfect as possible. Unfortunately, this does not represent real-world conditions very well.(62) Furthermore, all of the headlamp profiles shown are weighted averages made from a number of headlamp measurements. Therefore, the real-world nature of misaligned and dirty headlamps is not considered, nor are comparisons to individual vehicles or headlamp designs made. Fortunately, Russell et al., recently completed a study on the need for headlamp illuminance in terms of overhead signs, in which special care was taken to control for pavement glare illuminance.(49) As part of this study, they used 50 known vehicles to measure the illuminance falling on three locations that were typical of overhead-mounted, left shoulder-mounted, and right shoulder-mounted signs. For all vehicle passes, low beams were used. Illuminance data were collected by two illuminance meters (per sign position) equipped with optical occluders to eliminate the illuminance caused by glare off of the pavement surface. The data were collected at distances of 500 and 375 ft. Table 26 summarizes their findings and shows how the modeled CARTS50 and UMTRI headlamp profiles compare. Table 26. Roadway Illuminance Measurements (in lux)
To determine which of the seven headlamp profiles best replicates the measured illuminance data collected by Russell et al., the percentage differences were calculated. These percentage difference calculations were based on the average of the two mean measured values for each sign position and each respective modeled headlamp value for that position. The percentage differences were then ranked. For both distances shown in table 26, the CARTS50 headlamp was ranked first (i.e., it does the best job of replicating the measured illuminance data provided by Russell et al.). However, it is important to note that there is a poor correlation between the modeled headlamp illuminance and the measured illuminance falling on left shoulder-mounted signs. If the measured data were accurate, then the low CARTS50 data would result in unnecessarily high MR levels for left-shoulder roadside signs (such as left-shoulder, post-mounted street-name signs). This issue is revisited later. Russell et al., also provide specific headlamp illuminance data for 4 of the 50 known vehicles. These values are shown in table 27 with the CARTS50 values for the same scenarios. For reference, the Mercedes headlamps produced the lowest overhead illumination of the 50 known vehicles, while the 1984 Mazda produced one of the highest overhead illuminance readings. These data provide additional evidence that the CARTS50 headlamp profile does a reasonable job of simulating the 50th percentile headlamp of vehicles found in the United States.
Again, the same illuminance trends that existed with the aggregated data (shown in table 26) also exist for the four vehicles shown in table 27. More specifically, the illuminance from the CARTS50 headlamp profile compares well for signs in the overhead and right-shoulder positions, falling between the boundary illuminance values. However, for left-shoulder signs, the CARTS50 headlamp provides illuminance values similar to the minimum values of the four vehicles shown in table 17. To provide an assessment of how different headlamp profiles and real-world data compare for left shoulder-mounted signs, table 28 was developed using the TTI MR model and available headlamp data. Table 28. Illuminance Data for Left-Shoulder-Mounted Signs
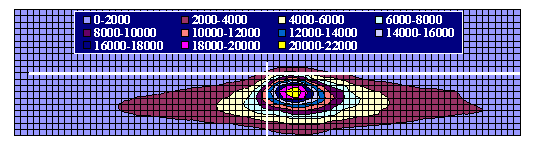
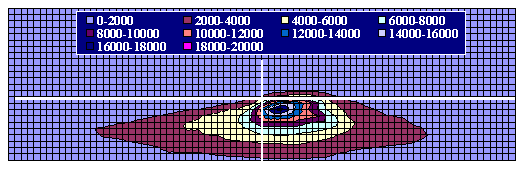
The illuminance data shown in table 28 provide additional information pertaining to the poor correlation for left-mounted signs between the CARTS50 modeled illuminance and the measured illuminance. For both distances, the CARTS50 illuminance is above the minimum measured values, but not near the lower bounds of the measured 50th percentile. In fact, even the 75th percentile UMTRI illuminance values fall short of the lower bounds of the measured 50th percentile. Summary of Headlamp SensitivityResearchers at UMTRI have studied the differences between the left and right headlamp profiles. They have concluded that there is a strong correlation among headlamps of the same vehicle. Therefore, the same headlamp profile was used for the left and right headlamps in the final runs of the TTI MR model. Comparisons of various headlamp profiles demonstrate the age of the CARTS50 headlamp profile. For right and left shoulder-mounted signs, the CARTS50 profile performs similarly to the UMTRI passenger car profile and the van and light truck profile. However, for overhead signs, the CARTS50 headlamp provides substantially more illumination above the horizon. In terms of the UMTRI profiles, the CARTS50 profile is equivalent to approximately an 85th percentile passenger car profile and a 75th percentile van and light truck profile. The international headlamp harmonization efforts that are currently underway will probably reduce the amount of overhead illumination even further, especially as the U.S. vehicle fleet turnover rate begins to increase the number of VOA and harmonized headlamps on the road. On the other hand, comparison of the CARTS50 illuminance values to the real-world data collected by Russell et al., shows that the CARTS50 headlamp profile does an impressive job of simulating real-world illumination values for overhead and right shoulder-mounted signs. However, for left shoulder-mounted signs, a poor correlation exists between the measured illuminance values and any of the headlamp profiles (including the CARTS50 headlamp profile and the UMTRI profiles). The consistent results of the CARTS50 headlamp profile as compared to the UMTRI headlamp profiles indicate that there is little reason to suspect that the CARTS50 is outdated, other than perhaps for overhead signs. However, the headlamp used for modeling purposes should replicate real-world data rather than weighted data from more recent headlamp designs. This philosophy accounts for headlamp misalignment, headlamp cleanliness, and variations in the sprung-mass of the vehicles. The data show that the CARTS50 does a good job of replicating the average real-world illuminance measurements for overhead and right shoulder-mounted signs. For left shoulder-mounted signs, CARTS50 compares well with the UMTRI profiles. However, all seven of the headlamp profiles tested produce illuminance values substantially less than the average values measured by Russell et al. Several options are available to account for the differences in left shoulder-mounted signs. For instance, the difference between the measured illuminance and the modeled illuminance can be used to weight a headlamp profile so that it better replicates the measured values. This modified headlamp profile would only be used for the determination of MR levels for left shoulder-mounted signs. Another option would be to use the headlamp profile that comes closest to the measured illuminance values for left shoulder-mounted signs. In this case, the UMTRI 75th percentile passenger car profile would be the best. However, this profile still falls short of the average of the measured illuminance values. Another option would be to assume that the UMTRI profiles are normally distributed, estimate a standard deviation, and then use that and the 50th percentile profile to develop a profile that better replicates the average measured values. A quick analysis shows that an UMTRI 85th percentile passenger car profile would come close to matching the average measured illuminance. However, all of these methods introduce an element of inconsistency by using different headlamp profiles for signs in different positions. There is a benefit of using one headlamp profile to determine MR levels. Also, there is evidence for dismissing the measured illuminance values for left shoulder-mounted signs. In particular, for overhead and right shoulder-mounted signs, the average of the measured illuminance values fall within realistic boundaries for all of the headlamp profiles tested. Furthermore, for overhead and right shoulder-mounted signs, there is consistency between the modeled illuminance values from all of the headlamp profiles tested. For left shoulder-mounted signs, the same consistency exists between the modeled illuminance values from all of the headlamp profiles; however, the measured illuminance values are substantially higher than expected. Therefore, these trends can be interpreted to suggest that the measured illuminance values for left shoulder-mounted signs are unreasonably high. If the illuminance meters used by Russell et al., had been rotated from position to position, then additional data would be available to support the reported measurements. However, without additional data, there is no way to verify the accuracy of the measurements. Given the position presented above, it was concluded that the CARTS50 headlamp profile was the most appropriate headlamp to determine the MR levels. It has good correlation with recently measured real-world illuminance values for overhead and right shoulder-mounted signs. Despite the difference between the CARTS50 and the measured real-world illuminance values for left shoulder-mounted signs, there are indications that the measured real-world values may be unreasonably high. Headlamp technology and specifications are changing. Consequently, the selection of the most appropriate headlamp is dynamic in nature. While the analysis shows that the CARTS50 headlamp does the best job of replicating the measured illuminance values reported by Russell et al. (of the seven headlamp profiles considered), it is important to note that newer headlamps and revised headlamp specifications will eventually lead to the need to reevaluate MR levels. Evidence is provided in the literature that shows a decreased amount of illumination provided to overhead signs with newer headlamps. Furthermore, the data presented in table 23 also indicate the same trend. For example purposes only, the researchers reran the TTI MR model with the CARTS50 and UMTRI 25th percentile passenger car headlamp profiles for an overhead sign scenario to demonstrate how sensitive the MR levels can be to different headlamp isocandela distributions. The isocandela plots of these headlamps are shown in figure 22 (with the CARTS50 headlamp on top). The MR results are shown for an accommodation level of 50 percent in table 29.
Table 29. Minimum Overhead Retroreflectivity Levels (50-Percent Accommodation)
This example shows that the impact of the vehicle headlamp can be significant in terms of MR levels. As the vehicle fleet turnover rate catches up with the newer headlamp styles, the MR for signs will need to be reevaluated. VEHICLE SPEEDVehicle speed also needs to be considered for the determination of MR levels. Signs have to be bright enough to accommodate typical operating speeds. However, depending on the position of the signs and the maneuver required, final speed and deceleration rates also play an important role. Since overhead guide signs are typically found on expressways and freeways with operating speeds of 55 mph or greater, the researchers assumed that low-speed roadways would not generally have overhead guide signing. The researchers also decided that the maneuvers are not required from overhead guide signs, because they generally are designed using a series of signs providing ample time to move into the appropriate lane. Therefore, the speed factor for overhead signs was not considered to be a critical factor. However, since retroreflectivity is a function of luminance and luminance is a function of distance, one has to decide at what distance the signs should be legible. The Millennium MUTCD provides a legibility guideline of 40 ft/inch of letter height.(51) Using 16-inch uppercase and 12-inch lowercase letters, a distance of 640 ft is reasonable. Therefore, the MR derived for overhead signs was based on providing enough retroreflectivity to read overhead signs at 640 ft. Depending on the approach speed, this philosophy provides different reading times. For the worst-case scenario, an operating speed of 70 mph was assumed. With a last-look distance based on 3.5 s, the process provides the driver with 280 ft of legibility, or 2.7 s to read an overhead sign. For 55-mph approach speeds, drivers will have approximately 4.4 s to read an overhead sign. It should be noted that legibility distances associated with 40 ft/inch of letter height is generally unobtainable with older subjects, as many studies have shown. However, younger drivers normally exceed the legibility distances equivalent to 40 ft/inch of letter height. For street-name signs, a supply-and-demand analysis was used. A range of distances was considered that were derived from approach speeds ranging from 20 to 70 mph in 5-mph increments. This exercise was done in order to study the sensitivity of MR as a function of approach speed. The concept for post-mounted street-name signs included an "expected event" PIEV time (or total time required to perceive and react to a situation as referred to in the MUTCD as the combination of the perception, identification, emotion, and volition times) for older drivers of 0.66 s.(44) It was also assumed that the motorist does not stop, but rather decelerates to a speed of 5 mph to negotiate the turning maneuver. The stopping sight-distance deceleration rate of 11.2 ft/s2 (for all speeds) from the 2001 American Association of State Highway and Transportation Officials (AASHTO) A Policy on Geometric Design of Highways and Streets, 4th Edition (Green Book) was used to determine the distances needed based on the approach speed. These distances are the demand distances; in other words, this is the distance needed, based on the provided assumptions, to negotiate the maneuver. For overhead street-name signs, the process was the same as for the post-mounted street-name signs except that the assumptions were modified. The PIEV time was raised to 1.0 s to account for the visual clutter associated with the signal head's proximity to the sign and the usual urban conditions in the background. Because mast-arm signs are usually located at signalized intersections, the assumed maneuver was a stop. Therefore, the demand distances were based on the approach speed and the deceleration rate needed to come to a complete stop. The supply distances were determined using typical letter heights of 6 inches for post-mounted street-name signs and 8 inches for overhead street-name signs, and a legibility index of 40 ft/inch of letter height. Using this basic philosophy, post-mounted street-name signs supply 240 ft of legibility distance and overhead street-name signs supply 320 ft of legibility distance. Next, for each 5-mph increment, the demand and supply distances were compared. For higher approach speeds, the demand distances needed to decelerate and make a turning maneuver are greater than what can be supplied (assuming a legibility index of 40 ft/inch of letter height). For those speeds, the researchers used the same philosophy as that used for the design of MR for overhead guide signs. Specifically, determine the MR that will provide the legibility equivalent to a legibility index of 40 ft/inch of letter height. This results in a distance of 240 ft for post-mounted street-name signs and 320 ft for overhead street-name signs. The breakpoint in the supply-and-demand relationship differs between post-mounted and overhead street-name signs. For post-mounted street-name signs with speeds of 30 mph and less, the supply distance is greater than the demand distance. For overhead signs, the breakpoint is 35 mph. For approach speeds that result in demand distances that are less than the supply distances of 240 or 320 ft (for post-mounted and overhead signs, respectively), the researchers determined the critical distance by taking the average demand distance of all speeds equal to and less than the breakpoint. This philosophy ultimately reduces the retroreflectivity requirements for street-name signs on lower speed roadways. For post-mounted signs, a distance of 140 ft was used to model the MR, instead of 240 ft for speeds of 35 mph and greater. For overhead street-name signs, the breakpoint was 35 mph with a distance of 200 ft. VEHICLE TYPEA surface that is retroreflective (e.g., the face of traffic signs) directs light back to its source. However, there is some dispersion of the light. Besides the small amount that is either absorbed or diffusely reflected as the light enters and then exits the protective film on the outside of retroreflective sheeting, the majority is directed back toward the source. The intensity of the redirected light varies as the observation angle is increased. Near the source, with a small observation angle, the redirected light is very intense. However, as the observation angle increases, the redirected light gradually diminishes. Furthermore, each type of retroreflective sheeting has unique performance curves associated with observation angles. One of the factors that controls the observation angle is the type of vehicle from which a traffic sign is viewed. The vehicle type can have a strong impact on the headlamp height and the driver's eye position. FMVSS 108 specifies a vertical headlamp range with which all vehicles sold in the United States must comply. However, there are limited controls on how the cabins of vehicles are designed. For instance, the cabins (more specifically, the driver's seat position) of passenger cars are generally designed to be low to the ground. This results in a relatively small vertical difference between the headlamp and the driver's eyes, depending on the size of the driver. Vehicles such as light trucks and sport utility vehicles (SUVs) are designed to ride higher than passenger cars. The vertical difference between the headlamps and the driver's eyes is somewhat greater than that for passenger cars. The worst-case scenario is large trucks. They also have to satisfy FMVSS 108's headlamp height requirements. However, their cabin is designed to sit relatively high. Therefore, the difference between the headlamps and the driver's eyes is also great. This means that a driver with specific visual capabilities, and all else constant, will receive decreased amounts of redirected (retroreflected) light from a traffic sign as they move from a vehicle with small differences between the headlamp and the eye height to a vehicle with large differences between the headlamp and the eye height. In other words, for a given scenario, that same driver may be able to easily read a sign in a passenger car. For the same driver and scenario, the driver may just barely be able to read the sign in an SUV. Again, for the same conditions, the driver may not be able to read the sign from a large truck. There have been numerous attempts to define specific measurements for typical vehicles of different classifications (e.g., passenger cars, light trucks, large trucks, motorcycles, etc.). Table 30 illustrates the various headlamp and driver's eye height dimensions used by previous research (other dimensions needed for retroreflectivity modeling include the lateral distance from the headlamp center to the vehicle centerline, the lateral distance from the driver's eye location to the vehicle centerline, and the longitudinal distance between the headlamps and the driver's eye). For the MR numbers shown thus far, the CARTS passenger car dimensions have been used. To demonstrate the impact of other vehicles, we executed the TTI MR model using two additional vehicles (UMTRI's light truck and Sivak's heavy truck). The results are shown in table 31. Table 30. Vehicle Dimensions
Table 31. Vehicle Impacts on Overhead Guide Sign MR Levels
As expected, the retroreflectivity demand increases as the distance between the headlamp and the driver's eye height increases, which is controlled by vehicle type. For large trucks, only the microprismatic materials are able to provide the 50th percentile threshold luminance of 2.3 cd/m2. However, for passenger cars and overhead signs located above the travel lane, type II sheeting provides adequate luminance, albeit, just barely. Of course, retroreflectivity is exclusively a nighttime element of traffic signs. Therefore, in order to adequately select a design vehicle, one would need to know the distribution of vehicles on the road at night. To be even more precise, it would be nice to know the ages of the drivers in those nighttime vehicles. For instance, there is probably little doubt that older drivers are more likely to be found driving passenger cars than large trucks. However, these data are not currently available. Without such data, it is difficult to select the most appropriate design vehicle. The CARTS passenger car was used for the final runs of the TTI MR model. There is little evidence to indicate the use of something other than the CARTS passenger car. The other referenced dimensions for passenger cars (shown in table 30) indicate that the CARTS passenger car is a reasonable replication of passenger cars. Furthermore, the previous MR levels developed by research under Paniati and Mace used the CARTS passenger car.(2) When larger vehicles are used (e.g., a light truck or a heavy truck), the MR levels increase. These data may prove to be useful for an agency wishing to design signs for a facility with a large proportion of truck traffic. LUMINANCE ACCOMMODATION LEVELSAs shown by the results of the data collection (see figures 18 and 19), the minimum luminance needed to read signs is highly dependent on the level of accommodation chosen. Because MR is a direct function of luminance, the MR levels will also be highly dependent on the level of accommodation chosen. It should be noted, however, that the data collection included only older drivers (age 55 and older). Therefore, the accommodation levels shown as a result of the data collection are somewhat misleading. For instance, when the minimum luminance levels of the 85th percentile are shown, this is really the minimum luminance needed to accommodate 85 percent of drivers age 55 and older. However, there is little doubt that the largest population of drivers found on unfamiliar roads at night (when the legibility of road signs is of the utmost importance) is younger than age 55. There are numerous research reports showing that younger drivers need less luminance to read traffic signs at night than older drivers, all else being constant.(63-65) Although the correlation varies with age and individual visual capabilities, in general, younger drivers need about 70 to 75 percent of the luminance required by older drivers (to read traffic signs). Therefore, it can be assumed that luminance levels that accommodate a driver of a certain age also accommodate younger drivers. An example is provided to show how the accommodation levels acquired herein can be misleading. If one assumes that 75 percent of the nighttime drivers are younger than age 55 and the remainder are age 55 or older, and the MR levels are based on the 85th percentile luminance levels derived herein, then a more accurate accommodation level is actually 75 + [(85/100) × 25] = 96.25 percent. Unfortunately, data related to nighttime driver age are unavailable, especially data for nighttime drivers on unfamiliar roads. Furthermore, there has been a substantial effort in recent years to accommodate the aging population in the United States. Therefore, the accommodation levels acquired through the data collection effort conducted as part of this research project will be used to generate MR levels. This will ensure that the older population is duly considered and will provide actual accommodation levels that surpass the design levels. Additionally, a margin of safety will be inherently introduced into the determination of the MR levels. |
|||||||||||||||||||||||||||||||||||||||||||||||||||||||||||||||||||||||||||||||||||||||||||||||||||||||||||||||||||||||||||||||||||||||||||||||||||||||||||||||||||||||||||||||||||||||||||||||||||||||||||||||||||||||||||||||||||||||||||||||||||||||||||||||||||||||||||||||||||||||||||||||||||||||||||||||||||||||||||||||||||||||||||||||||||||||||||||||||||||||||||||||||||||||||||||||||||||||||||||||||||||||||||||||||||||||||||||||||||||||||||||||||||||||||||||||||||||||||||||||||||||||||||||||||||||||||||||||||||||||||||||||||||||||||||||||||||||||||||||||||||||||||||||||||||||||||||||||||||||||||||||||||||||||||||||||||||||||||||||||||||||||||||||||||||||||||||||||||||||||||||||||||||||||||||||||||||||||||||||||||||||||||||||||||||||||||||||||||||||||||||||||||||||||||||||||||||||||||||||||||||||||||||||||||||||||||||||||||||||||||||||||||||||||||||||||||||||||||||||||||||||||||||||||||||||||||||||||||||||||||||||||||||||||||||||||||||||||||||||||||||||||||||||