U.S. Department of Transportation
Federal Highway Administration
1200 New Jersey Avenue, SE
Washington, DC 20590
202-366-4000
Federal Highway Administration Research and Technology
Coordinating, Developing, and Delivering Highway Transportation Innovations
 |
| This report is an archived publication and may contain dated technical, contact, and link information |
|
Publication Number: FHWA-HRT-04-096
Date: August 2005 |
||||||||||||||||||||||||||||||||||||||||||||||||||||||||||||||||||||||||||||||||||||||||||||||||||||||||||||||||||||||
Evaluation of LS-DYNA Wood Material Model 143PDF Version (8.16 MB)
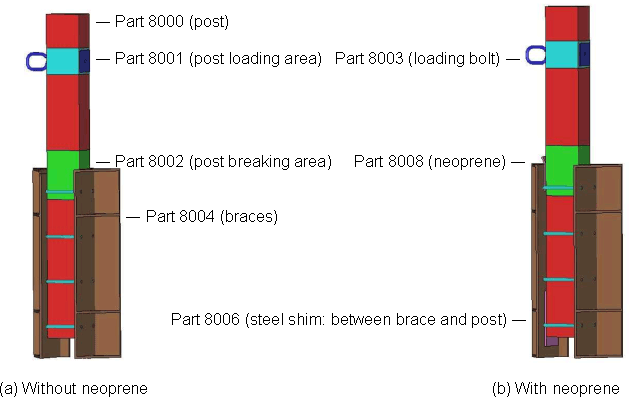
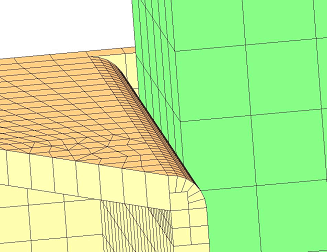
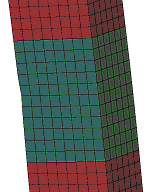
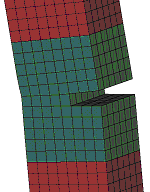
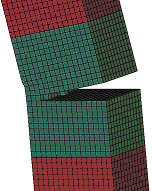
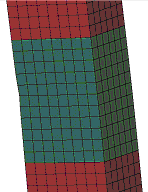
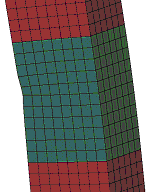
PDF files can be viewed with the Acrobat® Reader® 13 - Static Wood Post Test Simulations13.1 - Static Post ModelStatic post testing consisted of both using neoprene and not using neoprene wedged between the wood post and the braces holding the post. Similar results were obtained with or without the neoprene, so eventually the static tests switched entirely to no neoprene being used for convenience. Because of anticipated contact difficulties with the simulations, two models were made to simulate the physical testing: one model with neoprene and one model without (see figure 74). The area of concern was at the contact interface between the wood post and the edge of the brace. It was thought, and later proven to be true, that the neoprene acted like a softening mechanism between the relatively soft wood post and the rigid clamping frame. However, this effect also proved to be insignificant with regards to the overall post behavior. In the model, the wood post is divided into three parts: (1) part 8001, the loading area on the post; (2) part 8002, the area where the post breaks; and (3) part 8000, the remainder of the post. All three post parts have the same wood material properties. The post is clamped between rigid, fixed braces (part 8004). Loading is supplied to the post through the loading bolt (part 8003) using a prescribed velocity motion of 1 mm/ms. After many different model variations, it was determined that the model without the neoprene could be used for simulating the physical static tests. Some difficulties were encountered while developing the baseline static model. A final model variation was developed that incorporated a rounded edge on the brace (as shown in figure 75). This rounded edge eliminated several contact issues that made the previous models very sensitive to the new wood material model. Baseline ModelA baseline model is established to compare the various static post test simulations. This baseline model uses the default wood material properties for southern yellow pine, which has a grade of 1, a moisture content of 30 percent, and a temperature of 20 degrees Celsius (°C) (*MAT_WOOD_PINE).
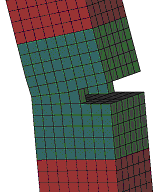
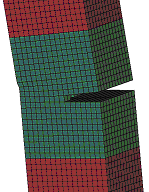
Figure 74. Static post models.
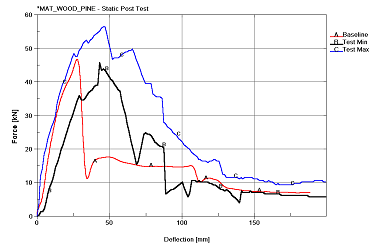
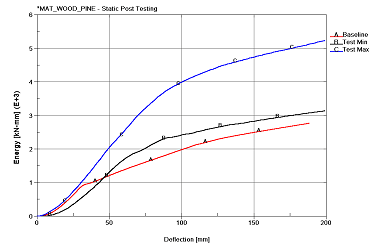
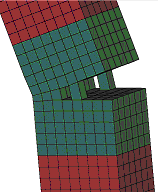
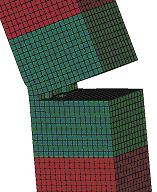
Figure 75. Rounded edge on brace. 13.2 - Baseline Model Versus Test ComparisonThis section compares baseline simulation results to physical testing for the static post test. The initial behavior of the model is good; however, during fracture, the material model is too weak (as shown in figures 76 and 77 below).
Figure 76. Force deflection: Baseline versus test.
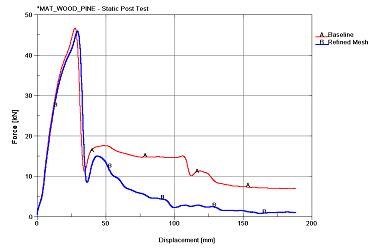
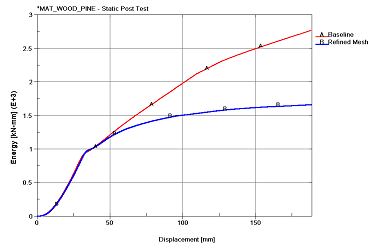
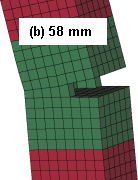
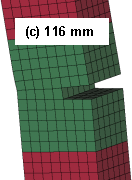
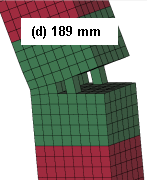
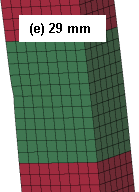
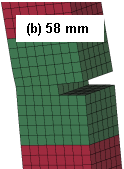
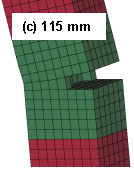
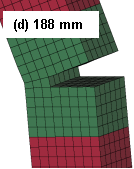
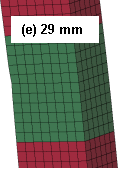
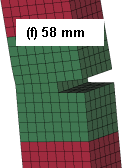
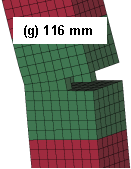
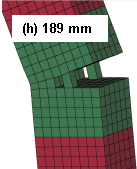
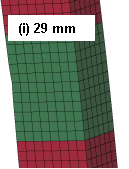
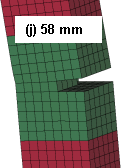
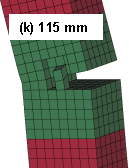
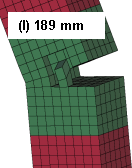
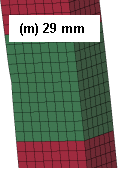
Figure 77. Energy deflection: Baseline versus test. 13.3 - Baseline Versus Refined-Mesh ComparisonThis section shows that the wood material model is mesh-size dependent. After the initial fracture, the reduced-size mesh is shown to be much weaker than the baseline mesh (as shown in figures 78 and 79). The baseline mesh uses an element size of 25.4 mm by 25.4 mm by 25.4 mm, while the refined mesh uses an element size of 12.7 mm by 12.7 mm by 12.7 mm.
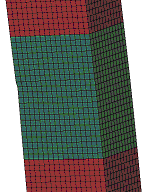
Figure 78. Rounded edge on brace.
Figure 79. Energy deflection: Baseline versus refined mesh.
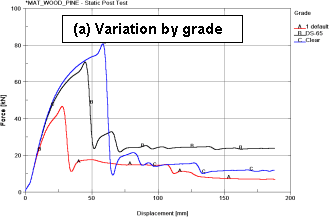
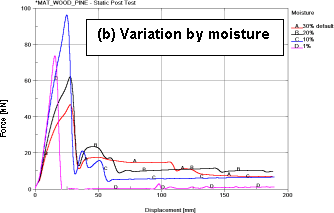
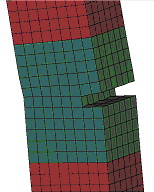
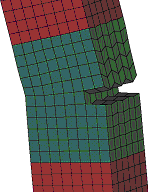
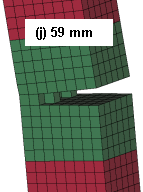
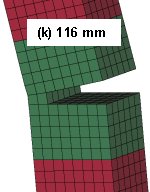
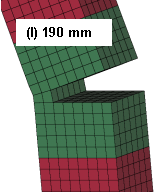
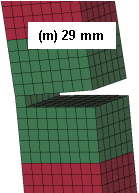
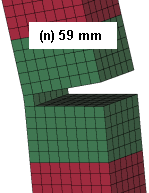
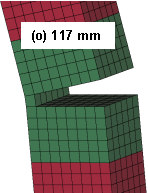
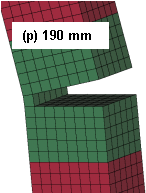
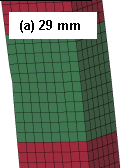
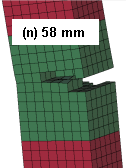
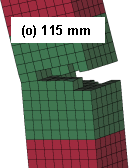
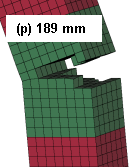
Figure 80. Variations by mesh size: Deformed geometry. 13.4 - Parameter StudyForce-Deflection Behavior: *MAT_WOOD_PINE, Static Post Test Simulation
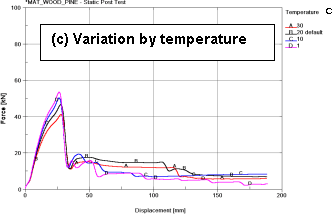
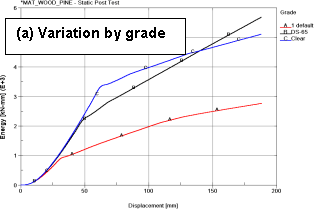
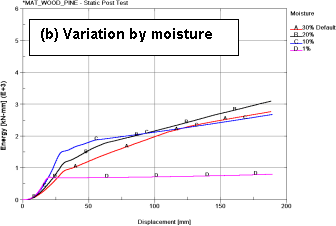
Figure 81. Force-deflection behavior as a function of grade, moisture content, and temperature. Energy-Deflection Behavior: *MAT_WOOD_PINE, Static Post Test Simulation Figure 82. Energy-deflection behavior as a function of grade, moisture content, and temperature.
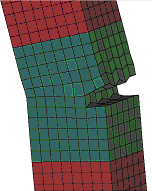
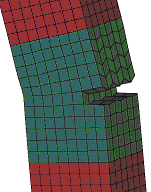
Figure 83. Variation by grade: Deformed geometry.
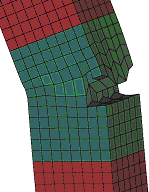
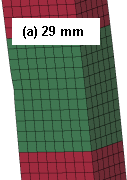
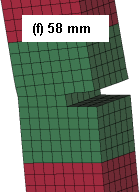
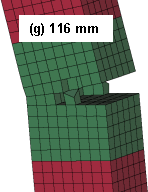
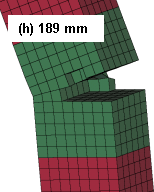
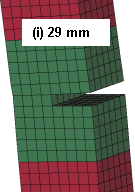
Figure 84. Variation by moisture content: Deformed geometry.
Figure 85. Variation by temperature: Deformed geometry. |
||||||||||||||||||||||||||||||||||||||||||||||||||||||||||||||||||||||||||||||||||||||||||||||||||||||||||||||||||||||