U.S. Department of Transportation
Federal Highway Administration
1200 New Jersey Avenue, SE
Washington, DC 20590
202-366-4000
Federal Highway Administration Research and Technology
Coordinating, Developing, and Delivering Highway Transportation Innovations
 |
| This report is an archived publication and may contain dated technical, contact, and link information |
|
Publication Number: FHWA-HRT-04-096
Date: August 2005 |
||||||||||||||||||||||||||||||||||||||||||||||||||||||||||||||||||||||||||||||||||||||||||||||||||||||||||||||||||||||||||||||||||||||||||||||||||||||||
Evaluation of LS-DYNA Wood Material Model 143PDF Version (8.16 MB)
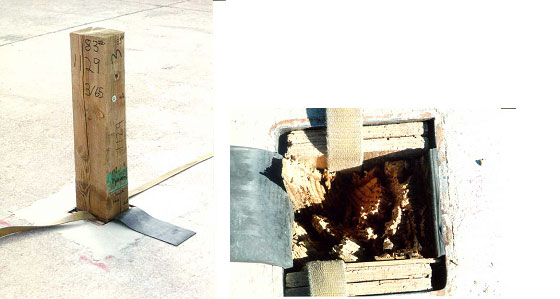
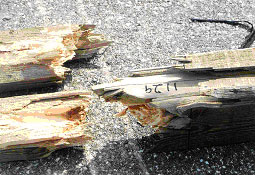
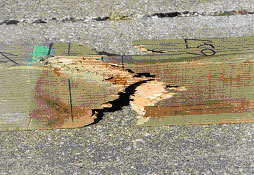
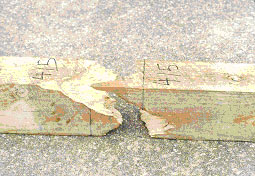
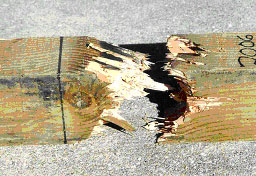
PDF files can be viewed with the Acrobat® Reader® 6 - Dynamic Post Test CorrelationsThe main objectives of the dynamic post test correlations are to evaluate the wood material model and to select specific default parameters. Although we mainly expected to select rate-effect parameters as a function of grade, we instead adjusted the parallel fracture energies previously selected from the static post tests. The user’s bogie impact test data are reviewed first, followed by correlation of the LS DYNA simulations with the test data. Then, filtering and sampling issues are discussed. Finally, the results from a number of parametric studies are reported. Wood posts installed in the field are typically situated in a deformable medium (such as soil or concrete). The post/medium interaction complicates validation of the wood model. Here, wood posts installed in a fixed-type base are analyzed to eliminate post/medium interaction and to facilitate evaluation of the wood model. 6.1 - Bogie Impact Test DataThe user conducted 80 bogie tests on southern yellow pine posts of five grades (DS-65, 1D, 1, 2D, and 2) and 7 tests on Douglas fir posts of one grade (1).(6) Significant knots and defects were cataloged. The posts were placed in a steel tube embedded in reinforced concrete (as shown in figure 30). The post/steel interface was padded with neoprene on the front and back. The posts were impacted at approximately 9.6 m/s by a 944-kilogram (kg) bogie. A summary of the test results at peak force and rupture is given in table 2. Example force, velocity, and deflection histories are given in figure 31. An accelerometer was located near the center of the bogie frame. Force, velocity, and deflection were derived from the measured deceleration. Post damage in the breakaway region of the post, just below ground level, is shown in figure 32.
Figure 30. Post setup for dynamic bogie impact tests.
(a) Force deflection
(b) Velocity time
(c) Displacement time Figure 31. Processed data from the user’s bogie impact tests.
These test results provide information on post performance versus grade. The user’s results indicate that the DS-65 posts are significantly stronger than all other posts. In addition, the user reports that there is no statistically significant difference in the energy absorbed by the dense and low-density posts. Thus, the posts can be effectively divided into two grades—high (DS-65) and low (all others). These test results also provide information on rate effects. The peak force measured in the dynamic bogie tests is 1.42 times that measured in the static bending tests for the DS-65 posts. Dynamic and static peak forces are similar for the grade 1 posts. This is seen by examining the static and dynamic performance envelopes previously shown in figure 12. 6.2 - LS-Dyna CorrelationsThe developer performed LS-DYNA simulations of the bogie impact tests for four combinations of post material and grade. These combinations are grade 1 southern yellow pine, DS-65 southern yellow pine, grade 1 frozen pine, and grade 1 Douglas fir. Calculated energy-deflection curves are compared to the user’s performance envelopes and measured curves in figures 33 through 36. Calculated bogie velocity-reduction histories are also compared to the user’s measured histories.
The first comparison in figure 33 is for grade 1 pine. Although a parallel fracture energy of 250 Gf
The expected application of the wood model is dynamic, so all default parallel fracture energies are those that are identified through dynamic correlations. On the other hand, all quality factors used in the dynamic calculations are identical to those used in the static calculations; thus, there is no ambiguity about the default quality factors. Similarly, for the DS-65 pine simulations in figure 34, the statically selected fracture energy of Gf II = 380 Gf Deformed configurations for the grade 1 pine simulations are shown in figure 37. Figure 37(a) shows the post surrounded by the rigid support structure. The wood post mesh with the rigid support structure was created by the user. This support structure is removed in figure 37(b) to better view the post failure location. The post breaks just below ground level, in agreement with the location of the breakage observed in the tests. Neoprene, modeled as an elastic material with external damping, is visible along the front and back faces of the post.
6.3 - Filtering and Sampling IssuesIt is important to note that good correlation between the calculated and measured data not only depends on the wood post model, but on the bogie model (geometric and material models) as well. This is because the performance envelopes were derived from deceleration measurements recorded by an accelerometer placed near the center of the bogie frame. No measurements were made on the wood post or the bogie cylinder. The deceleration measurements were sampled at 3200 hertz (Hz) and filtered according to SAE J-211 specifications using a channel frequency class (CFC) filter of 60 Hz (CFC 60). The filtered deceleration histories were multiplied by the bogie mass (approximately 944 kg) to convert to force histories. The filtered deceleration histories were also integrated to form bogie velocity-reduction and post deflection histories. A more thorough discussion of the user’s data-processing technique is given in reference 9. Bogie Models: The user developed and forwarded three bogie models to the developer. The first model is the simplest and is primarily an elastic model. The second model is an enhanced version of the first model. One main enhancement is the placement of neoprene around the bogie cylinder to more realistically model the test vehicle. The bogie materials are modeled primarily as elastic, except that the elastic neoprene includes external damping. The third bogie model is geometrically identical to the second model; however, the bogie materials (except the neoprene) are modeled as rigid materials. All default parameters were selected from calculations performed with the rigid bogie model (third model) (as shown in figure 38).
Figure 38. User’s geometric bogie model used in the developer’s calculations. The developer performed numerous bogie impact calculations with the three different bogie models and derived force-deflection curves from two sources: the bogie deceleration history and the cross-sectional forces in the wood post. Output from some calculations was also requested at two different sampling frequencies: 3200 Hz (every 0.3125 ms) and 10,000 Hz (every 0.1 ms). Sampling Frequency: The effect of the sampling frequency on the rigid bogie response is shown in figure 39. Unfiltered and filtered histories are plotted. The filtered histories are processed with a Butterworth four-pole phaseless digital filter according to the SAE J 211 specification.(8) The filtered bogie acceleration history significantly depends on the output sampling frequency. In fact, the filtered history is inaccurate if sampled at 3200 Hz (the measured sampling frequency) because much of the high-frequency content is missed. One possible explanation for this discrepancy is that the virtual bogie model contains higher frequency content than encountered in the real-world bogie measurements. Another possible explanation is that the measured accelerations were sampled at too low of a frequency and some higher frequency content was unintentionally missed.
Filtered force-deflection curves derived from the calculated deceleration history are compared to the processed test data in figure 39(b). The comparisons demonstrate that the peak force of the calculation sampled at 3200 Hz is overpredicted. The peak force of the calculation sampled at 10,000 Hz is roughly the same as that of the measured data. These calculations are preliminary (prior to selection of the final default parameters previously shown in figure 33) and were performed with QT = QC = 0.6 and Gf II = 50 G Model Type: The bogie model type (rigid or elastic) also affects the calculated acceleration histories. Calculated force-deflection curves from the elastic (first model) and rigid bogies are compared to each other in figure 40 and to a grade 1 pine measurement. Two curves are plotted for the elastic bogie. One curve is derived from a nodal acceleration calculated on the bogie frame at the approximate gauge location of the real-world bogie. It exhibits substantial oscillations despite being filtered and does not correlate well with the measured data. The other curve is derived from a nodal acceleration calculated on the bogie cylinder. It is less oscillatory, with a peak force similar to that of the measured data, although the curve shape is qualitatively different from that of the measured data.
Figure 40. Force-deflection histories calculated from bogie nodal accelerations depend significantly on the bogie type and output sampling frequency. Two curves are also plotted for the rigid bogie?one curve at an output sampling frequency of 3200 Hz and the other at 10,000 Hz (as previously shown in figure 39(b)). Since the bogie is rigid, output from the bogie cylinder is identical to output from the bogie frame. As previously discussed, the curve derived from the 3200-Hz output is in very poor agreement with the data. The curve derived from the 10,000-Hz output is similar to that calculated on the cylinder of the elastic bogie, with a peak force similar to that of the measured data. These comparisons indicate that the computed force-deflection histories depend on the bogie model type (elastic or rigid) and sampling frequency. None of the calculations match the entire measured history, although most peak-force correlations are reasonable. The calculated curves that are post-processed most similarly to the data are derived from the rigid bogie at 3200 Hz (because the data were sampled at 3200 Hz) and from the elastic bogie using the bogie frame node. These calculations are in poorest agreement with the measured data. Therefore, other computed output quantities for validating the model, such as the post cross-sectional forces, the bogie energy output, and the bogie velocity reduction were examined. Wood Post Forces: Although bogie type (elastic or rigid) and output sampling frequency have a significant effect on the filtered bogie acceleration histories, they do not significantly affect the wood post cross-sectional force histories. Force-deflection histories derived from the cross-sectional forces in the post are compared to each other in figure 41. Note that all curves have similar peak forces and shapes, indicating that the details for the bogie model and sampling frequency are not significant in wood post response. This suggests that placing instrumentation on the wood post, rather than on the bogie frame, is desirable for future bogie impact tests. The user is examining methods of placing instrumentation on the posts; however, post breakage and splitting complicate the task.
Figure 41. Force-deflection histories calculated from the wood post cross-sectional forces are not significantly affected by the details for the bogie model or sampling frequency. The wood post force-deflection curves are also compared to the one measured bogie curve in figure 41. Note that the calculated and measured peak forces are similar; however, the calculated response softens faster than the measured response. This indicates that less energy is being calculated in the wood post than is measured from the bogie (as shown in figure 42). The energy-deflection curves are derived by integrating the force-deflection curves. The reduction in bogie kinetic energy (as measured by the accelerometer) is primarily balanced by the energy needed to break the post (as calculated via the cross-sectional forces), plus the kinetic energy of the broken post, and the energy lost to post sliding and neoprene damping. Therefore, it is expected that the post energy calculated from the cross-sectional forces would be less than the bogie kinetic energy reduction. This means that direct correlations between the calculated post energy and the measured bogie energy cannot be made. These calculations were preliminary and were performed with QT = QC = 0.6 and Gf II = 50 Gf
Figure 42. The internal energy calculated to break the wood post is less than the kinetic energy reduction of the bogie. Bogie Energy Histories: Bogie kinetic energy reduction histories can be gathered directly from the post-processor. Unlike the acceleration histories, the energy histories are not significantly affected by the bogie model type (rigid or elastic) or sampling frequency. Therefore, all default parameters (parallel fracture energies) were selected from calculated kinetic energy reduction histories correlated with the measured energy performance envelopes. These correlations were previously shown in figures 33 through 36. 6.4 - LS-DYNA Parametric StudiesRate Effects: The developer originally planned to select rate-effect parameters from good correlations with the performance envelopes. Instead, as just discussed, fracture energies were selected from the correlations because lower values were needed in the bogie impact calculations than in the static calculations. Therefore, the default rate-effect parameters used in the bogie impact simulations were obtained from fits to the data available in the literature.(9,10) Only one set of parameters is implemented as the default parameters for pine and fir, frozen or unfrozen, independent of the grade. For saturated pine, the default parameters give the approximate dynamic-to-static tensile strength ratios shown in table 3. Compressive strength ratios and the ratios at other moisture contents would be different. Here, 0 degrees indicates the parallel-to-the-grain direction and 90 degrees indicates the perpendicular-to-the-grain direction. Strain rates experienced by the wood posts in the bogie impact calculations are below 10/s-1, so dynamic-to-static ratios are not large at this strain rate. Bogie impact calculations performed with and without rate effects at 9.6 m/s indicate that the inclusion of the rate effects increases the peak force by less than 10 percent. However, rate effects may be more pronounced at higher bogie impact velocities. A more thorough discussion of the rate-effect parameters is given in the wood model user’s manual.(2)
Post Breakage: The bogie impact test report does not indicate the time or deflection at which the post broke completely in two. The simulated deformed configurations previously shown in figure 37 indicate that the breakage is incomplete at 180 mm, which is the final deflection of the performance envelope plots. Although this may or may not be correct, parametric studies were performed and it was determined that adjustments in the quality factors affect the deflection at which the post breaks in two. This is demonstrated in figure 43. Here, the default quality factors were adjusted for grade 1 pine from QT = 0.47 and QC = 0.63 to QT = 0.4 and QC = 0.7. The trend noted is that the post will break earlier in time as QT is adjusted downward and QC is adjusted upward. The load-deflection and bogie velocity-reduction curves calculated with either set of quality factors look similar (as shown in figure 44).
|
||||||||||||||||||||||||||||||||||||||||||||||||||||||||||||||||||||||||||||||||||||||||||||||||||||||||||||||||||||||||||||||||||||||||||||||||||||||||