U.S. Department of Transportation
Federal Highway Administration
1200 New Jersey Avenue, SE
Washington, DC 20590
202-366-4000
Federal Highway Administration Research and Technology
Coordinating, Developing, and Delivering Highway Transportation Innovations
 |
| This report is an archived publication and may contain dated technical, contact, and link information |
|
Publication Number: FHWA-HRT-04-103
Date: October 2004 |
|||||||||||||||||||||||||||||||||||||||||||||||||||||||||||||||||||||||||||||||||||||||||||||||||||||||||||||
Characteristics of Emerging Road and Trail Users and Their SafetyPDF Version (1.33 MB)
PDF files can be viewed with the Acrobat® Reader® FIELD DATA COLLECTION PLANThis study evaluated the following characteristics of emerging road and trail users:
In addition to being geographically dispersed, the event sites met several other criteria including:
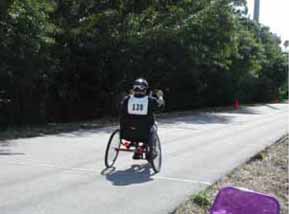
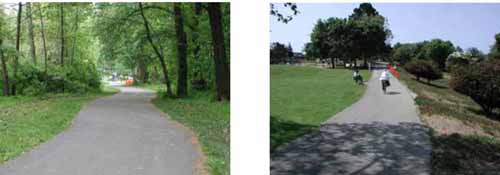
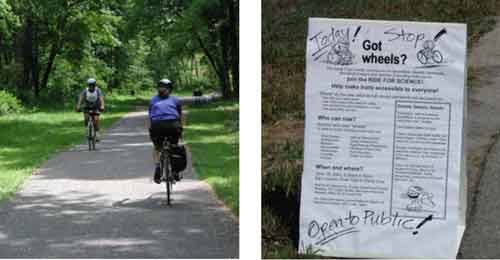
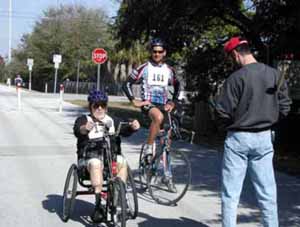
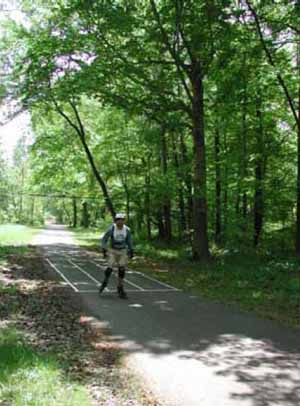
Data were collected by observing trail users at seven stations (figure 19). The trail users consisted of both active and in situ (passive) participants (figure 20). Active participants were those who either were intercepted on the shared use path (via event signage; see figure 21) or responded to the public outreach program and specifically traveled to the location to actively participate in the data collection event. They were recruited through contacts with mode specific clubs (inline skaters, skateboarders, Segway users), seniors' centers, and schools. Flyers were placed in sporting goods stores and parks. Advocacy groups for disabled individuals were also contacted. Active participants registered with the data collection team and generally progressed through all the data collection stations. In situ participants were those who were on the shared use path just "passing through" the event stations. Thus, at all seven stations, data were collected from active participants. At two stations, speed and lateral operating space, data were also collected on in situ participants.
A total of 551 in situ participants and 260 active participants were observed at the three events (table 5) for a total of 811 participants. Table 5. Active and in situ participants at each event.
Age and gender were obtained for many of the active participants. The ages ranged from 5 to 88, and the breakdown by equipment type is shown in table 6. Table 6. Gender distribution and ages of active participants.
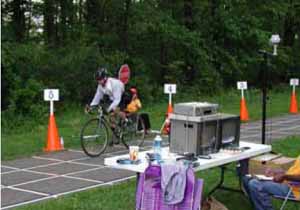
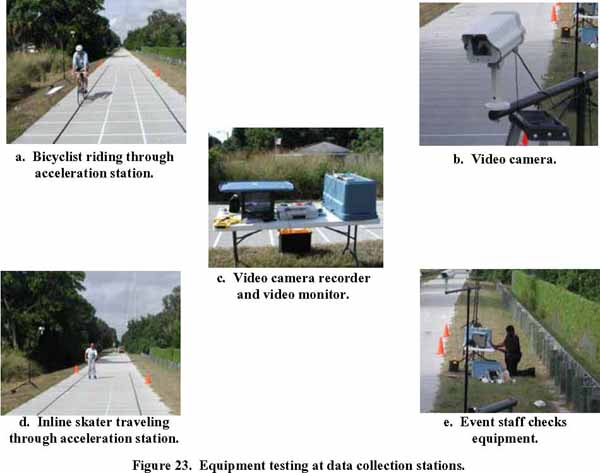
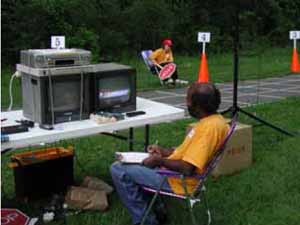
The physical characteristics (Station 1) and three-point turn widths (Station 2) were measured using tape measures. Synchronized video cameras were set up to record participant movements at the other stations (figure 22). Several types of video logging, including digital video, were employed to capture and document the operational characteristics of emerging road and trail users and their safety. The accurate and precise video documentation of the user groups was essential to the success of this study. As technology has advanced, digital data collection equipment has become more economical and productive. Thus digital technology was used at all stations to ensure optimized precise viewing, timing, and subsequently convenient downloading of data. Highly specialized audio-visual staff was directed by the Assistant Principal Investigator to provide the technical setup, supervision, and maintenance of the video-based stations to ensure maximum efficiency. This decreased the margins for error, assuring a complete one-time setup (after the pilot testing, of course). Another important consideration in planning data collection was the methodology employed at each survey data station. Each station was preliminarily designed and extensively pilot tested, considering any earlier research and developing several options for data collection techniques (figure 23). During the subsequent data reduction and analysis portions of the study, because all data had been collected digitally, the data could be computer interfaced to streamline the data reduction and analysis times.
A precursor to determining equipment needs was an understanding of the objective (operational consideration) of each station, the station's unique data objectives, and, ultimately, the design application of the information. Accordingly, the survey station designs, data collection, and analysis was planned in a comprehensive manner so that future facilities design can be done more accurately and that the safety of road and trail users will be enhanced.
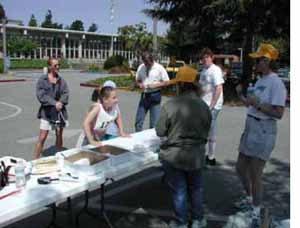
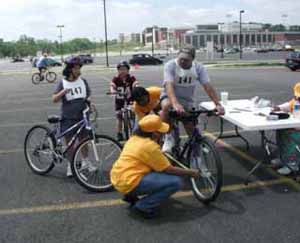
This applications-focused backdrop helped determine the specific equipment used at each station. Each station also required extensive pilot testing and technical analysis of equipment options from the video recording media to the quad synchronization communication devices. Various temporary pavement markings (for data reduction reference) were tested to maximize data reduction accuracy while minimizing effects to normal trail operations (figure 24). Following each data collection event, the videotapes were converted to digital format and subsequently viewed to reduce the data and determine operational characteristics, as described below for each of the seven stations. Registration desks were established for each data collection event (figure 25). Participants who responded to the outreach campaigns or trail intercept signage signed in and were given a briefing on the purpose of the study, an overview of the event and course, and safety provisions.
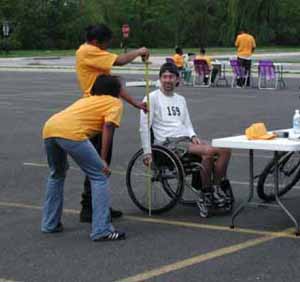
Station 1-Physical CharacteristicsAt the first station, the physical characteristics of active participants and their equipment were measured (figure 26). These included:
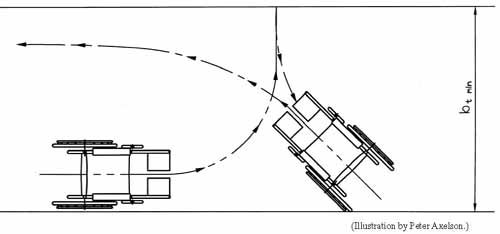
These physical dimensions can be used by practitioners to provide an assessment of users' operational characteristics and facility design features that are critical to some user groups. For example, pavement condition requirements for a user group depend on the size and type of wheels and tires of the device or vehicle. Large-wheeled vehicles and devices like bicycles and jogging strollers can be used on a variety of pavements. Small-wheeled devices like skateboards, inline skates, and kick scooters are nearly impossible to use on unpaved surfaces and can be uncomfortable and difficult to operate on rough pavements such as chip seal and asphalt with large aggregate. Similarly, pavement condition is a factor in wheelchair travel. Manual and powered wheelchairs that are built to optimize indoor maneuvering will not be as usable in the outdoor environment. For motorized scooters, wheelchairs, and other assistive devices, the critical measurement is width, which is necessary to determine the minimum clear width for passage. Section 4.2.1 of the ADAAG requires a minimum clear width of 815 mm (32 inches) at a point, and 915 mm (36 inches) continuously, for single wheelchair passage. In addition, Section 4.2.2 of the ADAAG requires that the minimum width for two wheelchairs to pass is 1525 mm (60 inches). Maneuvering around a turn requires additional space for wheeled devices. Where bollards, fences, gates, or turnstiles restrict access to shared use paths, users may have difficulty getting their devices through the restricted area. The results of this research will help provide facility designers with the information needed to design for both accessibility and safe operation. Station 2-Three-Point TurnA three-point turn is defined as a maneuver where the user starts at one edge of the shared use path, makes a forward turn toward the other side of the path, backs up while turning the device or vehicle in the other direction, and then makes a forward turn in the original direction to complete the 180-degree turn. Designers can use this information to select shared use path widths and, if necessary, build wider turnaround areas, so that users can execute U-turns within the confines of the path. To make a U-turn, bicyclists can dismount, pick up their bikes, turn them around, get back on, and ride off in the desired direction. This is often not possible for people with mobility impairments, or other users. Instead, they must be able to turn around in their manual or powered wheelchair, hand cycle, or other device within the confines of the traveled way. However, the turning radius of these devices can make it difficult or impossible for a user to make a U-turn on a narrow shared use path. For example, it was discovered in this research that a hand cyclist can require 4.5 m to 6 m (15 ft to 20 ft) to make a U-turn. In these situations, a multipoint turn is necessary. At this station, active participants were asked to make a three-point turn and the width that they required was measured (figure 27).
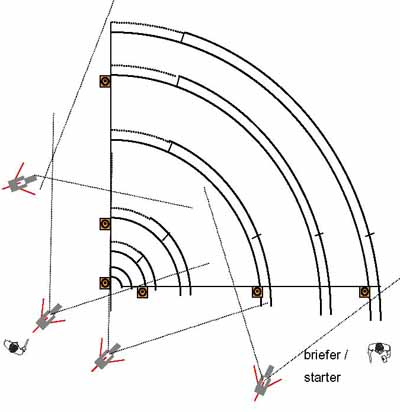
Station 3-Turning RadiiTypical turning radii are critical in determining the horizontal alignment of roads and shared use paths. A bicyclist leans inward (toward the center of a curve) and is likely to slow down while rounding the curve so that he/she does not fall outward due to centrifugal force. The extent of the lean, as measured from the perpendicular, is the lean angle. As the turning radius increases, the bicyclist does not have to lean as much to overcome centrifugal force, holding speed constant. Alternatively, a higher turning radius means that the bicyclist can maintain the same lean angle and travel around the curve at a faster speed. For bicycles, AASHTO (p. 38) recommends a minimum radius of 12 m (36 ft) for a design speed of 20 km/h (12 mi/h), increasing to a minimum radius of 74 m (225 ft) for a design speed of 50 km/h (30 mi/h).(2) This recommendation is based on a 15-degree lean angle.
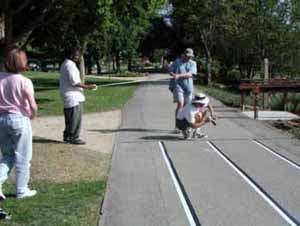
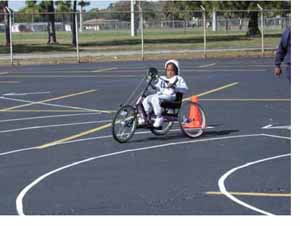
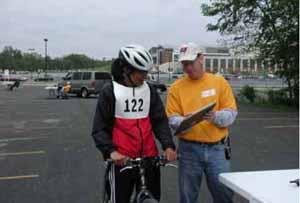
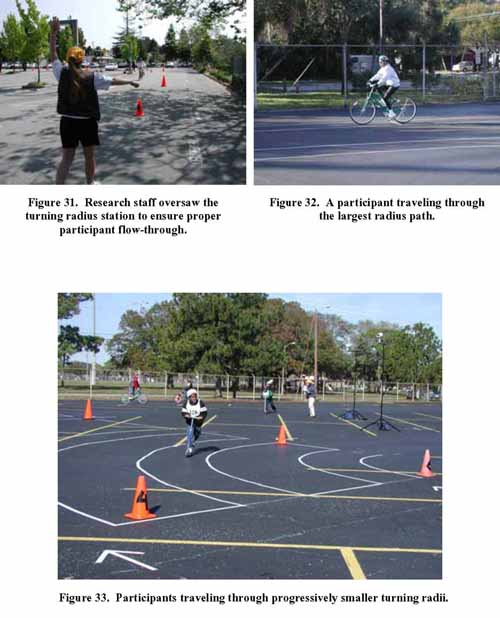
Only active participants were used for the turning radius measurements. Turning paths with predetermined radii were delineated in a large paved area (figures 28 and 29). Careful briefing was done to ensure that participants understood the testing procedure (figure 30). Several research staff oversaw the stations at the various events to ensure proper participant flow-through (figure 31). The participants traveled through the largest radius path first (figure 32). They repeated the process on paths with progressively smaller radii (figure 33). The multiple-synchronized cameras enabled multiperspective time-stamped videoing of active participants as they went through each radius. The composite video was subsequently viewed to determine the times that participants entered and exited each radius. The data entry spreadsheet was set up to calculate the average speeds, based on these recorded times, as participants traveled through each radius.
Station 4-AccelerationThe acceleration rate is defined as the time that it takes for a user to accelerate from a stopped position to a normal cruising speed. Practitioners use acceleration rates to calculate gap acceptance and the necessary intersection sight distance. This is especially important at intersections of shared use paths and roadways where path users are stopped and waiting to cross the roadway. Path users must correctly judge whether gaps in oncoming traffic provide sufficient time to cross the roadway safely, based on the speed of oncoming motor vehicles, their own acceleration capabilities, and the width of the roadway to be crossed.
Acceleration capabilities were measured for active participants. The acceleration data were collected using time-stamped video to determine the elapsed time for the participants accelerating along a 61-m (200-ft) section of the course (figure 34). This section was further subdivided into lines at 12.2-m (40-ft) spacings. Participants were asked to accelerate to their normal running speed (figures 35 and 36). The time when each participant crossed each transverse line was recorded.
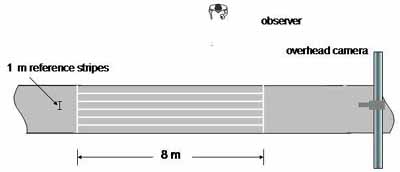
Station 5-Lateral Operating Space (Sweep Width)Space requirements of transportation users are one of the essential inputs in facility design, particularly in determining cross-sectional dimension needs of facilities. The Highway Capacity Manual(26) outlines the levels of service for shared use paths from the perspective of bicyclists, keying on the calculation of passing hindrance,(27) an operational condition affected by relative speed differentials, acceleration rates, and physical space requirements among bicyclists and pedestrians. The proportion of inline skating and other emerging transportation and recreational modes is rapidly increasing on our Nation's shared path facilities. Thus, over time, if the trend continues, the approach of using only bicyclist and pedestrian user groups, as outlined in chapter 11 and 19 of the 2000 Highway Capacity Manual (HCM), to determine a shared use path's level of service (hence design width) may result in under-designed or undersized transportation facilities. User densities within a transportation facility can often influence the space occupied by the various emerging users (Fruin, as referenced in the HCM 2000). For example, for inline skaters and perhaps scooter operators, as the operating conditions become congested, people's freedom to maneuver becomes constrained and speeds decrease, and the operational space occupied by the user may decrease. Accordingly, researchers focused the survey design, hence data collection, of space dimensions to actual occupied horizontal and vertical dimensions of users operating within uncrowded pathway operating sections of the shared use paths. Lateral operating space (or "sweep width") is the width needed by the user to operate in a safe manner under normal conditions. In general, this width is much greater than the measured width of the user in a stopped position. This is especially the case for inline skaters. A person who swerves left and right (such as an inline skater) will occupy more lateral space, and have a wider sweep width, than a person whose movements are parallel to the edges of the trail (such as a bicyclist). Both the tread and max values of sweep width were recorded. The tread is the width of the contact(s) with the ground. For example, the tread of a bicycle is the width of its tires. The tread of a wheelchair is the width from the outer edge of the left tire to the outer edge of the right tire. The max includes the width of the user. For example, a young child bicyclist will have a narrower max than an overweight adult bicyclist. The tread and max values also vary with the path that the participants follow while traveling through this station. A person has wider tread and max values if he/she travels diagonally from the left edge to the right edge of the trail than if he/she travels straight down the middle, parallel to the edges of the trail. Determining the lateral operating space of each user group at varying speeds is important for determining appropriate shared use path widths, given knowledge of trail user volumes and application of the level of service methodologies in the Highway Capacity Manual as calibrated in FHWA's recent "Operation of Shared Use Paths" study. At each event, a section of trail was marked with longitudinal lines (figures 37 and 38). Both active and in situ participants were videotaped as they traveled through this section. The video was subsequently reviewed to determine the tread and max values for each participant.
Station 6-SpeedSpeed is defined as the normal cruising speed of users on a flat, smooth section of a shared use path. The speed characteristics of emerging road and trail users are generally influenced by age, gender, experience, weather and pavement conditions, operating conditions, and facility geometrics.(8) Practitioners can use typical cruising speeds to develop design speeds for each user group. Design speed is critical in determining horizontal and vertical alignments. Speed is also used in calculating necessary sight distances. Time-stamped video was obtained of both active and in situ participants as they traversed the section of trail marked with lateral lines within Station 5 (figure 39). The video was subsequently reviewed to determine the times that participants crossed each of the two lines. The data entry spreadsheet was set up to calculate the average speeds based on these recorded times.
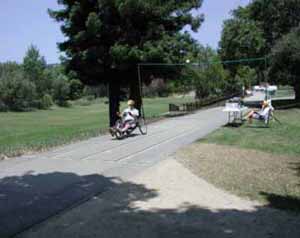
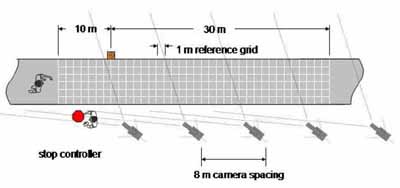
Station 7-Stopping Sight Distance (Deceleration)Stopping sight distance is the total distance traversed by a user between the point where he/she recognizes the existence of an object or situation that requires a stop and the point where he/she has come to a safe stop. This is perhaps one of the most widely used user characteristics in the design of transportation facilities. Stopping distance is based on two components: the distance traveled by the user during his/her perception and reaction time plus the distance required to physically brake to a stop. Accordingly, the stopping distance station was designed to capture both characteristics. The first, the distance traveled during the users' perception and reaction time, was captured with a digital video log similar to the physical setup of the speed studies. Subjects were videoed (from multiple camera positions, see figure 40) within a segment of the shared path. The duration (using a synchronized time display on the video frames) and distance traveled from the "stop" signaling for our downstream-positioned staff to the users' physical commencement of braking was captured on synchronized videos and later reduced by analysis of the video logs. This approach was different from that used by Birriel et al.(8) and Brown,(28) who documented only the braking component of the stopping distance action.
The research team surveyed the second component of stopping sight distance, the actual braking distance, in the following manner. As shown in figure 41, several video cameras were positioned at strategic points around the braking test area. This portion of the camera setup was similar to the methods pioneered by Birriel et al.(8) Data reduction and calculations were done in a similar fashion to that for the perception-reaction component.
AASHTO defines stopping sight distance as: where: d = stopping sight distance t = brake reaction time, seconds V = design speed, km/h a = deceleration rate, m/sec2 (29) The first term in the above equation is the distance traveled during the user's brake reaction time. AASHTO uses a brake reaction time of 2.5 seconds for bicyclists.(2) It is entirely possible that other user groups have different brake reaction times. Of course some variation in brake reaction times is likely among the individuals within each user group. The second term in the equation is the braking distance, defined as the distance traveled once the user applies the brakes and before he/she comes to a stop.
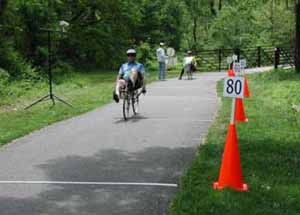
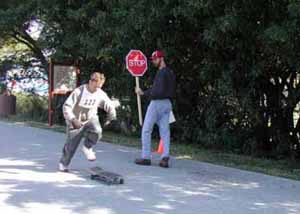
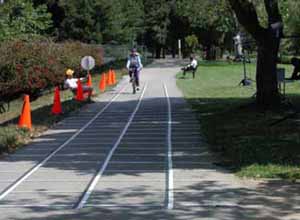
Only active participants were used for stopping sight distance. During the registration briefing, participants were told that at some point along the course they may be presented with a STOP sign, and if so, they were to stop as "quickly as is comfortable." There were several points along the shared use path where the pavement was marked with a 1 m reference grid on the approach to a "dummy" STOP sign controller. This was done to minimize the participants' anticipation of where the stopping maneuver was to occur. The layout of the actual stopping station is shown in figure 40. An orange cone was placed 30 m (100 ft) in advance of the STOP sign controller to mark the AASHTO stopping sight distance for a bicyclist traveling at 30 km/h (20 mi/h). At various points before the participant reached the cone, the STOP sign controller signaled for the participants to initiate their stop (figure 42). |
|||||||||||||||||||||||||||||||||||||||||||||||||||||||||||||||||||||||||||||||||||||||||||||||||||||||||||||