U.S. Department of Transportation
Federal Highway Administration
1200 New Jersey Avenue, SE
Washington, DC 20590
202-366-4000


Skip to content
Facebook iconYouTube iconTwitter iconFlickr iconLinkedInInstagram

Federal Highway Administration Research and Technology
Coordinating, Developing, and Delivering Highway Transportation Innovations

Report
This report is an archived publication and may contain dated technical, contact, and link information
Publication Number: FHWA-HRT-05-073
Date: October 2005

Roadway Safety Hardware Asset Management Systems Case Studies

PDF Version (1.17 MB)

PDF files can be viewed with the Acrobat® Reader®

Appendix C. Summary of AASHTO Survey Results

This graph is a map of the United States with color-coding to designate States that did and did not participate in the AASHTO survey. All States participated except Alabama, the District of Columbia, Georgia, Hawaii, Louisiana, Mississippi, Montana, Nebraska, New Jersey, Oklahoma, South Dakota, Vermont, and Wisconsin.

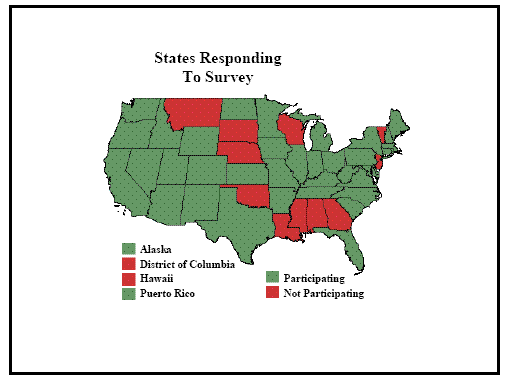
Figure 10. Map. Geographic map showing States that responded to AASHTO survey.

This is a horizontal stacked bar graph. Each stacked bar is divided into two sections: the number of “yes” responses and the number of “no” responses. On the x-axis is the number of States, and on the y-axis is a list of inventory items. The graph indicates that of the 39 responses received, 24 States inventory signs, 27 States inventory signals, 15 States inventory lighting, 19 States inventory supports, 19 States inventory guardrails, 21 States inventory pavement markings, and 17 States inventory detectors.

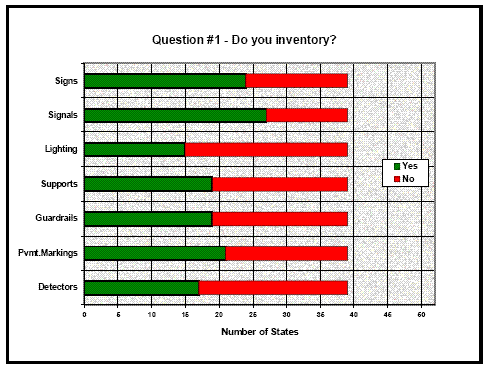
Figure 11. Graph. AASHTO survey results to question # 1: Do you inventory?

View alternative text

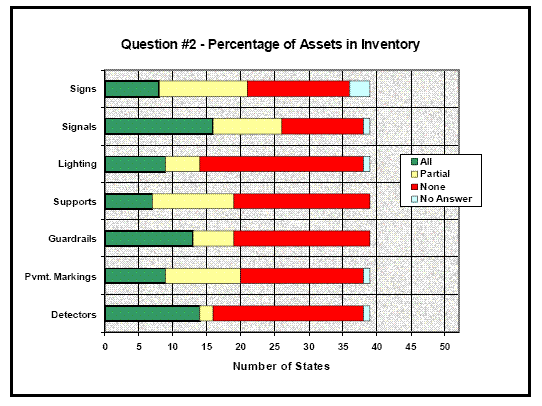
Figure 12. Graph. AASHTO survey results to question #2: Percentage of assets in inventory.

This is a horizontal stacked bar graph. The x-axis indicates the number of States and the y-axis depicts the types of inventory items that were specified when States were asked, if they inventory assets of a type, does that inventory system also track location. Each stacked bar shows the number of States that said their inventory system tracks all locations for assets of a type, the number of States that said their system tracks some locations for assets of a type, and the number of States whose inventory does not track location for assets of a type. 15 States track all sign locations, 7 States track some sign locations, and 3 States track none. 24 States track all signal locations, 2 States track some signal locations. 9 States track all lighting locations, 3 States track some lighting locations, and 2 States track none. 9 States track all support locations, 9 States track some support locations, and 1 State tracks none. 13 States track all guardrail locations, 2 States track some guardrail locations, and 4 track none. 9 States track all pavement marking locations, 19 track some pavement marking locations, and 2 track none. 12 States track all detector locations, 3 States track some detector locations, and 2 track none.

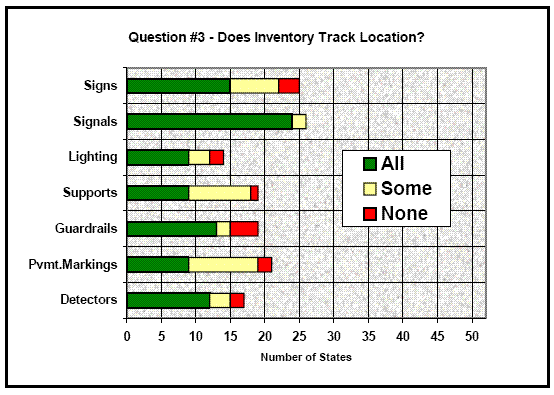
Figure 13. Graph. AASHTO survey results to question #3: Does inventory track location?

View alternative text

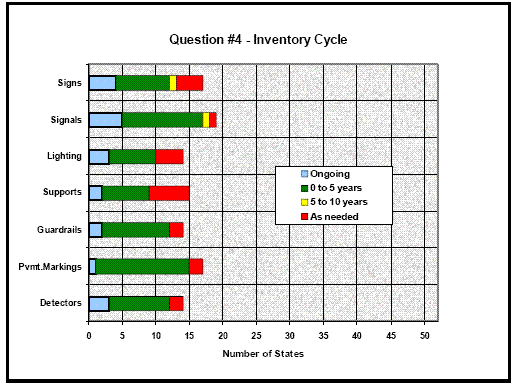
Figure 14. Graph. AASHTO survey results to question #4: Inventory cycle.

View alternative text

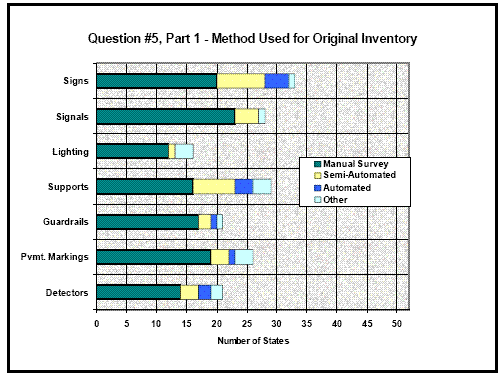
Figure 15. Graph. AASHTO survey results to question #5 (part 1): Method used for original inventory.

View alternative text

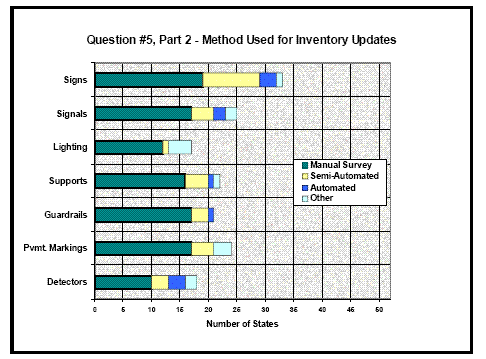
Figure 16. Graph. AASHTO survey results to question #5 (part 2): Method used for inventory updates.

This is a horizontal stacked bar graph. The x-axis indicates number of States and the y-axis depicts the types of inventory items that were specified when States were asked to describe if their funding was allocated on inventory for assets of a type. Each stacked bar shows the number of States that responded “yes” and the number of States that responded “no” by asset type. The graph indicates that of the 39 States that responded to the survey, 10 States said funding was allocated on inventory for signs, 11 said funding was allocated on inventory for signals, 7 said funding was allocated on inventory for lighting, 6 said funding was allocated on inventory for supports, 7 said funding was allocated on inventory for guardrails, 9 said funding was allocated on inventory for pavement markings, and 7 said funding was allocated on inventory for detectors.

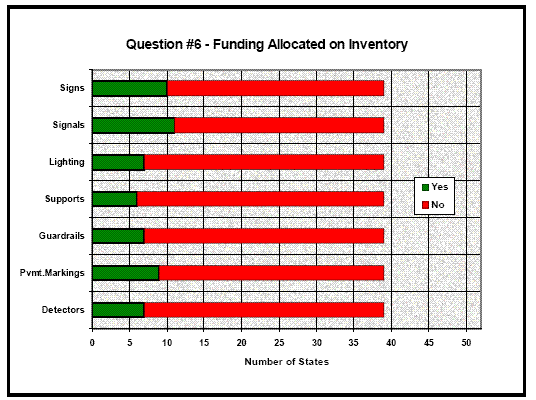
Figure 17. Graph. AASHTO survey results to question #6: Funding allocated on inventory.

This is a horizontal stacked bar graph. The x-axis indicates number of States and the y-axis depicts the types of inventory items that were specified when States were asked to indicate if their budget contained a line item for maintenance. Each stacked bar shows the number of States that responded “yes” and the number of States that responded “no” by asset type. The graph indicates that of the 39 States that responded to the survey, 23 States said there is a budget line item for signs maintenance, 21 said there is a budget line item for signals maintenance, 17 said there is a budget line item for lighting maintenance, 8 said there is a budget line item for supports maintenance, 20 said there is a budget line item for guardrails maintenance, 28 said there is a budget line item for pavement markings maintenance, and 11 said there is a budget line item for detectors maintenance.

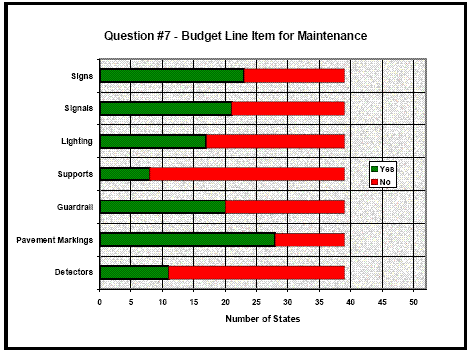
Figure 18. Graph. AASHTO survey results to question #7: Budget line item for maintenance.

View alternative text

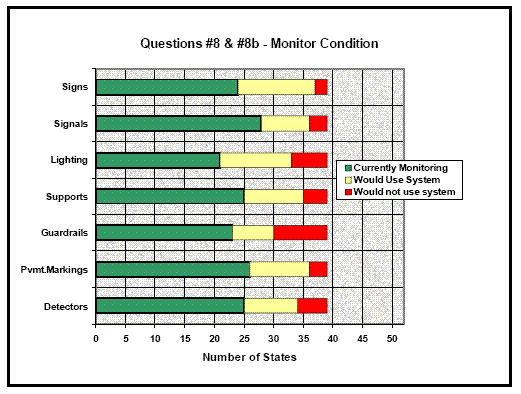
Figure 19. Graph. AASHTO survey results to questions #8 and 8b: Monitor condition.

View alternative text

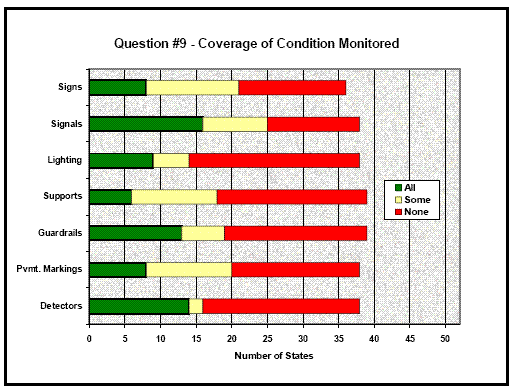
Figure 20. Graph. AASHTO survey results to question #9: Coverage of condition monitored.

View alternative text

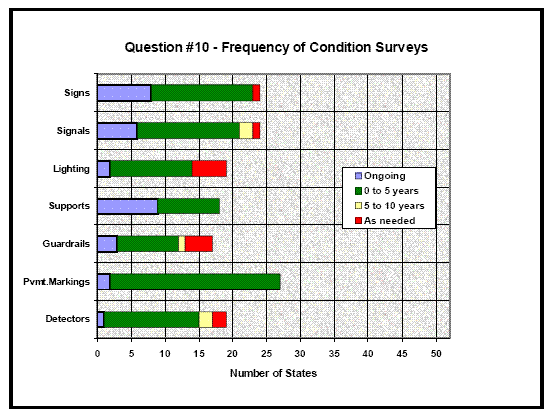
Figure 21. Graph. AASHTO survey results to question #10: Frequency of condition surveys.

View alternative text

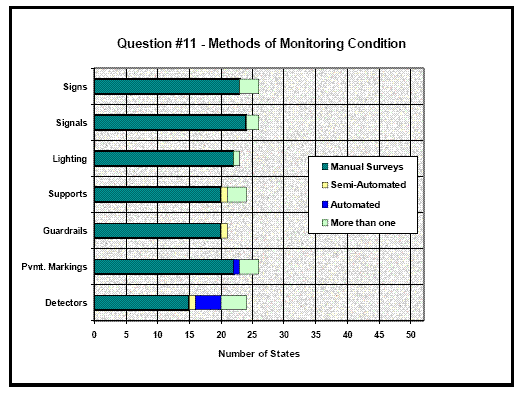
Figure 22. Graph. AASHTO survey results to question #11: Methods of monitoring condition.

This is a horizontal stacked bar graph. The x-axis indicates the number of States and the y-axis depicts the types of inventory items that were specified when States were asked whether their funding was allocated based on condition for assets of a type. Each stacked bar shows the number of States that responded “yes” and the number of States that responded “no” by asset type. The graph indicates that of the 39 States that responded to the survey, 13 States said funding is allocated based on signs condition, 15 said funding is allocated based on signals condition, 10 said funding is allocated based on lighting condition, 11 said funding is allocated based on supports condition, 11 said funding is allocated based on guardrails condition, 11 said funding is allocated based on pavement markings condition, and 8 said funding is allocated based on detectors condition.

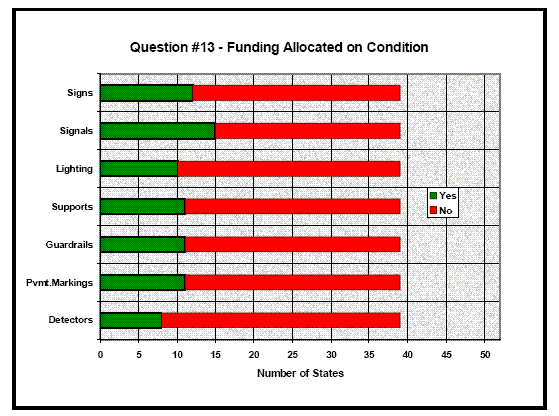
Figure 23. Graph. AASHTO Survey Results to question #13: Funding allocated on condition.

Previous | Table of Contents | Next

Federal Highway Administration | 1200 New Jersey Avenue, SE | Washington, DC 20590 | 202-366-4000
Turner-Fairbank Highway Research Center | 6300 Georgetown Pike | McLean, VA | 22101