U.S. Department of Transportation
Federal Highway Administration
1200 New Jersey Avenue, SE
Washington, DC 20590
202-366-4000
Federal Highway Administration Research and Technology
Coordinating, Developing, and Delivering Highway Transportation Innovations
 |
| This report is an archived publication and may contain dated technical, contact, and link information |
|
Publication Number: FHWA-HRT-05-073
Date: October 2005 |
||||||||||||||||||||||||||||||||||||||||||||||||||||||||||||||||||||||||||||||||||||||||||||||||||||||||||||||||||||||||||||||||||||||||||||||||||||||||||||||||||||||||||||||||||||||||||||||||||||||||||||||||||||||||||||||||||||||||||||||||||||||||||||||||||||||||||||||||||||||||||||||||||||||
Roadway Safety Hardware Asset Management Systems Case StudiesPDF Version (1.17 MB)
PDF files can be viewed with the Acrobat® Reader® CHAPTER 2. CASE STUDIES OF STATE DOT ROADWAY SAFETY HARDWARE MANAGEMENT SYSTEMSAPPROACH TO SELECTION CRITERIAIn January 2000, AASHTO conducted a survey of State DOTs to evaluate the practices of roadway safety hardware asset management systems. In October 2002, FHWA initiated a follow-up e-mail to all FHWA division offices inquiring about updates to the information States provided to the 2000 AASHTO survey. A copy of the correspondence with the FHWA division offices appears in appendix A. A list of the survey questions appears in appendix B. The FHWA division offices provided no updates based on that inquiry. According to the AASHTO study, only one-third of the State DOTs use a hardware management system. A summary of the survey results appears in appendix C. The research team used the AASHTO survey as the basis for its initial approach to State DOTs that indicated use of some type of an asset management system. The research team took the following steps to identify States with fully or semi-integrated roadway safety hardware management systems:
After a comprehensive search for candidate States, the team narrowed the number of candidates for field visits and case studies using the following considerations:
The research team worked closely with FHWA and AASHTO members during the selection process and briefed the project principals during all the stages of research. STATES SELECTED FOR CASE STUDIESThe research team conducted site visits and held numerous discussions with officials from State DOTs, FHWA, and AASHTO. Several States that use a single-asset system are discussed briefly later in this chapter as a sample of typical systems that are in place in many States. This document presents two detailed State model integrated asset management systems, Virginia and New Mexico, which are discussed in more detail in the case studies later in this chapter. Six additional States were selected for case studies:
The research team visited seven of the State DOTs and collected information by phone interviews from Florida. This chapter also contains brief descriptions of a few other States with typical asset management systems (that is, nonintegrated, single-asset management systems):
A number of other States have similar systems in place. The States reported here represent just a sample of the type of systems implemented. During the site visits, the research team met with senior management personnel and technical managers including State DOT and contractor staff in some of the following positions:
The research team conducted interviews and viewed brief system demonstrations in each State visited, collected available documentation, and followed up after the meeting to collect additional information. MODEL INTEGRATED ASSET MANAGEMENT SYSTEMSThe FHWA Office of Asset Management defines data integration as the “process of combining or linking two or more data sets from different sources to facilitate data sharing, promote effective data gathering and analysis, and support overall information management activities in an organization.”; Information about roadside assets and the process for sharing this information is critical to successful asset management; therefore, an integrated asset management system is highly desirable and results in increased effectiveness. As the different systems in each State were studied, it became clear that few State DOTs have implemented integrated systems to manage all seven asset categories identified for this study (roadway signs; signals; roadway lighting; supports and structures for signs, signals and lighting; guardrails and barriers; pavement markings and treatments; and detectors). Most States have implemented asset management for one or more of the asset categories and put several nonintegrated systems in place. Two different models of integrated asset management systems emerged as seeming the most progressive among the States in this study. These models, New Mexico and Virginia, present a different approach to the integrated system of managing roadway hardware. New Mexico uses a video system to capture roadway assets and extracts detailed data for each asset from the video image. A feature called “Virtual Drive” allows system users to simulate driving along any roadway in the State system and view clearly and accurately the hardware along the route. Virginia envisioned managing its assets through its entire life cycle-condition assessment, planning, alternatives evaluation, project development, and implementation. An initial system module was developed based on an inventory system with a statistical, random sampling using manual data collection. Following is a discussion of these two State DOT systems. New Mexico State Highway and Transportation Department The New Mexico State Highway and Transportation Department (NMSHTD) provides one model of a fully integrated asset management system. NMSHTD has two primary asset management systems: Road Feature Inventory (RFI) and Highway Maintenance Management Systems (HMMS), described in the following paragraphs. Road Feature Inventory System Description The NMSHTD Road Feature Inventory RFI system maintains an extensive database on the entire New Mexico roadway system to ease maintenance and limit legal liability by documenting safety assets. Images have been captured statewide at every 15.24 m (50 ft) of highway with a video image width of 36.58 m (120 ft). Along with the images, information is collected on the NMSHTD roadway safety assets and roadway features. The result is a database, the RFI, of more than 5 million images and their associated data, forming the foundation for a number of applications used to manage the State’s highway assets. The RFI project started in June 2001 when NMSHTD engaged a contractor for data collection. The contractor is collecting data on all right-of-way assets on all NMSHTD-maintained roads. The development of the RFI application and database was initiated in-house by the Highway Operations IT development staff, assisted by a contractor. Video images have been filmed on approximately 24,140.16 kilometers (km) (15,000 miles (mi)) of centerline on roads operated by the State, and approximately 690,000 assets on State highways have been inventoried using video taken in each driving lane. The van that captures the video can be driven at up to 88.51 kilometers per hour (km/h) (55 miles per hour (mi/h)) running speed. Each NMSHTD district is divided into DOT patrols that maintain specified areas. The video is identified by districts and patrol number. When the application is fully implemented, patrol personnel will be equipped with Global Positioning System (GPS)-enabled personal digital assistants (PDAs) and either a digital camera laptop or a pen tab and a digital camera. Personnel can update, insert, or delete assets from their PDA laptop and then synchronize with the database when they return to the office. Because so much of New Mexico is rural, wireless access to the application is not an option. An image will be associated with each new asset added to the database or changes made to an asset. One of the two main components of RFI is reporting. The reporting component interfaces to the HMMS that districts use to enter daily work reports and maintain stockpile and similar information. At the time of this writing, NMSHTD has plans to integrate the RFI and HMMS applications to maximize efficiency and provide data integrity. For example, a user who enters a work order for a guardrail is directed to the RFI application to update the relevant inventory. The RFI application feeds the HMMS system to reflect updates to the RFI database for maintenance done on the road, which keeps the inventory current. Users access the system through an Oracle® portal to generate reports using Oracle Reports Builder®and Discoverer® applications. Figure 1 shows a typical van used to collect the video images. The van is fully equipped with cameras, computer equipment, and lasers to capture pavement conditions and road geometry.
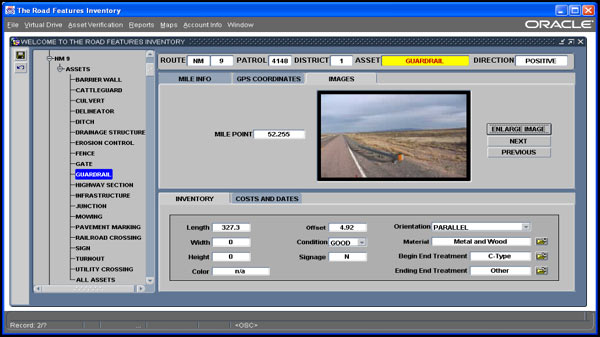
Figure 1. Photo. Data collection van. The report feature incorporates images stored in the database with the data. Figure 2 shows a sample image of an RFI report interface.
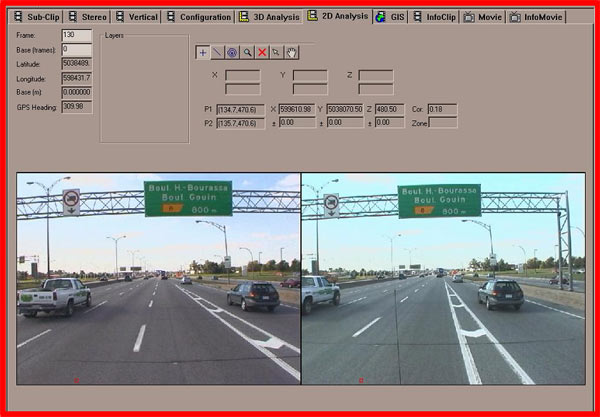
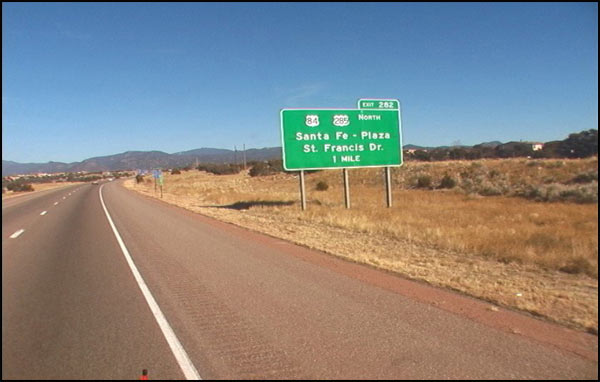
Figure 2. Screen Capture. Sample image in the New Mexico RFI application. The second main component of the RFI application is known as “Virtual Drive.” By choosing a route, a direction, and start mileposts and end mileposts, a user can take a tour of the route on the computer screen. Users can interact with the application much like a videocassette recorder (VCR), pressing a button (similar to the “play” button) to create the effect of driving down the chosen route and viewing the images one after another. All departments at the NMSHTD will be able to use the Virtual Drive feature to improve their asset management capabilities. For example, the State Maintenance Bureau will be able to use Virtual Drive to pinpoint an area of highway that needs maintenance or lacks appropriate signage. Periodic comparisons to historical records can help identify missing signage. The legal department will be able to use the Virtual Drive to verify if the route was safely signed or if a guardrail was located where it needed to be. Figure 3 shows a Virtual Drive screen capture of a sample image comparison. Figures 4 through 7 show additional RFI images. Figure 3. Screen capture. Comparison of sample images in the New Mexico RFI Virtual Drive application.
Figure 3. Screen capture. Comparison of sample images in the New Mexico RFI Virtual Drive application.
Figure 4. Screen capture. Sample RFI image showing roadside guardrail.
Figure 5. Photo. Sample RFI image showing interstate sign.
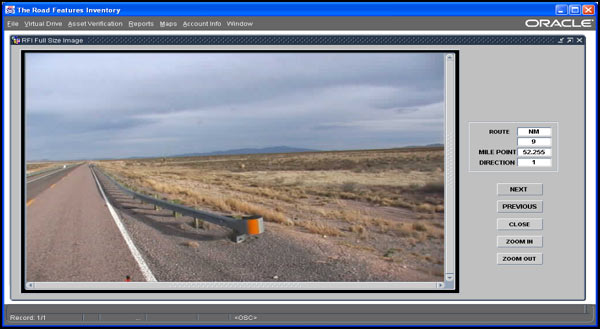
Figure 6. Screen capture. Sample RFI application screen with thumbnail image.
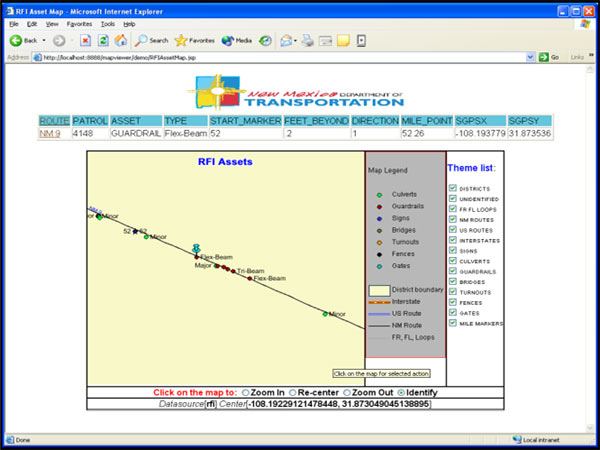
Figure 7. Screen capture. Sample New Mexico RFI spatial map with assets identified. Of the seven asset categories in the FHWA project, only lighting and detectors are not included in the New Mexico program. In New Mexico, lighting is maintained by local governments, not the State DOT. Nonetheless, the video can easily pick up the roadway lighting information as well. The State is eliminating the use of magnetic detectors and making a transition to the use of video technology. Table 1 lists the asset category of data collected in the New Mexico RFI program. Table 1. New Mexico RFI data collected.
Data on assets are collected based on a master asset list (MAL). Some fields from the MAL initially will be empty and populated continuously (for example, installation dates). Assets can be broken down into either point assets such as signs or linear assets such as guardrails that have a start and end point. Table 2 lists assets in each category. Table 2. New Mexico RFI asset types.
The RFI project has identified 31 types of assets and their respective attributes or characteristics, listed in table 3. Each asset has common attributes such as description; condition; material; X, Y, and Z coordinates; start and end milepost; start and end mile point; height; and length. Some asset attribute information varies depending on the asset type. Note that these assets types were determined by the New Mexico RFI project for its own program and may vary from other States’ asset definitions. Table 3. The 31 RFI assets and their definitions.
The RFI software application is in an Oracle9iregForms application. The application was initially developed in-house by the IT department but is currently being completed by a consultant. The application uses an Oracle9i Database, Oracle interMedia, Oracle9i Application Server, Oracle Portal, Oracle JDeveloper, and Oracle Discoverer. The RFI application also uses other key database technologies including partitioning, Oracle Recovery Manager (RMAN), materialized views, and virtual private database. The NMSHTD database system manages more than 5 terabytes (TB) of JPEG images in the RFI application and approximately 1 million traditional (nonmedia) assets that account for approximately 100 gigabytes (GB) of storage. Using Oracle9i database as the image data store has simplified application development and enabled powerful indexed searches that speed route image information retrieval. The database server runs the Oracle software in Windows 2000 on an HP server with 8 GB random access memory (RAM) and 5 TB of network storage. The application server consists of Oracle9i AS running on Windows 2000 on an HP server with 8 GB of RAM and 500 GB of local disk storage. Road Feature Inventory Data Collection Data collection is performed by each district, and State patrols query all the data in their districts. New data are added as needed and identified by milepost. Among the data collected are pavement performance data such as roughness and pavement condition ratings. The RFI system is approximately 92 percent populated. The remaining data collection activities include collection and processing of 60,000 assets and missing pieces of data, most of which are on ramps and interchanges. New data entry continues without special funding; the State will continue data collection as assets need to be repaired or replaced. The initial cost of the RFI development was $2 million. At the time of this writing, an estimated $500,000 in additional funds would be required to complete the missing data acquisition process and implement the corrections. In addition to electronic data collection methods, the State uses the RFI asset verification form in the field. This form is filled out manually on paper for entry back in the office. All districts have access permissions enabling them to enter data, but they cannot view data from other districts. The RFI has been online on the NMSHTD intranet since early 2003. At the time of this writing, the system was scheduled for completion in 2005, when all collected data are anticipated to have been loaded into the database. Plans exist to integrate RFI with other State systems such as the pavement and bridge management systems so that all of State asset management systems will ultimately be supported by a single integrated database. It will also allow NMSHTC to use RFI to meet maintenance requirements and capture the value of assets for accounting purposes. Road Feature Inventory Quality Assurance The State uses the districts to verify the data received from video, which are about 89 percent accurate. The State benchmark is set at 95 percent for accuracy, which is generally achieved as the districts correct their data. An example of insufficiently accurate data occurs when data collection for a segment of road needs to be repeated because of inadequate sunlight conditions. The State used committees to develop the quality assurance/quality control (QA/QC) protocols, and the key district staffs were trained on the database. The State district office staff and the State maintenance engineers and managers are among the primary users. The QA procedures include a series of survey protocols that are followed throughout every project:
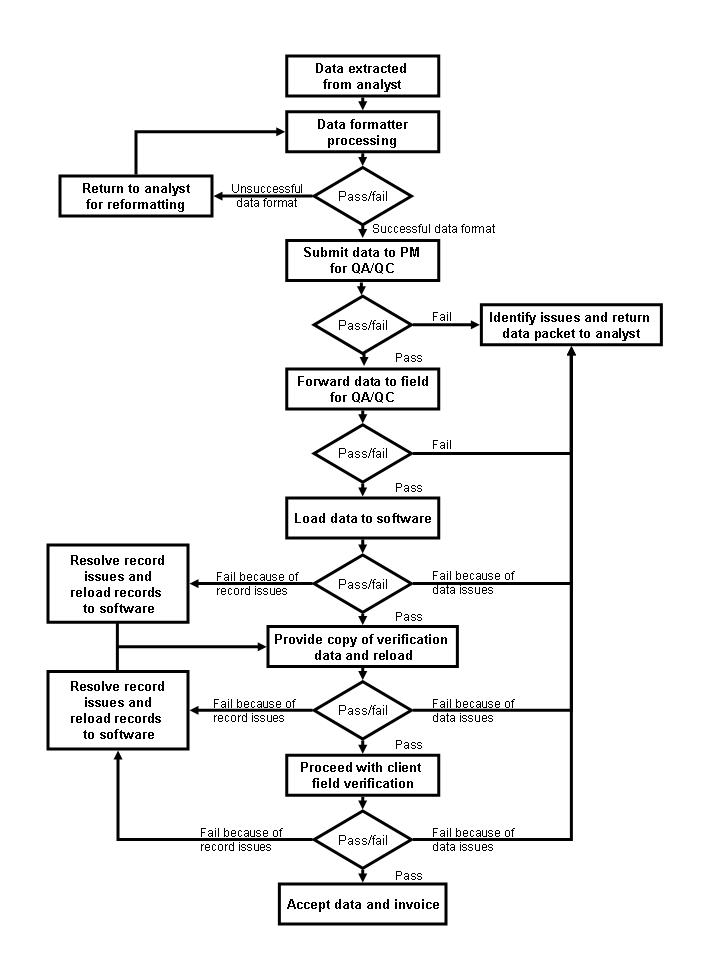
At the conclusion of the field surveys, a data collection technician completes a detailed review with the raw and processed data using trend analysis, video, and, if required, field verifications. Information on pavement performance and asset is audited. Figure 8 illustrates a sample flowchart with QA/QC checks for processing video images into the software.
Figure 8. Chart. Sample flowchart of RFI QA/QC checks. Highway Maintenance Management System Description The NMSHTD Highway Maintenance Management System (HMMS) is a collection of highway information on labor, equipment, commodities, and maintenance management processes. This system is a proprietary database, separate from the RFI. One purpose of the HMMS is to help NMSHTD use its resources in the most efficient manner to maintain the roadways for which it is responsible in the best possible condition. HMMS provides a guide to assist field personnel in managing maintenance operations effectively. The HMMS is a tool designed to support all department maintenance personnel and help maintenance supervisors and managers make decisions. It is used for daily work reports, maintenance activities, and patrol reports. Crew members can identify their time and track their spending. The State uses the system to calculate the cost per mile for road maintenance. Other applications are for summaries to legislators and maintenance activity reports. To instruct the many and varied users, the State in 1998 issued an internal handbook on the use of HMMS. This manual was prepared in three versions: General Office Operations, District Operations, and Patrol Operations. Each version is customized for the indicated level of operation. The HMMS, which builds on the department’s previous maintenance management system, exchanges information with three of the department’s other computerized systems:
All maintenance personnel, and particularly supervisors and managers, are involved in the maintenance management cycle of planning, organizing, directing, and controlling the work. Department personnel use the different screen sets of the HMMS throughout the management cycle. The information collected for and stored in the HMMS assists maintenance personnel in many ways. In particular, the information accomplishes the following tasks:
HMMS is a system that manages the maintenance and budgeting activities as well as the schedule of crews. Following is a list of pertinent facts:
NMSHTD was one of the first States to develop an HMMS, which was implemented in July 1998. The system, which was acquired from the contractor, was designed as an interactive planning, budgeting, and reporting tool. It uses Oracle and Oracle-based tools, and consolidates several documents into a single data-entry process through a data-entry system at the district patrol and crew level. New Mexico has been using asset management systems since 1978; however, the earlier system was a mainframe program with limited planning and budgeting adjustment flexibility. The department began to consider replacing this system in 1994; however, after reviewing systems from Arizona, Utah, and Colorado, the NMSHTD determined those systems would not fully meet its needs. HMMS project planning began in 1994. The process involved interviews with more than 100 maintenance personnel leading to development of the system requirement definition. A Request for Proposal (RFP) for the HMMS was published in March 1996. A contractor was awarded the contract, and work began in September 1996. The system was fully implemented in 1998, when it was installed statewide. The HMMS, with a project cost of approximately $2.1 million, is fully populated and functional. New Mexico is one of the few States that owns the source code for its HMMS, which allows the State to maintain the software internally without licensing or other maintenance fees. Following the demonstrated success in New Mexico, a number of other States including Georgia, South Carolina, and Tennessee have since implemented an HMMS. Highway Maintenance Management System Data Collection Table 4 lists the categories of New Mexico HMMS data collected. Table 4. New Mexico HMMS data collected.
HMMS Current Status and Future Plans Plans include system upgrades when the RFI project is complete. In addition, the two databases are to merge into one database. The integration of HMMS with RFI will figure in NMSHTD plans. NMSHTD recognizes the importance of coordinating integration planning with the IT department, and it plans for central coordination for applications and development of any future software. RFI and HMMS integration details are not yet determined; however, HMMS has road feature components that will be replaced by RFI data. Three interfaces-Maintenance Management System (MMS), Pavement Management System (PMS), and RFI-are also planned for the future, but these interfaces are at least 2 years away. The system currently exchanges data with three other systems:
Virginia Department of Transportation The Commonwealth of Virginia has the nation’s third largest State-maintained highway system (after Texas and North Carolina). This system includes approximately 91,732.61 km (57,000 mi) centerline miles of interstate, arterial, regular primary, and secondary roads, and more than 18,800 total structures, including 12,600 bridges located in 135 counties. To make the best possible maintenance investment decisions, the Virginia Department of Transportation (VDOT) initiated a comprehensive maintenance and operations business process reengineering (BPR) effort in 1995. This effort laid the groundwork for what is now widely known as transportation asset management. Inventory and Condition Assessment System Based on recommendations from the BPR effort, VDOT initiated the development of infrastructure decision-support systems and a large data collection program, referred to as the Inventory and Condition Assessment System (ICAS). In 2002, the Virginia General Assembly passed legislation that requires VDOT to incorporate the principles of asset management into its maintenance and operations practices. This legislation was one of the main drivers for VDOT to develop a modernized integrated asset management system. This new data integration strategy has enabled VDOT to make significant progress in developing decision-support tools and integrating asset management data without waiting for the details of the final Asset Management System (AMS). A discussion of the ICAS and AMS systems follows. ICAS Description The scope of the ICAS project was to collect inventory and condition data for all roadway assets that existed within the VDOT highway fence-line boundaries. VDOT structured its approach in several phases: A pilot phase (Phase 1) to prove and fine tune the concept and procedures, a statewide implementation phase (Phase 2), and a steady state or full deployment phase (Phase 3). Additional measures used to mitigate project risk to VDOT included employing a fixed-price contract and conducting a phase-gate review or an end-of-pilot evaluation that allowed for adjustment and repricing before beginning the statewide effort. Development of the prototype ICAS system began in 1997. A contractor provided support to VDOT with BPR work from 1995 to 1996, and then developed the initial ICAS performance and business requirements. In 1998, following a request for proposal, VDOT selected a prime contractor and team of subcontractors. The prime contractor performed overall project management, data collection, and training. Subcontractors developed an ICAS system, performed system integration and systems training, and provided database support, GIS integration, mapping, and aerial photography analysis. The contractor also proposed a commercial off-the-shelf (COTS) data management system developed in the United Kingdom that accommodated multiple linear referencing systems. The system needed modification to fulfill the VDOT requirements. For the pilot project, VDOT selected Fairfax, Fauquier, and Augusta counties. Combined, these three counties represent about 10 percent of State-maintained lane miles. VDOT used video logging, GPS backpacks, and digital satellite imagery to collect data for the ICAS. Following is a list of key ICAS project deliverables:
ICAS has also captured a GPS-referenced digital video log along every segment of highway. These were used to develop centerline coordinates of the roadway network. Infrastructure inventory data derived from these images are available in ICAS. The forward images, collected every 16.09 m (52.8 ft), are available in the VDOT geographic information system (GIS) and can be accessed through the VDOT intranet. The initial concept for ICAS was to be a tool to support the AMS and provide information for statewide budgeting and planning. The goal of the completed pilot project was to collect inventory, condition, and location information for a comprehensive set of assets. A secondary goal was to store, access, and demonstrate use of this data in strategic and tactical day-to-day asset management decisionmaking. ICAS is a PC-based client-server system based in Exor, a proprietary software system from the United Kingdom. VDOT had acquired licenses to use the system and decided not to upgrade it. VDOT is currently building the AMS and Oracle spatial database with in-house staff. The primary users of ICAS include district maintenance staff for budgeting, planning, and scheduling work. Users were trained by the contractor and VDOT. ICAS Data Collection VDOT collected information for 42 assets, including fences, ditches, and rest areas. ICAS was a complete assets inventory, fence line to fence line. It collected asset management data in the categories listed in table 5. Table 5. Virginia ICAS data collected.
ICAS, now fully populated for the three pilot program counties, is being integrated with the RCA so that all data will reside in an Oracle spatial database. The database architecture is based on the NCHRP 20-27 data model. ICAS is fully integrated in the seven data categories in this study. Other AMS tools will be integrated with the AMS Oracle spatial database, including the following systems:
ICAS Quality Assurance The highway network centerlines were accurate to a precision of 3.05 m (10 ft), exceeding the VDOT specifications. This accuracy was evaluated against known control points established by an independent subcontractor. A robust QC process was implemented for the project. For the data collection, a double-blind test was conducted. After the collection was complete, random, separate QC segments were assigned to QC inspectors, who independently examined the assigned area. The results, which were overlaid on the production results to check the correlation, showed that the data collection was easily meeting contract requirements of +/? 5 percent accuracy at the 95 percent confidence level. A similar procedure was used for the image collection QC. The QC effort during the pilot was extensive. The use of the double-blind QC procedure, while ensuring independent data verification, was also expensive and time consuming. An independent project evaluation confirmed that the data were within accuracy requirements and that the QC procedures on the number of segments to sample could be reduced. VDOT administered a well-defined quality review process. Highway sections were selected at random and verified by onsite visual checks. Quality issues were discovered in the data collection process, operation of the software, and the data loading process. All issues were resolved and documented to VDOT’s satisfaction. This review provided the basis for acceptance of the data and determined eligibility for payments to the contractor. In summary, data quality issues were not a major problem in this project. ICAS Current Status and Future Plans The ICAS pilot was completed in November 2002. The three-county data collection activities are complete, but VDOT has decided not to expand ICAS statewide (it did use the concepts and knowledge learned to develop the Random Condition Assessment). Video-logged images are available on the VDOT intranet, and VDOT personnel have the capability to access data, update and add assets, and obtain reports and information from the system. The three county jurisdictions are keeping the ICAS data current. The ICAS fixed-price costs were itemized as follows: Pavement data, $3.8 million; Phase I, $7.9 million; and Phase 2, $25 million. The actual costs of work performed, which included the accelerated Phase II centerline delivery, totaled $18 million. Statewide centerline delivery cost was $7.7 million and asset data collection cost was $4.6 million. The largest contract modifications, not counting the centerlines, were for collecting additional mileage in the pilot counties (beyond the official VDOT record), changes to the data dictionary during data collection, and delays imposed by VDOT during data collection. The ICAS project came to administrative closure in November 2002. Having finished a review of the pilot project, VDOT executive management decided that, because of fiscal constraints, continued data collection for asset management would be addressed with in-house staff and resources. VDOT will continue to use the ICAS system and procedures adopted during the pilot to populate the required data. Project deliverables were finalized and the contract closed out. ICAS Useful Conclusions and Lessons Learned One of the greatest achievements of this project was the delivery of complete statewide centerlines for all VDOT roads and highways in the Commonwealth of Virginia-more than 111,044.74 km (69,000 centerline mi). Under ICAS, the State collected information on asset inventory and inventory condition and evaluated the technology. In most cases, the tools and technologies in this project delivered good functionality and demonstrated capabilities to provide asset inventory and condition data for asset management. The ICAS project provided VDOT with extensive information, knowledge, and documented processes. The following list summarizes a sample of the gain for VDOT:
An essential lesson learned was that the system used in the data collection’backpack units with voice recognition software technology’worked extremely well and enhanced safety by providing appraisers with a heads-up and hands-free capability. In addition, the inspectors were able to collect both aboveground and belowground assets and attributes and effectively assess conditions. This approach allowed an accurate and complete asset inventory and a full condition assessment. The GPS location referencing equipment and software also were effective and enabled precise location of all assets. The system worked equally well with the field inspectors and van-based image collection technology. Having the data collected with spatial coordinates using GPS was fundamental to obtaining repeatable, verifiable, and accurate locations of assets. Raters were not required to know specifics such as official route number, milepost, or intersection and offset to locate their position. Having the assets tagged with spatial information also allowed linear referencing technologies to be used easily to integrate data from different sources in the relational database. Despite the success of the pilot and advantages to the system, there were several reasons that VDOT opted not to proceed to the next phase and take ICAS statewide:
Asset Management System VDOT did not select COTS software in developing its AMS because it determined that COTS software would not be cost efficient unless its specifications were close to current VDOT practices and customs. With ongoing budget constraints and the lessons learned from the ICAS experience, cost-efficiency concerns had been brought into sharp focus and played a key role in this decision. As a result, VDOT chose to develop an AMS by revisiting the original requirements of the BPR effort. In contrast to the single COTS system envisioned in early efforts, VDOT staff divided the BPR requirements into a series of components that could be developed individually and integrated incrementally. The new AMS has six key components:
Through the BPR, VDOT envisioned the management of assets through their entire life cycle: condition assessment, planning, alternatives evaluation, project development, and implementation. Decision-support tools would provide resource management capabilities such as attributing financial, equipment, and human resource investments to specific groups of assets. These systems would also enable VDOT to manage the use of its assets and provide an integrated approach for managing information such as land use permits; hauling permits; routing traffic flow; and capacity, impact, trip, and travel analyses. Of the six planned modules, the first two are completed and the others are in different stages of development. Work on the first two components of the AMS-the Random Condition Assessment Module and the Needs-Based Budget Request Module-began in 2003. In developing these modules, VDOT followed a formal systems development process designed to provide consistency between the individual development efforts and verify that data required for the AMS are fully integrated. The AMS, which is entirely Web-based and requires only a standard Web browser, will, according to its documentation, “enable VDOT to more efficiently and effectively manage roadway assets.” Based on the results of a cost-benefit analysis of the AMS, VDOT expects a 15 percent return on investment by 2006. This rate of return is possible because the system will enable VDOT to implement its management strategies, which includes the following objectives:
In addition, implementing the AMS will help bring VDOT into compliance with recommendations developed through an audit performed by the Virginia Joint Legislative Audit and Review Commission and a study conducted by the Virginia Auditor of Public Accounts. A description of the first AMS module, the Random Condition Assessment, follows. Random Condition Assessment System Description Development work on the RCA, the first module of the current VDOT asset management system, began in January 2003. The RCA is an inventory system with a statistically based random sampling approach for manual data collection. The RCA data are used to compute an unconstrained, needs-based budget to maintain infrastructure and VDOT assets. It includes the condition of the highway system based on extrapolating conditions of the random sample of the roadways. VDOT has the capability to extract cost information from its financial management system to support the needs-based budget analysis. The RCA contains nonpavement and nonbridge assets and focuses on pipes and drainage, roadside, and traffic features. The protocol for districts is to collect inventory and condition data in preselected 0.161 km (0.10 mi) sections of the roadways. VDOT rates all assets within the 0.161 km (0.10 mi). The RCA system includes a built-in help menu with definition of asset types and helpful asset pictures such as cantilever and regulatory sign types in the help menu. The menu items for signs include sign type, age, and number of panels. For each data entry, there is a comment field for the appraiser. RCA provides a drop-down menu of choices from which the appraiser selects. For example, under signs, “post damage” and “panels missing” are among the options. Appraisers are equipped with a computerized system, either a laptop or hand-held devices, and download information daily when they return to their offices. Appraisers use standard forms, and data entry is done using a touch screen application on a PC. Appraisers are field people who, on average, hold a 2-year college degree. On the interstate system, VDOT captured approximately 1,800 0.161-km (0.10-mi) sections out of 2,200 directional miles of Interstate roads. On primary and secondary roads, VDOT has captured 3,690 0.161 km (0.10 mi) sections. The approximate sampling rate in the RCI includes:
Using the RCA system, data for 9,000 statewide sites were collected by June 2003. The process was repeated in spring 2004. All RCA concepts are developed on an incremental basis in-house by the VDOT Asset Management Division, which is working closely with the IT department in developing RCA. The Asset Management Division has defined the system business application and needs, and the IT department performs system development. The IT department supports the Asset Management Division, and they are well coordinated and integrated. All work is performed in-house. RCA is an Oracle-based database system on a PC platform. The graphic user interface is built with a drop-down, menu-based system. The primary users of the RCA data are the district maintenance staff. Other users include State and district budget managers. To train these users, VDOT formed focus groups for each district and trained the focus groups at a central location. Random Condition Assessment System Data Collection Efforts Table 6 lists the categories of VDOT RCA data collected Table 6. Virginia RCA data collected.
Relevant data from various systems are being processed and imported into a data repository. VDOT is proceeding with this work without fully understanding the details of what the target asset management system will look like. For example, the final AMS may consist of a series of individual tools, or it may resemble a comprehensive enterprise resource planning system that was once proposed. It is anticipated that if all relevant data are cleansed, normalized, and stored in a single data repository, VDOT can export data to any future system. This strategy provides VDOT with great flexibility in designing the final AMS. The design will continue to evolve based on organizational requirements, funding availability, and emerging technologies. In the meantime, this approach has enabled VDOT to make significant progress both in developing individual maintenance decision-support tools and integrating maintenance data without waiting for the final details of the comprehensive AMS to be developed. The RCA will be fully integrated to the other modules of the VDOT asset management system, including ICAS and two other systems:
The RCA general confidence level statewide stands at 95 percent. This level varies by 5 percent to more than 10 percent for various locations and asset types. Random Condition Assessment System Current System Status and Future Plans VDOT has entered approximately 20 to 25 of the 42 assets per selected 0.161-km (0.10-mi) section into the database. In 2003, VDOT completed the first two components of the AMS: the Random Condition Assessment Module and the Needs-Based Budget Request Module. Based on the success of this initial effort, the agency proceeded to develop the Planning Module and a New Work Order and Accomplishment module. Four of its six modules have been developed at this time and are in various production and implementation stages. It is expected that the remaining modules are to be developed before the end of 2005. Looking beyond this next milestone, VDOT will work to integrate the AMS with the Commonwealth’s statewide GIS. Also, to date the scope of the VDOT AMS has been focused on maintenance and operations. It is anticipated that, when work is completed in these areas, the system may be further enhanced to provide additional decision support for the VDOT equipment program. VDOT has learned not to rely on a single-vendor solution, but instead to pursue open standards as much as possible. The agency is interested in implementing standards that may emerge from the National Spatial Data Infrastructure Framework Project in the transportation data layer. VDOT is also coordinating with the I-95 Corridor Coalition on a regional multistate transportation network for the interstate and State routes. The department is also embracing Web-based services and views Internet map servers as an integral part of its enterprise architecture. VDOT anticipates that in the future more services will be accessed remotely through the Internet including data uploads from local handheld computers, and provide the ability to query data and applications in the field, perhaps using wireless communications. The rapid changes in technology require a flexible, open-systems approach. VDOT is conscious of the need to take small steps to take advantage of these improvements in the context of an enterprise data architecture. VDOT has already used results from the Needs-Based Budget Request Module of its infrastructure AMS in presentations to its executive board and members of the General Assembly. Although there is much work to be done, VDOT’s ability to get meaningful information into the hands of decisionmakers has solidified support for further enhancements and provided a glimpse of the power of a fully developed AMS. The initial RCA cost for the first 3 months was approximately $300,000. The 2.5-year total RCA cost is expected to be in the low million-dollar range. OTHER DOT CASE STUDIESA number of State DOTs have implemented asset management systems with various levels of integration. A selected number of these States are featured in the following paragraphs, in alphabetical order. California Department of Transportation Inventory Maintenance Management System Description In 1990, following an independent review of business processes in the Maintenance Division of the California Department of Transportation (Caltrans), it was determined that the systems were not adequate for the increasingly complex needs of the division. For example, field crews were required to enter extensive time, material, and equipment reporting data (FA83 and HM85) manually on duplicate screens. In addition, short- and long-term management information was not readily available and was often not timely or reliable. The Caltrans Division of Maintenance planned the Inventory Maintenance Management System (IMMS) to improve internal operations. The initial phase of the IMMS project was to replace the Caltrans Maintenance Management System (MMS), a time reporting system where sign and lighting information was maintained, and its follow-on Maintenance Management System Improved (MMSI) with asset management software. The Caltrans Division of Maintenance provided expertise and input to modify the software product to suit the needs of its users. IMMS was tailored to meet the specific needs of the division. Following is a list of tasks the IMMS team accomplished:
IMMS is a COTS software developed by a California company. After a competitive bidding process, the State awarded the development of IMMS in 1996. The general specifications of IMMS were set by the Department of Information Technology, and a computer application was selected as the core of IMMS. The IMMS system is mostly based on reports on time tracking and individual assets, and it has limited built-in reporting. IMMS contains some cost data but comprises mostly individual data elements. The key function of the Caltrans Maintenance Division is to perform work activities on Caltrans-maintained assets such as lights, signals, bridges, landscape areas, and the roadway. The Caltrans IMMS is designed to track time, material, and equipment. One feature of the system captures how much time the crew worked on each job. Work performance items listed in IMMS include day labor work order, input/output, and inventory order. IMMS is designed to give supervisors access to detailed information about each asset, where it is located on the roadway, and work being performed on the asset. Following is a list of the planned benefits of IMMS:
IMMS comprises three primary elements. The first element is the computer program at the core of IMMS. All users access this program to create work orders, enter time and work information, adjust working stock, and view information about IMMS assets. The second element is the IMMS database. When a user views information or enters data into IMMS, the data are accessed directly at the IMMS database located at headquarters in Sacramento. All information entered is stored in this database. Users throughout the State can input information directly into the IMMS database through one of 11 servers. These 11 servers and a Citrix® access program work together to form the third element of IMMS. Citrix directs all information moving to and from the database to one of the servers. IMMS uses multiple servers to handle high volume periods, when supervisors throughout the State may be accessing IMMS at the same time. This helps in entering all information updates quickly and providing easy access to the information. A key feature of the IMMS is the Roadway Feature Viewer. The IMMS Roadway Feature Viewer (Viewer) provides a convenient way for supervisors to scrutinize information about a roadway; for example, supervisors can easily see the locations of assets along the roadway and either view information about work being performed on an asset or create a work order for the asset. In addition, they can view the location of work being performed on a portion of the roadway and have access to information about the roadway itself, such as the number of lanes or speed limit. A supervisor who is planning work for a specific section of roadway can check the Viewer to see if other work is being performed at or near the location. This alerts the supervisor to conflicts or help to coordinate the sharing of resources more easily. The IMMS implementation was planned for three phases:
Inventory Maintenance Management System Data Collection IMMS is an Oracle-based system. The software selection was based on department policy to use Oracle and Oracle-compatible software so that different systems can interchange data. All electric power systems are in IMMS, including luminaries, signals, ramp meters, flashers, cameras, message signs, all lighting, tunnel lighting, and loop detectors. Table 7 lists the categories of California IMMS data collected. Table 7. California IMMS data collected.
Although data entry is planned, Caltrans has not completed it because of the State’s current budget constraints. Caltrans recognizes the need for coordination between IMMS and other systems such as the Pavement Management System and Bridge Management System, but is not budgeted for activities soon. The department is maintaining the previous generation of its asset management system (MMS) until IMMS is fully populated. During the transition, the State will maintain two parallel systems, which are anticipated to be in existence for many years. Inventory Maintenance Management System Quality Assurance The IMMS team tested the application software and IMMS data to verify that IMMS meets the needs of all users. Following are descriptions of the types of testing performed:
Inventory Maintenance Management System Current Status and Future Plans The final phase of IMMS implementation concluded in June 2003. All the districts are now using the software. There is no allocated budget for IMMS future development, although one of the future development plans for IMMS includes wireless data entry for inventory. Following is a list of some of the needed IMMS improvements identified by the Caltrans Maintenance Division:
Florida Department of Transportation The tremendous volumes of data that the Florida Department of Transportation (FDOT) is responsible for keeping track of and regularly updating led to the development of a tool to more easily manage the department’s asset information. The Roadway Characteristics Inventory (RCI) System was created in response to this data management need. The district and central offices within the FDOT maintain the RCI, which is the largest department database with more than 1 million records. The database is updated daily to reflect the most current information available. Roadway Characteristics Inventory System Description The Roadway Characteristics Inventory (RCI) system is a computerized database of physical and administrative data related to the roadway networks that are either maintained by or are of special interest to the FDOT. The RCI also contains other data as required for special Federal and State reporting obligations. Some of the specific items that the RCI database includes are roadway signs, traffic signals, pavement markings and treatments, guardrails, and barriers. The system currently tracks assets in the Department of Maintenance and Traffic Operations Control, including roadway lighting, structural supports, and detectors. RCI uses the following data categories:
The primary users of the RCI include the FDOT Traffic Operations, Pavement Management, Maintenance, Work Program, Safety, and Statistics Departments. Limited access is also given to department consultants. Access for consultants to the RCI database requires authorization from the various division managers in FDOT. FDOT offers training classes for internal use of the RCI database every several months when a number of new employees are qualified for the training and express an interest in taking it. Roadway Characteristics Inventory System Data Collection Table 8 lists major asset data categories collected for the RCI database. Table 8. Florida RCI data collected.
Each feature listed above has multiple characteristics such as pavement index, condition, and roughness. The database population depends on the availability of information from the field, not RCI system limitations. FDOT has entered all available data for the RCI system in the three data categories-identification, features, and characteristics. At the time of this writing, FDOT was in the process of implementing a Web-based system for accessing the RCI database. Access is limited to mainframe use onsite at FDOT offices statewide and, although the data will continue to reside on these mainframe computers, remote access over the Internet will be available for authorized individuals. The database is maintained by department computer personnel, with access by specified personnel from the district and central offices. At this writing, PCs are used as terminal emulators, but following the anticipated launch of the Web-based access system, laptops will be used for Web access. The system will be capable of allowing users to view data directly or download to various spreadsheets or database software. Roadway Characteristics Inventory System Quality Assurance A quality control plan for the RCI data is administered by the district office and reviewed by the central office. Quality assurance reviews (QARs) are conducted by the Transportation Statistics Office (TranStat) staff working with the district office. QARs are intended to monitor activities and demonstrate compliance with approved department policies, procedures, rules, guidelines, and standards. TranStat conducts QARs in each district at least biennially to determine compliance with the critical requirements identified in the General Interest Roadway Data Quality Assurance Monitoring Plan defined in the District QC Plan for Highway Data Reporting. The district assists TranStat personnel in conducting QARs by providing the following resources:
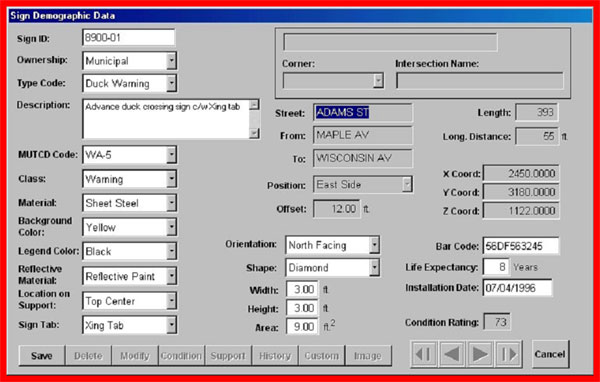
After the field review is completed, TranStat staff conducts an exit interview with the district secretary or designee and other personnel. TranStat uses district feedback and review team observations and findings to determine the effectiveness of data collection processes to make recommendations to improve district or TranStat processes, or both. When requested, and with district input and support, the TranStat staff develop recommendations for appropriate process-oriented remedial actions in areas of noncompliance. TranStat tracks the district’s Action Plan and conducts follow up field and office reviews on areas of noncompliance. In addition, TranStat provides details of discrepancies found during the QAR within 30 calendar days of the exit interview. The details of the discrepancies include documentation of the deficiencies by roadway identification and a milepost range. Roadway Characteristics Inventory System Current Status and Future Plans FDOT has populated the database with all available data for the RCI system. The database is updated daily when the department obtains new or modified information. The RCI database resides on the department mainframe computer system, and it is maintained by department computer personnel from the district and central offices. The FDOT Office of Information Systems (OIS) is in charge of operating and maintaining the database with assistance of contractors directed by OIS staff. The cost of operating and maintaining the RCI database is difficult to estimate because it has been ongoing for several years and continues with frequent updates. Georgia Department of Transportation The Georgia Department of Transportation (GDOT) has several asset management systems in place including the Traffic Signal Inventory Program, Highway Sign Management System (HSMS), and the Highway Maintenance Management System (HMMS), which is similar to the MMS being developed by the Tennessee DOT discussed later in this chapter. The GDOT systems are not integrated. As in many States, fiscal constraints play a significant role in the ability of GDOT to complete its asset management systems using integrated databases or technologically current data collection methods. As a result, GDOT must move incrementally toward the initial effort to populate its databases with current asset information, let alone proceed with systems integration. Highway Sign Management System Description GDOT HSMS is a comprehensive database capable of storing detailed information about State DOT signs. The system, built by a contractor, is fully developed but not populated with data. The system features include barcoding, stock inventory, and roadside inventory options. A user-friendly menu bar is designed to access the modules. The File, Reports, and System Administration options on the menu bar include drop-down menus of more options. When a new sign is manufactured, a barcode label containing all the information describing the sign is printed and affixed to it. For old signs, a generic barcode label can be printed that only contains a unique barcode key. The information about the old sign is requested when the sign is scanned into inventory. Following is a list of designated fields in the HSMS:
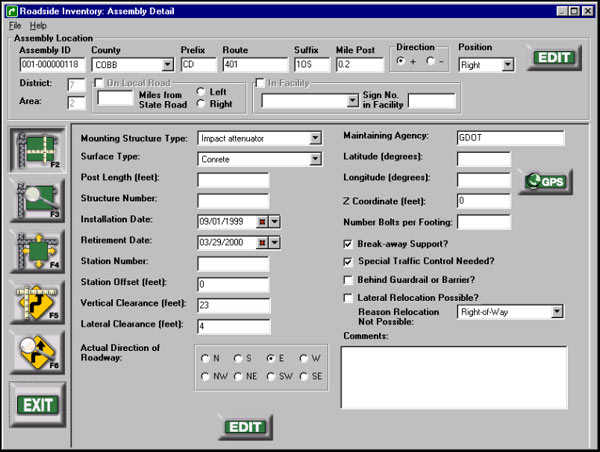
In the case of special signs, the following data are collected for each line of text on the sign: line, text, font series, font size, size in inches, legend colors, background colors, and application method. Data screens on the roadside inventory all share certain features, including the top portion of the screen, which displays the assembly information, and the buttons on the left side of the screen, which allow the user to navigate to and from five data screens-assembly location detail, assembly inspection, sign position, sign detail, and sign inspection. Figure 9 is a screen capture of a sample assembly detail screen. This is the introductory screen used for the roadside inventory data screens because it is the first screen a user sees when selecting an assembly.
Figure 9. Screen capture. Georgia DOT HSMS sample data screen. Highway Sign Management System Data Collection Table 9 lists the categories of Georgia HSMS data collected. The database includes location of sign, GPS, milepost, location on left or right side of the road, type of sign, height, lateral offset to the bottom, fabrication, and installation date. Table 9. Georgia HSMS data collected.
The HSMS is completely in place, but is not populated with data, nor is it correlated to HMMS. Highway Sign Management System Current Status and Future Plans The HSMS is fully developed. GDOT intends to develop a plan to populate the database, but the process will be incremental. Fiscal constraint is the primary reason the sign data have not been entered in this completed system. Because the State is moving to a digital photo log system, the HSMS could be tied to a GIS if funding permits. Maryland State Highway Administration The Maryland State Highway Administration (MDSHA) does not use a single, integrated, computerized database for all roadway characteristics. There are a number of databases kept by various operating divisions to inventory and report on the assets under their responsibility. These databases are integrated as necessary through a shared route system based on the roadway inventory used for internal and Federal reporting requirements. The route system uses a standard key and mile points relating each of the ancillary systems to it and to one another. Highway Management Information System and Roadway Route System Description The data source for roadway information is the Highway Management Information System (HMIS) maintained by the database management section of the Highway Information Services Division. Roadway data are collected by inventory crews and integrated with data supplied by local county governments. The information gathered and maintained by the system is used for reporting and mapping support within and outside MDSHA. It is also the information base from which the intelligent GIS roadway route system was developed and is maintained. The HMIS also supports reporting for the Highway Performance Monitoring System (HPMS). By facilitating the reporting and map display of their data on a graphical roadway map, the GIS Roadway Route System serves as an integrating function for databases maintained by Bridge, Pavement, Signal Operations, Accident Reporting, and Project Planning divisions. The HMIS is updated as requested data are received from county governments and verified as part of the inventory process. The system resides on a Windows 2000 server running an Oracle database, as are the large databases maintained by other divisions. Smaller databases are maintained on Windows 2000 workstations running Microsoft® Access. The GIS Roadway Route System is also maintained on a Windows 2000 server running Oracle. The GIS Roadway Route System is designed to provide linear referencing capability using single line work for all Interstate, U.S., Maryland, and major county routes based on the FHWA functional classification; that is, all roads are referenced except for urban and rural local roads.(4) The State is responsible for the maintenance of the core systems that support and integrate the data for the operating division; that is, the HMIS and the GIS Roadway Route System. Contractors are used to aid the development of new applications and also perform some continuing daily functions such as roadway inventory and cartography. Users of the various systems integrated by the GIS Roadway Route System are the direct users, who update and maintain the system application databases, and the indirect users, or customers, who use the data from these databases in conducting MDSHA business. The Roadway Inventory (HMIS) supports the GIS Roadway Route System and integrates data from the other systems. The GIS Roadway Route System, in turn, supports a GIS Data Viewer application that facilitates map display, printing, and reporting of HPMS. Additional elements supported include pavement, bridge, accident, signals, and highway needs inventory data on more than 450 desktops across the State. The GIS staff continually seeks opportunities to facilitate the use of the GIS Roadway Route System as an integrating tool, and staff members serve as internal consultants to any department or individual with a need to display or report on data that can be spatially enabled. They also provide as-needed training for the GIS Data Viewer. Highway Management Information System Data Collection The HMIS master file contains records to store each intersecting feature by route number and mile point. Features include, but are not limited to, intersecting routes, municipal and county boundaries, bridges, cultural features, some private roads, and road ends and cul-de-sacs. The Universe file contains roadway section data designated by route number, beginning mile point, and section length to support internal reporting and HPMS requirements. Data such as median width and type, number of lanes, shoulder type and width, pavement type, average annual daily traffic (AADT) and other characteristics are maintained. GIS Roadway Route System Data Collection This system contains graphical line work and attribution to support the use of linear referencing of other data sets to the roadway base. The system line work is based on intersection-to-intersection, and it is calibrated using intersecting roadway feature mile point measures, as determined by roadway inventory data from the HMIS. Databases relate to the GIS Roadway Route System using a standard key:
Table 10 lists the asset categories of data collected in the Maryland GIS Roadway Route System. Table 10. Maryland GIS Roadway Route System data collected.
All of the databases mentioned are mature and have been in use for a number of years. The HMIS in particular has evolved from a paper system through several generations of computer system technology. Most of the other systems have evolved in a similar way. The HMIS recently completed a reengineering process that has introduced improved technology to provide better data and more efficient operation. Many of the changes were in direct response to the needs of the GIS Roadway Route system to support the increasing needs of its users and the other divisions who maintain data sets for their own information requirements. The GIS section has a Web-based application to supply roadway video-log images using a map-based interface. The application is being enhanced to provide aerial photography or roadway video for a specific set of project limits through an enhanced map and textual interface. All of these database applications reside on Windows 2000 servers or workstations and Oracle 9i or Microsoft Access 2002, depending on hardware platform. The applications are accessed using client-server technology; however, several Web-based applications are in development, and others are in the planning stage. Highway Management Information System and Roadway Route System Quality Assurance As new roads are added to the public highway system, roadway inventory information is supplied by local governments. State highway personnel then field-verify the information, collecting various attribute information and GPS data. After this field data are returned to headquarters, aerial imagery is used to QA the GPS data. QA is also performed by offices that maintain other data sets such as bridges, pavement, traffic devices, and accidents. Highway Management Information System and Roadway Route System Current Status and Future Plans A project has been undertaken to enhance the GIS Roadway Route System to include all roads in the State, including all local roads, ramps, collector-distributors, auxiliary lanes, and both sides of divided highways. This project required lengthening the standard identification key field from 13 to 36 characters to accommodate the required additional coding. The GIS Roadway Route System enhancement, including divided highways, collectordistributors, and all locally maintained routes, is proceeding with the cooperation and help of many county governments. This effort will produce a route system that provides location services based on linear referencing and address geocoding to all State departments and county governments as well. The various systems have been in place for many years and have undergone much change. Cost data for ongoing maintenance and periodic enhancement are unavailable. Traffic Structure Inventory Inspection and Maintenance System DescriptionAfter reviewing asset management systems in use at VDOT and the Delaware Department of Transportation, the MDSHA Office of Bridges determined those systems could not meet its needs without reworking. MDSHA contracted with consultants to provide an automated structure inventory system that could also track maintenance and inspection activities. This automated system is the Traffic Structure Inventory Inspection and Maintenance (TSIIM) system. The data fields and structure components captured by the TSIIM system were determined after numerous meetings and reviews of the MDSHA DOS-based database, its paper inventories, and inspection forms previously filed. TSIIM comprises three components: TSIIM Inspector, TSIIM Manager, and TSIIM Online. TSIIM Inspector is written on a desktop database platform (Microsoft Access with a Visual Basic front-end) for portability. The TSIIM Inspector consists of modules for Sign Structures and High Mast Light Poles with development of modules for Bridge-Mounted Signs and Signals planned. TSIIM Manager will be developed later on an Oracle platform, and it will have the ability to check-in and check-out structures for inspection and compare history. TSIIM Online will be developed to allow those interested in traffic structure inventory or its inspection data to search, review, and print a limited set of information about the structures on the MDSHA intranet. The TSIIM is run on Intel® processor-based PCs using a Microsoft Windows NT/2000/XP platform with a Crystal Reports® Runtime engine and Visual Basic Runtime libraries. The primary users of TSIIM are in the Structures Team of the Traffic Engineering Design Division. A training session was arranged to train teams who are inspecting structures and populating the database. Traffic Structure Inventory Inspection and Maintenance System Data CollectionTable 11 lists the categories of Maryland TSIIM data collected. Table 11. Maryland TSIIM data collected.
Data for nearly 250 of the 2,500 traffic sign structures (cantilever and overhead) have been entered in the system. All of the data will be populated by 2008. At present, inspectors input their own data sets into the system. The data reviewer at MDSHA calls up those data sets by double-clicking on them. The Structures Team reviews the TSIIM data before a data set is populated. Traffic Structure Inventory Inspection and Maintenance System Current Status and Future PlansThe system is being used by several consultants under a 5-year system inspection contract. The consultants’ efforts will be assisted by the use of data collected by the State field inspection staff. Integration between data sets and historical data support is planned for when the TSIIM Manager is developed. Other plans are to integrate with the GIS base maps maintained by the MDSHA Highway Information Systems Division and to integrate with the MDSHA intranet, allowing limited data query and printing capabilities. Future development includes upgrade to an extensible generic asset inventory, inspection, and maintenance data management program. The development will integrate data from all inspection teams. Further enhancement will allow for the check-in and check-out of this data for repeat inspections and provide historical data review and optimal fund allocation analyses. For TSIIM Online, an intranet interface to the inventory and inspection data for general use within SHA will be further developed. These components will also interface with GIS. Minnesota Department of TransportationAutomated Facilities Management System DescriptionThe Minnesota Department of Transportation (Mn/DOT) Automated Facilities Management System (AFMS) is used to track the Electrical Services Section maintenance activities. AFMS also coordinates requests for materials and work produced by the Mn/DOT Metro Division and the eight district traffic offices overseen by Mn/DOT. The AFMS is limited to traffic signals and other electric/electronic facilities that Mn/DOT owns, operates, or maintains. The AFMS is used by the districts to order equipment, maintain the history of maintenance calls, summarize work orders, and keep track of the maintenance activities at each intersection. AFMS is also used as the system of record for State One Call (Miss Utility) verifications. The software enables the districts to enter a work request that includes a summary of the work order, work order requirements, assigned employees, vehicle use, components, fiber test, and loop test. The AFMS was developed by Mn/DOT more than 10 years ago with the goal of cost effectively and efficiently managing the asset classes covered by the system. The original software was an MS DOS-based system, which has since been converted to MS Windows. AFMS project challenges have included the implementation and user friendliness of the software. The primary users of the AFMS are the districts. User training for the rollout of AFMS V2.0 was conducted during October 2002 at the Mn/DOT Central Shop in Fort Snelling, MN. Mn/DOT completed a pilot study of a video-based system in 1999. The Sign Inventory System captured signs and guardrail data in the Rochester District, one of the eight districts under Mn/DOT responsibility. The video scanning was performed using proprietary software. Mn/DOT decided not to pursue the project or expand it statewide because of concerns over the cost of development and maintenance for the software. The pilot study cost for partial data collection was approximately $167,000. In addition, the software, developed in 1999 was not Y2K compliant. Automated Facilities Management System Data CollectionTable 12 lists the data categories that are collected by AFMS. Table 12. Minnesota AFMS data collected.
All signals and lighting systems on State highways are in the database, but, the AFMS is not integrated with the other Mn/DOT asset management systems. A contractor was retained to develop the customized AFMS V2.0 software. AFMS is an Oracle client-server database application that is run on MS Windows-based software. The system was originally an MS DOS-based system designed as a two-tier client-server application to operate on Mn/DOT in-house local and wide area networks. The IT department has managed the conversion to MS Windows. The hardware is based on a database server with Oracle Forms running on an existing runtime environment on client machines. The client operating system is NT/2000/XP, and the server is non-OS specific. Automated Facilities Management System Quality AssuranceA QA plan was filed as part of the standard project deliverables for AFMS V2.0. This document, available on request, describes the participants and procedures. Automated Facilities Management System Current Status and Future PlansThe AFMS is fully populated, and new data entry is performed manually. No major enhancements are planned. The estimated cost of the current production system is $191,800 for AFMS V2.0. Tennessee Department of TransportationTennessee Department of Transportation (TDOT) conducted a survey in February 2000 to research the available asset management systems in other DOTs. The results of the survey were used in developing the plans for the State’s next generation asset management system. A summary of the State survey results can be downloaded from the TDOT Web site at http://www.tdot.state.tn.us/Chief_Engineer/assistant_engineer_operations/maintenance/MMS.htm TDOT has two asset management systems in place:
Data reside on TRIMS as the first level of the asset management system. The MMS is the next level of the asset management system, which is under development. Tennessee Road Information Management System DescriptionTRIMS is an enterprise transportation database owned and maintained by the TDOT, and it was developed to improve cost effective and efficient asset management. The TRIMS Oracle database contains information on each public road in Tennessee, totaling more than 136,794 km (85,000 mi) of roadway. The PowerBuilder® interface allows users to query inventory data, digital photographs, road mileage, documents, digital plans, and scanned documents. TRIMS also has a graphic interface, which offers map-based queries and displays information on maps, providing a more effective tool for planners and engineers. TRIMS functionality supports the following Federal and State mandates for TDOT:
TRIMS was developed by a transportation asset management and visualization products company in Huntsville, AL. The TRIMS system in TDOT headquarters runs from an application server configuration. In the regions and districts, TRIMS runs from a client-server configuration. The software is Oracle-based software running on Windows NT and Windows 2000 Professional. The TRIMS project experienced excellent coordination and support with the IT department. TDOT has assessed the common tools for design, development, and project tracking as being very useful. The system is in use by field staff to plan and execute work and by office staff to manage needed maintenance and develop analyses in support of budget requests. TDOT has developed an internal guide to the TRIMS system to familiarize users with the TRIMS hardware, network, operating system, database, and intranet/Internet connections.(5) Tennessee Road Information Management System Data CollectionTable 13 lists the categories of TDOT TRIMS data collected. Table 13. TDOT TRIMS data collected.
TRIMS features the following information:
The State plans to integrate TRIMS into the MMS. TRIMS is compatible with the Bridge Overhead Structure Database, but it is not integrated with other State systems such as the Construction Management System (CMS) and the TDOT financial accounting system. Tennessee Road Information Management System Current Status and Future PlansTRIMS is a fully functional database. In the future, TDOT wants additional support functions to improve access to TRIMS through the Web. TDOT requires the regions to be able to contact TRIMS through the intranet concerning upgrades on route openings, route realignments, and data issues. Maintenance Management System DescriptionThe objective of the MMS is to provide TDOT with a sound, cost effective, solution that can integrate upward to manage maintenance expenditures, labor, equipment, and materials. The intent is for MMS to provide efficient use of funds and budget planning. It is anticipated that MMS can be developed and implemented by using existing applications and customizing the integration of these products with each other as well as with existing and proposed IT infrastructure. The MMS has three primary goals:
In May 2002, TDOT selected a contractor to develop and implement the MMS for Tennessee. TDOT procured the MMS to provide a single-source data entry point, primarily used by middle managers, to automatically transfer information to and from other internal databases such as the Tennessee financial system and TRIMS. The following goals and objectives were identified for the maintenance management process:
Maintenance management systems have been used by highway departments since the early 1970s to assist in the planning, scheduling, and tracking of maintenance work. Formerly, these systems were mainframe applications; however, over the past several years, many advances have been made in this field. These systems are now being converted to client-server applications that are integrated with many other systems to form a network capable of transferring information instantly and in many cases, eliminating the duplication of work. The TDOT approach to analysis of the Functional Requirements Document (FRD) was accomplished in several phases:
This approach was developed to optimize TDOT’s ability to collect and document its MMS requirements. Maintenance Management System Data CollectionTable 14 lists the categories of TDOT MMS data collected. Table 14. TDOT MMS data collected.
The MMS is in the development, and it is not populated. The MMS was initially designed to interface with the following existing and proposed systems:
Different levels of integration are being built into the system. Maintenance Management System Current Status and Future PlansThe MMS project began in 2002 and is scheduled for completion in 2005. A Synopsis of Other State PracticesThe following information summarizes some of the other State DOT asset management systems. These States have stand-alone databases in one or more of the asset categories of this study. North Carolina Department of TransportationMaintenance Management System DescriptionThe North Carolina Department of Transportation (NCDOT) maintenance management system was developed with the following goals and capabilities in mind:
Initially the maintenance management system was released as a pilot program in two divisions for 6 weeks. Field personnel were involved in the initial development of the North Carolina system providing comment and suggestions. Maintenance Management System Data CollectionVisual Maintenance Management System software was acquired from a contractor. The system is a PC-based, three-tiered system with workstation access, an application server, and a mainframe Oracle server. Plans exist to integrate; pilot programs are being deployed in selected divisions. A visual inspection is used to determine the condition of assets on the sample sections of roadways. All assets in the section, including signs, lighting, supports and structures for signs, guardrails, markings, and detectors receive pass or fail ratings, and the extent of failure is measured. A condition assessment is performed randomly every 2 years on sample sections of North Carolina highways and freeways. An asset inventory on 126,012 km (78,300 mi) of NCDOT highways has not started. Maintenance Management System Current Status and Future PlansThe vision is to tie together the pavement maintenance, bridge management, and maintenance management systems and eventually add traffic signal management to allow a comprehensive assessment of needs down to the project level. Training is being offered for a pilot implementation in 2 of 14 divisions. The GIS is nearing the final stages of development. GIS data will be used to develop a graphical representation of the road network using ArcView® to display maintenance history. Information on each sample section of roadway is included so that engineers can call up sections of roadway and view condition ratings and maintenance needs. No asset inventory has been initiated, caused in part by budget limitations and competing priorities. The software has the capability for an asset inventory, and it is intended to be used for such in the future. Oregon Department of TransportationTraffic Signal Information System DescriptionThe goal of the Oregon Department of Transportation (ODOT) in developing the Traffic Signal Information System (TSIS) was primarily for improved maintenance and inventory tracking. One of the stated uses of the tracking capability is to provide support for defense of liability actions brought against the State, potentially producing large savings in legal fees. ODOT anticipates additional benefits to include more effective planning, scheduling, executing, and managing individual maintenance programs. Other cost saving and efficiency producing rationales for developing the TSIS are to allow the State to create an inventory of assets, determine maintenance budgets, facilitate accounting processes, and enhance the expected service life of the asset categories included. Traffic Signal Information System Data CollectionTSIA is a PC-based system running on an SQL database built with Visual Basic and Crystal Reports. The following data will be included in the database:
TSIS is 65 percent to 75 percent populated with accurate data. Data for TSIS are collected and available for reference statewide to ODOT personnel who request access. Traffic Signal Information System Current Status and Future PlansTSIS is fully integrated throughout the ODOT intranet. The current version of TSIS was put into service the first quarter of 2002, but earlier versions of TSIS have been in use since 1990. ODOT has fully populated the data and completed integration throughout the State. Only individuals in the traffic signal services unit can access TSIS. Sign Management System (R2Sign Database) System DescriptionIn 1994, ODOT’ Region 2 initiated a grassroots effort to develop a database to track signs in Oregon. In doing so, the region developed the Sign Management System (R2Sign), a PC-based Microsoft Access database system. The primary use of the R2Sign database is for maintenance and inventory tracking, but an additional benefit of tracking is to provide support for defense of liability actions brought against the State. Its main purposes, however, are to provide planning, scheduling, executing, and management for individual maintenance programs and its primary users are the district ODOT sign crews. The database is also used to determine maintenance budget and expected service life. R2Sign Data CollectionThe database includes the following types of information:
Data population varies within regions and districts. While some districts are using R2Sign fully, others do not use it. Currently, R2Sign is not integrated across the ODOT. This system is not on network-connected computers. R2Sign Current Status and Future PlansR2Sign is being groomed for statewide use. ODOT envisions an integrated network, where all regions are fully using this system. The ODOT technology branch also plans to combine these stand-alone systems into one statewide system. Wisconsin Department of TransportationSign Inventory Management System DescriptionThe goals of the Wisconsin Department of Transportation’s (WisDOT) Sign Inventory Management System (SIMS) included the ability to allow better planning for the replacement of signs using a system that records the life span of signs. Another goal was for SIMS to ensure that signs are neither prematurely replaced nor remain in the field in poor condition. For cost efficiency, SIMS is expected to provide a useful tool for contractor signing projects; it will permit WisDOT to provide an accurate listing of signs that need to be replaced, enabling the contractor to provide a realistic bid. The system will also facilitate the development of program funding needs annually. Primary users of SIMS are district sign shops and central office management functions. At this point, districts are required to implement the sign management system; training is provided; and user groups are held to introduce new features of the software as they are implemented. Sign Inventory Management System Data Collection
Sign Inventory Management System Current Status and Future PlansThe database is in full production; districts are inputting signs as they are installed, repaired, or replaced. The conversion to an Oracle platform will ease integration among all districts and assist in financial planning and projection of statewide 6-year sign replacement costs. Traffic Signal System Inventory System Description
TSSI is a PC-based system run on CartéGraph SIGNALviewTM software. User groups, including electrical service personnel, engineers, and senior management, are developing data fields and forms. Following development of the data model, operations managers will be presented with findings and level of effort necessary to perform data collection. Traffic Signal System Inventory System Data CollectionA list of data fields that will include a basic description of systems and collect a count of the number and types of systems present on Wisconsin roads (such as controller cabinets and detection systems) is under development. Through the CarteGraph software, a WORKdirectorTM suite will integrate the different View software products (SIGNview, SIGNALview, and MARKINGviewTM). Traffic Signal System Inventory System Current Status and Future DevelopmentThe TSSI initiative began in the spring of 2003, with user groups working to define data fields for signal inventory at that time. At the time of this writing, the data model was projected to be completely developed by the end of 2004. Pending IT issues, actual data collection and inventory are expected to take 2 years or more. The database will eventually be integrated statewide. One district has begun to gather data on markings. An existing yard inventory will be integrated with the field inventory. Marking Management System DescriptionThe Marking Management System (MMS) was designed to develop quantity needs for contract plans and facilitate annual budget estimates for users, including engineers, financial analysts, and senior management. Marking Management System Data CategoriesData parameters are being defined and probably will include color, type, product make, reflectivity, spotting distance, and roadway surface type. Marking Management System Current Status and Future PlansThe initiative started in spring 2003 and user groups are working to develop data fields and form. The data model was completed in spring 2003, when data collection began. A single pilot program has been initiated in District 6, which has begun to gather data on markings. The marking database is planned to be integrated with various existing databases such as material, pavement, and bridge. The timeframe for integration is unknown, but the completion for data population is targeted for 2005. The database will be integrated statewide. |