U.S. Department of Transportation
Federal Highway Administration
1200 New Jersey Avenue, SE
Washington, DC 20590
202-366-4000
Federal Highway Administration Research and Technology
Coordinating, Developing, and Delivering Highway Transportation Innovations
 |
| This techbrief is an archived publication and may contain dated technical, contact, and link information |
|
Publication Number: FHWA-HRT-07-033
|
|||||||||||||||||||||||||||||||||||||||||||||||||||||||||||||||||||||||||||||||||||||||||||||||||||||||||||||||||||||||||||||||||||||||||||||||||||||||||||||||||||||||||||||||||||||||||||||||||||||||||||||||||||||||||||||||||||||||||||||||||||||||||||||||||||||||||||||||||||||||||||||||||
Synthesis of the Median U-Turn Intersection TreatmentFHWA Contact: Joe Bared, HRDS-05, (202) 493-3314, or PDF Version (919 KB)
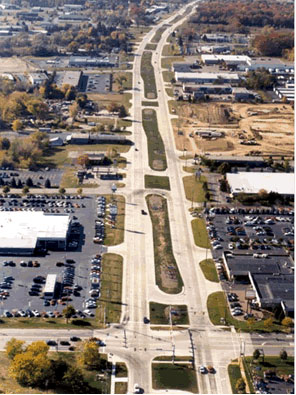
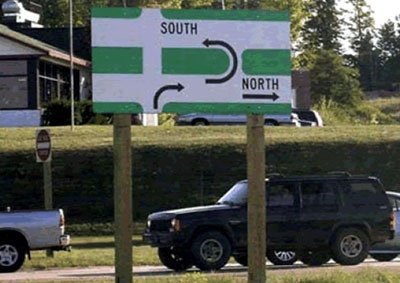
PDF files can be viewed with the Acrobat® Reader® ObjectiveIn the United States, congestion at intersections throughout urban and suburban areas continues to worsen. Crashes reported at intersections have continued to increase. One potential treatment to combat congestion and safety problems at intersections is the Median U-Turn Intersection Treatment (MUTIT), which has been used extensively in Michigan for many years and has been implemented successfully in Florida, Maryland, New Jersey, and Louisiana in recent years (Figure 1). Figure 1. Example of MUTIT on Michigan corridors (Source: AAA, Michigan).
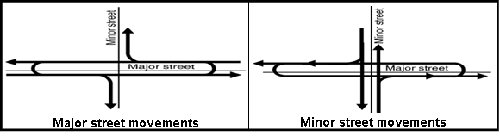
The treatment involves the elimination of direct left turns at signal-controlled intersections from major and/or minor approaches. Drivers desiring to turn left from the major road onto an intersecting cross street must first travel through the at-grade, signal-controlled intersection and then execute a U turn at the median opening downstream of the intersection. These drivers then can turn right at the crossstreet. For drivers on the sidestreet desiring to turn left onto the major road, they must first turn right at the signal-controlled intersection and then execute a U turn at the downstream median opening and proceed back through the signalized intersection. The MUTIT can be implemented with and without signal control at the median openings on the major road. This synthesis summarizes the advantages and disadvantages of the MUTIT compared to conventional, at-grade signal-controlled intersections with left turns permitted from all approaches. The synthesis presents design guidelines including the location and design of the median crossovers on the major roads. Many of the guidelines presented in the synthesis are from the Michigan Department of Transportation (MDOT), and address directional and bidirectional crossovers and widened areas called "loons" that facilitate the U-turn maneuver by larger vehicles and at roads with narrow medians. The synthesis also discusses application criteria for the MUTIT, and presents information on the capacity and crash experience at these intersections relative to traditional intersections. Special considerations related to signal phasing at the median openings and signal phasing at the at-grade intersection also are discussed. Empirical evidence supports the practice that the reduction in signal phases at intersections can have higher vehicle-processing capacity and better level-of-service. In terms of safety, past research has shown that the reported numbers of crashes at MUTITs are 20 to 50 percent lower than comparable conventional intersections. The major safety benefit is a reduction in the probability of head-on and angle crashes that typically have high percentages of injury severity. Although the MUTIT typically is considered a corridor-wide treatment, the concept has been used successfully at isolated intersections to improve traffic flow and enhance safety. IntroductionThe MUTIT eliminates left turns at intersections and allows the maneuver to be made via median crossovers beyond the intersection. Drivers desiring to turn left at the subject intersection from the major road first must travel through the intersection, execute a U turn at the median crossover, and then make a right turn at the crossroad. Drivers on the minor road desiring to make a left at the subject intersection first make a right turn at the intersection onto the major road, and then make a U turn at the median crossover, and subsequently go straight through the intersection. Figure 1 shows an illustrative photograph of the MUTIT implementation in Michigan, and figure 2 shows the schematic for a typical MUTIT. The MUTIT is typically a corridor treatment. However, the concept is used at isolated intersections to alleviate specific traffic operational and safety problems. Levinson et al. (1) recommended that the application of MUTIT along the corridor should not be mixed with other indirect left-turn treatments or conventional left-turn treatments, thereby meeting driver expectancy. Figure 3 shows the MUTIT movements corresponding to left turns at conventional at-grade intersections. The MUTIT has been used widely in the State of Michigan. Several highways in Michigan, particularly in the Detroit Metropolitan area, were constructed with wide medians on wide rights-of-way. Many of these medians are 18.3 to 30.5 meters (m) (60 to 100 feet (ft)) wide and were built decades ago in semirural areas to separate opposing directions of traffic and to provide an adequate median width for landscaping and beautification. The wide rights-of-way were originally established for "super highways," as they were called in the 1920s. By the early 1960s, many of these highways had capacity problems, generally because of interlocking left turns at the conventional intersections. To address this capacity problem, MUTITs replaced conventional intersections on various corridors. Today, there are more than 684 kilometers (km) (425 miles (mi)) of "boulevards" with over 700 directional crossovers on the Michigan State highway system. Partial implementations or designs with similar concepts have appeared in Florida, Maryland, New Mexico, and New Orleans. Hummer and Reid (2) and Levinson et al. (1) compared the MUTITs to conventional intersections. Hummer and Reid recommended that agencies consider the median U-turn alternative for junctions on high design arterials where relatively high through volumes conflict with moderate or low left-turn volumes, regardless of the cross-street through volumes. Some of the advantages cited include:
Figure 2. Typical schematics of MUTIT.
Figure 3. Vehicular movements at a MUTIT (Source: Signalized Intersections Information Guide, FHWA-HRT-04-091, pg. 243).
Some disadvantages include:
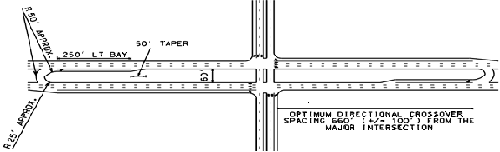
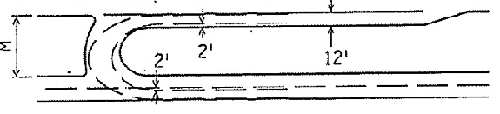
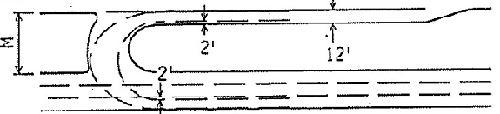
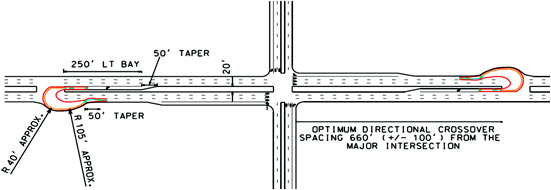
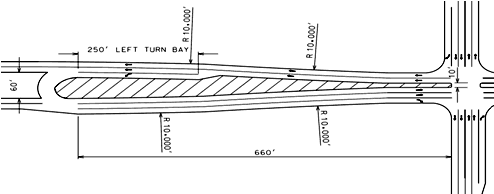
MUTIT Design GuidelinesThe 2004 AASHTO Green Book (3) recommends a distance of 122 to 183 m (400 to 600 ft) for the minimum spacing between the median crossover and the MUTIT intersection. The Michigan Department of Transportation (MDOT) recommends a distance of 201 m (660 ft) (+/- 30.5 m (100 ft)) for the median crossover from the MUTIT intersection. The distances recommended by the MDOT were established to accommodate drivers desiring to turn left from the crossroad. The longer distance facilitates the completion of the U-turn maneuver at the median crossover and subsequent right turn maneuver at the intersection of the major road and cross street for a 72 km/hour (h) (45 mi/h) posted speed limit on the major road. The selection of the spacing from the median crossover to the intersection is also a tradeoff between preventing spillback from the main intersection and the adverse impacts of additional travel for the left-turning vehicles. The Access Management Manual recommends an access spacing of 201 m (660 ft) on minor arterials and 402.3 m (1320 ft) on principal arterials between consecutive directional median openings on divided highways. Figures 4a, 4b, and 4c below show typical U-turn maneuvers. Table 1 gives the minimum median widths required for U turns from the major road as suggested by the MDOT. Figure 4a. Left lane to inner lane maneuver.
Figure 4b. Left lane to second lane maneuver.
Figure 4c. Left lane to third lane maneuver.
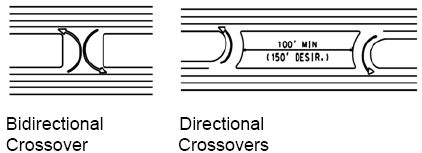
Location and Design of Median CrossoversFigure 5 shows the two types of median crossovers, the "bidirectional" and the "directional." A bidirectional crossover is simply an opening in the median for vehicles to make U turns from either direction. Cars may enter from either direction. Bidirectional crossovers are sometimes installed without any deceleration or storage lanes. Most bidirectional median crossovers without deceleration/storage lanes can only store one or two vehicles. With high turning volumes, an interlocking effect is sometimes created. The vehicles queued to enter the crossover cannot do so until the vehicles in the crossover move out of the opening and merge into the travel lanes. A directional crossover is a one-way crossover with a deceleration/storage lane. This type of median crossover allows vehicles traveling in one direction of the boulevard to enter. As a result, motorists at a properly designed directional crossover should never experience the interlocking effect found at medians with a bidirectional crossover. Taylor et al. (4) studied the effects of replacing existing bidirectional crossovers with directional crossovers on eight roadway sections in Michigan between 1991 and 1997. The study investigated crash frequency on roadway segments for two datasets. The study did not adjust for regression to the mean using control sites. One dataset included all the intersection crashes in the study segment, and the other dataset excluded intersection crashes from the study segment. The important findings of this study were:
Figure 5. Directional and bidirectional crossovers.
Scheuer and Kunde (5) studied the effects of replacing existing bidirectional crossovers with directional crossovers on two segments of Grand River Avenue in Wayne County, MI, totaling 6.78 km (4.21 mi). The study segment was an eight-lane boulevard in a commercialized area with many driveways and minor crossroads. Three years of "before" crash data and approximately 2 years of "after" crash data were used in the analysis. The project achieved a total crash reduction of 24 percent. When the intersections where the crossovers were in-line with a crossroad are omitted, the crash reduction was 29 percent. Head-on and angle crashes showed the greatest reduction. The sideswipe crashes did increase, but the decrease in the heads-on and angle crashes far outweighed the increase of sideswipe crashes. Castronovo et al. (6) studied the safety performance of divided highways with directional median crossovers versus bidirectional median crossovers. The key findings were:
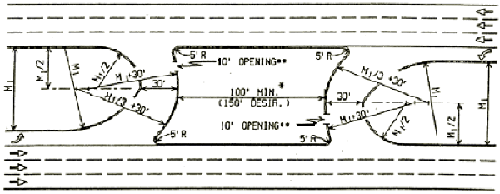
Figure 6a. Cured section of directional crossover (Source: MDOT Geometric Design Guide 670). CREST OF MOUND, FOR DRAINAGE AND AETHETICS, SHOULD SHOULD NOT EXCEED 1' ABOVE TOP OF CURB. IF NOT PAVED, VEGETATION MUST NOT OBSTRUCT DRIVER SIGHT DISTANCE (TYP.)
Figure 6b. Uncured section of directional median crossovers (Source: MDOT Geometric Design Guide 670).
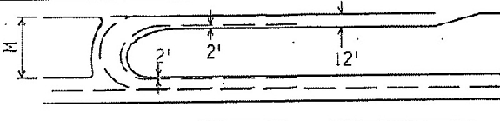
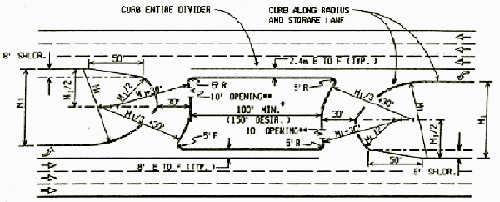
Based on the studies cited, directional median crossovers likely provide better traffic operations and safety performance than bidirectional median crossovers. Figures 6a and 6b illustrate MDOT guidelines for designing directional median crossovers. Location and Design of LoonsThe design vehicle and the number of opposing lanes directly govern the required median width at the MUTIT median crossover junction. If the available median width is not sufficient, then agencies add additional pavement outside the travel lane to allow the design vehicle to complete the U-turn maneuver and merge back into the traffic stream. The additional pavements are typically referred to as "loons." Sisiopiku and Aylsworth-Bonzelet (7) defined loons as expanded paved aprons opposite a median crossover. Figure 7 shows a schematic diagram of a loon design, and figure 8 is a photo of an actual loon implementation in Wilmington, NC. The design width for loons will be the difference between the recommended median width in table 1 and the available median width. Sisiopiku and Aylsworth-Bonzelet (7) evaluated the design and operation of loons and developed guidelines for loon design and placement. The important findings of the study were:
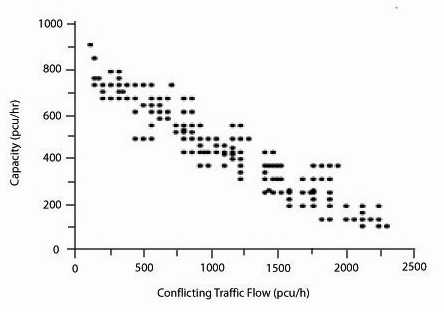
Overall, loons are good design practice for facilities with narrow medians. With the use of loons, agencies can realize safety and operational benefits of a divided roadway (boulevard) with MUTITs, without incurring the significant cost of acquiring enough land along the entire corridor to provide sufficient median width. Alternative Intersection DesignMichigan corridors with MUTIT typically have medians widths ranging from 18.3 to 30.5 m (60 to 100 ft). A wide median on the major road at the intersection of the major road and the cross street increases the pedestrian crossing distance along the sidestreet. Larger clearance intervals are required for the sidestreet signal phase with an increased possibility of vehicles and pedestrians getting "stranded" in the median space. Therefore, narrower medians with sufficient pedestrian refuge areas may be more efficient for the pedestrians and sidestreet traffic at the intersection of the major road and cross street. Figure 9 shows a possible reduction in median width at the intersection for a roadway with a median width of 18.3 m (60 ft) and a posted speed limit of 80.5 mi/h (50 mi/h). The reduction in median width was achieved by using reverse curves of sufficiently large radii on normal crowned sections of the roadway. Capacity of Nonsignalized U-Turn LanesThe Highway Capacity Manual 2000 (HCM) treats U turns as left turns for estimating saturation flow rate. However, the operational effects of U turns and left turns are different. U-turning vehicles have slower turning speeds than left-turning vehicles. Al-Masaeid (8) studied the capacity of U turns at unsignalized intersections as a function of the conflicting traffic flow on two opposing through lanes for median-divided roadways in Jordan . Figure 10 shows the field data collection results. He developed regression equations to predict the U-turn capacity based on the conflicting flows on two opposing through lanes. C = 799 - 0.31 * qc C = 1,545 - 790 * exponential (qc/3,600) C = 799 - 0.62*qcp Where: C = capacity of U-turn movement in passenger car equivalent units per hour (PCU/hr). qc = conflicting traffic flow on two lanes (PCU/hr). qcp = conflicting traffic flow per lane (PCU/hr). Yang et al. (9) studied the gap acceptance of U-turn maneuvers at median opening for 10 sites in Tampa, FL, and concluded that the critical gap ranged from 5.8 seconds to 7.4 seconds. Carter et al. (10) collected data at 14 signalized intersections with U turns in North Carolina. Based on a large database, they recommend a saturation flow adjustment factor of 0.82 for U-turn lanes at signalized intersections without conflicting right-turn overlap phase on the side street. Tsao and Ando (11) and Liu et al. (12) suggested saturation flow rate reduction factors of 0.8 and 0.76 for U-turn lanes at signalized intersections, respectively. Provision of a Signal Phase to Serve U turnsThe HCM suggests implementing a protected left-turn phase when the cross product of the hourly left-turning volumes and the corresponding hourly opposing through volumes exceeds the threshold value based on the number of opposing through lanes. Cross product thresholds of 50,000, 90,000, and 110,000 are applicable for one, two, and three lanes of opposing through traffic, respectively. The Traffic Control Devices (TCD) Handbook suggests the following criteria for where and when a left-turn phase should be provided: 1. Volume
2. Delay Left-turn delay of more than 2.0 vehicle hours in the peak hour on a critical approach, provided there are at least two left turns per cycle during peak hour and the average delay per left-turning vehicle exceeds 35 seconds. 3. Crashes—number of left-turn crashes
The criteria above apply when determining whether a separate left-turn phase is needed at a signal-controlled intersection. The criteria can be applied equally, or in a more conservative way, applied to determine when signal control is needed at median crossovers to accommodate U turns. Signalized median crossovers can provide higher U-turn capacities compared to unsignalized median crossovers when the green time for the signalized median U-turn phase is adequate to satisfy the traffic demand. In addition, it is relatively easy to coordinate the signal at a median crossover with the signal at the main intersection without adding much extra delay to the high-volume mainline traffic. Figure 7. Schematic of a loon implementation for a Michigan MUTIT.
Figure 8. Example of loon implementation for a Michigan MUTIT.
Figure 9. Example of a transition from a wide median section to a narrow median section on MUTIT corridors.
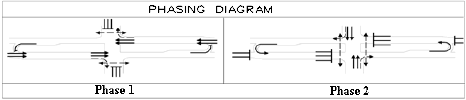
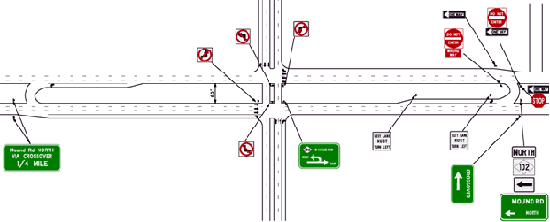
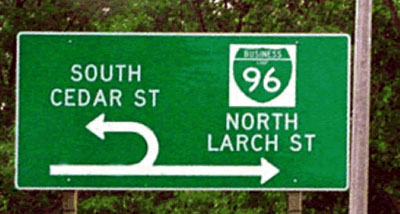
Signal PhasingThe signal control at the intersection of the major road and minor crossroad operates with two signal phases because all left turns are prohibited at this junction. Figures 11a and 11b show the typical signal phasing diagram for the 2-phase signal. In some cases, the green signal indication at the median crossover junction for phase 2 can be delayed slightly relative to the green signal indication for the through/right-turning vehicles on the crossroad. This facilitates uninterrupted movement for the left-turning vehicles from the crossroad. If the median crossover is unsignalized, the signal phasing would only apply at the major road/minor road junction. Typical signal cycle lengths for the MUTIT range from 60 to 120 seconds. If the left-turn volumes are heavy, shorter cycle lengths will reduce spillback into the intersection. The pedestrians move in the direction of traffic with signalized pedestrian phases. Signalized pedestrian phases across the major road with wide medians might reduce the operational efficiency of the MUTIT when cross-street traffic is minimal but pedestrian presence is significant during the peak hour periods. Signing PlanFigure 12 shows the typical signing plan for MUTIT in Michigan. Figures 13a to 13e show several examples of "innovative" signing treatments for MUTITs executed in Michigan. Sisoupiku and Aylsworth-Bonzelet (7) observed several motorists violating the turn prohibition and executing direct left-turns from the crossroad at rural sites. At intersections where violations were observed, there existed standard indirect left-turn signs and overhead signing prohibiting left-turns. Positive guidance communicated through additional signs may be beneficial in reducing driver confusion and ensuring higher rates of driver compliance. Figure 10. Scatter plot of U-turn capacity versus conflicting traffic flow for unsignalized median openings. ©1999 Institute of Transportation Engineers, 1099 14th Street, NW, Suite 300 West, Washington, DC 20005-3438 USA, www.ite.org. Used by permission.
Traffic Operational PerformanceReid and Hummer (13) compared traffic operations along a typical arterial highway with MUTITs versus conventional designs with two-way left-turn lanes (TWLTL). The analysis corridor was a 4.02-km (2.5-mi) section of the Northwestern Highway Corridor in Detroit, MI. The section consisted of five major signalized intersections with varied spacing from 0.5 to 1.1 km (1,600 to 3,500 ft) and annual average daily traffic (AADT) ranging from 52,000 to 60,000 vehicles per day. Researchers used CORSIM to simulate traffic performance and used SYNCHRO to develop optimized signal timings. Four time periods were considered in the analysis, including peak periods in the morning, noon, midday (2:00 p.m. to 3:00 p.m.), and evening. Average measures of effectiveness (MOEs) were developed for a total of 48 CORSIM runs. The MUTIT showed a 17 percent decrease in total travel time within the study area network compared to TWLTL. Figure 11. Example of typical signal phasing for the MUTIT.
Figure 12. Example of typical signing plan for the MUTIT in Michigan.
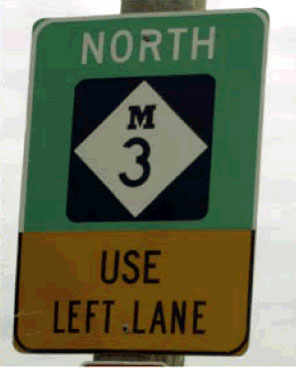
FIGURE 13. EXAMPLES OF "INNOVATIVE" SIGNING PLANS FOR THE MUTIT IN MICHIGAN. Figure 13a. Example 1 of innovative signing. (Credit: Lee Rodegerdts)
Figure 13b. Example 2 of innovative signing. (Credit: Chris J. Bessert, www.michiganhighways.org)
Figure 13c. Example 3 of innovative signing. (Credit: Warren Hughes)
Figure 13d. Example 4 of innovative signing. (Credit: Shawn Glynn)
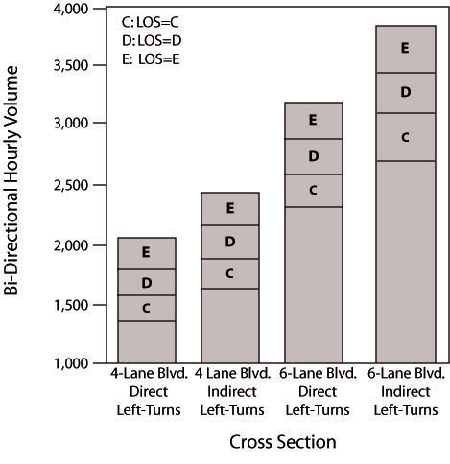
Average speeds increased by 25 percent for MUTIT compared to the TWLTL. The average number of stops increased for the MUTIT compared to the TWLTL. The analysis indicated that the MUTIT had the potential to significantly improve system travel times and speeds in the corridor during the busiest hours of the day to not compromise system travel times during off-peak periods. Reid and Hummer (14) later used CORSIM to compare the traffic performance of seven unconventional arterial intersection designs, including the quadrant, median U-turn, superstreet, bowtie, jughandle, split intersection, and continuous flow intersections. The study used turning movement volumes from existing isolated intersections in Virginia and North Carolina. Off-peak, peak, and volumes corresponding to 15 percent higher than the peak volumes were examined. A total of 36 to 42 CORSIM simulation runs of 30-minute durations were analyzed for each intersection. For MUTITs, the CORSIM models used unsignalized U-turn crossovers for two-lane collector roads and signalized U-turn crossovers for four-lane collector roads. Entering volumes for the simulated intersections ranged from 4,500 vehicles per hour (vph) to 7,500 vph. The MUTIT produced significantly lower average total travel times in comparison to the conventional intersection. The change in overall travel times for all movements through the intersection, when compared to a conventional intersection, was −21 to +6 percent during peak conditions. The overall change in the number of stops when compared to a conventional intersection was −2 to +30 percent during peak conditions. Maki (15) compared the MUTIT and the conventional TWLTL on 4-lane and 6-lane boulevards and found a 20 to 50 percent increase in capacity (throughput) for the MUTIT. Figure 14 shows the level of service (LOS) comparison between corridors with MUTITs and conventional intersections. Figure 14. LOS comparison of divided highways. (Source: Robert Maki, City of Surprise, AZ)
Bared and Kaiser (16) studied the traffic operational benefits of signalized median U turns on a typical 4-lane road intersecting a 4-lane road using CORSIM. The cross-street left turn movement was allowed at the major road/cross street intersection resulting in a three-phase signal. An acceleration lane was provided for the right-turning vehicles from the major road to the cross street. These two features used in the study are different from the typical MUTIT implementations in Michigan. Entering volumes at the intersections used in the simulations ranged from 2,000 vph to 7,000 vph. The key findings of the study were:
Dorothy et al. (17) evaluated traffic operational measures to study the differences in the performance of MUTITs compared to the conventional TWLTLs. The TRAF-NETSIM model was used to simulate these situations for 1-hour periods. The simulated network had signals every 0.8 km (0.5 mi) with the directional crossovers every 0.4 km (0.25 mi). A 60/40 split between the entering volumes on major road and cross street was assumed. When turning percentages were low, the crossovers were modeled as STOP-controlled; with higher volumes, signal control was assumed in the model. The signal cycle was 80 seconds with a 60/40 distribution of green time for the major road phase and cross-street phase, respectively. The median width varied from 12.2 to 30.5 m (40 to 100 ft). The key findings were:
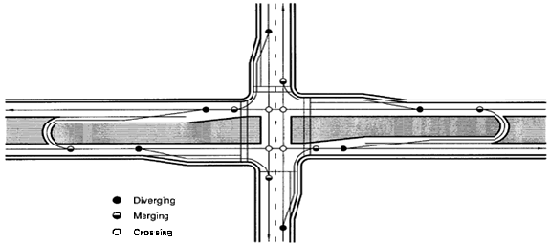
Topp and Hummer (18) compared median crossovers on the cross street with median crossovers on the arterial highway for MUTITs using CORSIM. The left-turning volumes on the major road varied from 100 vph to 400 vph, the through volumes on the major road varied from 1,000 vph to 2,000 vph, the left turns on the cross street varied from 50 vph to 200 vph, and the through volumes on the cross street varied from 500 vph to 1,000 vph. The median crossovers were signalized wherever warranted. Results showed that the MUTIT design with the U-turn movement located along the cross street reduced percent stops, total travel time, and delay for most of the volume combinations analyzed in comparison to the crossover on the arterial. Savage (19) studied the conversion of five-lane roadway with a TWLTL to a MUTIT in Michigan and found a 20 to 50 percent increase in the corridor capacity. Koepke et al. (20) found that the directional crossover design provides about 14 to 18 percent more capacity than the conventional dual left-turn lane designs. The results of critical lane volume analyses, after taking into account overlapping traffic movements, revealed reductions of about 7 to 17 percent in critical lane volumes, depending upon the number of arterial lanes (six or eight) and the traffic mix. Lower critical lane volumes translate into higher traffic flow capacity at the intersection. A study by Stover (21) computed critical lane volumes for the intersection of two six-lane, arterial roads. The effects of redirecting left turns were computed using these volumes. The provision of dual left-turn lanes on all approaches reduces critical lane volumes by 12 percent compared to providing single left-turn lanes but still requires multiphase traffic signal controls. The rerouting of left turns via directional crossovers and their prohibition at the main intersection reduces critical lane volumes by 17 percent. Overall, the literature shows that reducing signal phases and redirecting the left-turning movement at the intersection for the MUTIT provided significant benefits in terms of increased roadway capacity and reductions in travel time and vehicular delay when compared to conventional intersections. Traffic Safety PerformanceTable 2 from the FHWA Signalized Intersections: Informational Guide (22) shows the number of conflict points at a four-leg signalized intersection as compared to the MUTIT. The MUTIT eliminates all crossing (left turn) conflict points and reduces the number of merge/diverge conflict points as compared to a four-leg signalized intersection. Figure 15 shows the conflict point diagram for a MUTIT. Observations indicated a 60 percent reduction in total crash frequencies and 75 percent reduction in total injuries. Reductions of 17 percent, 96 percent, and 61 percent were observed for rear-end crashes, angle crashes, and side-swipe crashes, respectively. Figure 15. Conflict point diagram for the MUTIT.
Kach (23) compared the safety performance of conventional signalized intersections to MUTIT locations in the State of Michigan. The final comparison study subset consisted of 15 MUTIT locations and 30 conventional intersections.
Maki (15) evaluated the safety benefits of replacing existing conventional signalized intersections with the MUTITs on Grand River Avenue in Wayne County, MI. The 0.7-km (0.43-mi) study segment on Grand River Avenue was from the east of Poinciana to west of Delaware Street. The analysis period for the before-after study was 1990 to 1995. The crossroads in all cases were undivided with crossroads intersecting at either 90 degrees or on a skew. Crash data for the years 1986-1990 were obtained for each site. Table 3 shows the safety performance of the MUTITs in comparison to conventional intersections. "Alpha" in Table 3 denotes the confidence level that the two rates are statistically different. Table 4 shows the estimated reduction in the expected number of crashes by crash type for all crashes, injury crashes, and property damage only (PDO) crashes for a road with 60,000 AADT. Castronovo et al. (24) analyzed the MUTIT safety benefits versus conventional intersections as a function of traffic signal density using data from 123 segments of boulevards totaling 363.7 km (226 mi). The results indicated that as traffic signal density increased, the MUTIT had increasingly lower crash rates (measured in crashes per 161 million vehicle kilometers (100 million vehicle miles). For typical suburban conditions, with signal densities of one or more signals per 1.61 km (1 mi), the crash rate for MUTITs was about one half of the rate for conventional intersections. For typical rural conditions, with signal densities of one or less signal per 1.61 km (1 mi), the reduction in crashes for MUTITs was 36 percent when compared to conventional intersections. In NCHRP Report 524 (25), researchers studied the safety performance of unsignalized median openings. The research results indicated that access management strategies that increase U-turn volumes at unsignalized median openings can be used safely and effectively. Analyses of collision data found that collisions related to U-turn and left-turn maneuvers at unsignalized median openings occur infrequently. In urban arterial corridors, unsignalized median openings had an average of 0.41 U-turn-plus-left-turn accidents per median opening per year. In rural arterial corridors, unsignalized median openings experienced an average of 0.20 U-turn-plus-left-turn accidents per median opening per year. On the basis of these limited collision frequencies, the authors concluded that there is no indication that U turns at unsignalized median openings are a general safety concern. CONCLUSIONSBased on the literature review conducted, the following summarizes the major conclusions:
REFERENCES
|
|||||||||||||||||||||||||||||||||||||||||||||||||||||||||||||||||||||||||||||||||||||||||||||||||||||||||||||||||||||||||||||||||||||||||||||||||||||||||||||||||||||||||||||||||||||||||||||||||||||||||||||||||||||||||||||||||||||||||||||||||||||||||||||||||||||||||||||||||||||||||||||||||