U.S. Department of Transportation
Federal Highway Administration
1200 New Jersey Avenue, SE
Washington, DC 20590
202-366-4000
Federal Highway Administration Research and Technology
Coordinating, Developing, and Delivering Highway Transportation Innovations
 |
| This report is an archived publication and may contain dated technical, contact, and link information |
|
Publication Number: FHWA-HRT-07-059
Date: October 2007 |
||||||||||||||||||||||||||||||||||||||||||||||||||||||||||||||||||||||||||||||||||||||||||||||||||||||||||||||||||||||||||||||||||||||||||||||||||||||||||||||||||||||||||||||||||||||||||||||||||||
Updates to Research on Recommended Minimum Levels for Pavement Marking Retroreflectivity to Meet Driver Night Visibility NeedsPDF Version (660 KB)
PDF files can be viewed with the Acrobat® Reader® 2. LITERATURE REVIEWOver the past two decades, there has been a variety of research evaluating pavement marking retroreflectivity, with the results leading to several proposals from government agencies and professional organizations recommending minimum pavement marking retroreflectivity levels. This literature review first traces these proposals and then examines the underlying minimum retroreflectivity research upon which these proposals are based. Finally, it examines many key factors affecting driver visibility of pavement markings. 2.1. Minimum Pavement Marking Retroreflectivity ProposalsTurner authored a 1999 internal FHWA report in which the first government–based recommended minimum pavement marking retroreflectivity levels were crafted based mostly on research results available at that time.(7) The 1999 research-proposed values are shown in table 1 along with the rationale for each value. The recommended minimum retroreflectivity values rely heavily on the CARVE-produced values in Zwahlen’s research.(1) Zwahlen’s CARVE input included a fully marked (yellow center line skip with white edge lines), two-lane, straight roadway. The road surface used was old asphalt, as the majority of roads in the United States have an old asphalt surface, either as the original surface or as an overlay. The vehicle-driver geometry used was an average-sized adult in an average passenger sedan using a General Electric H6054 low-beam headlamp (i.e., a sealed-beam headlamp representing those typically found on vehicles in the 1970s and early half of the 1980s). A 62-year-old driver was used in order to accommodate an estimated 95 percent of the nighttime motorists in the United States. Zwahlen created two sets of data, shown in table 2. The first set is minimum retroreflectivity recommendations for fully marked roads without RRPMs, which used a 3.65-second preview time in the CARVE model. The second set is for fully marked roads with RRPMs, which used a 2.0-second preview time in the CARVE model.(1) It should be noted that the 3.65-second preview time is one of the longest preview times recommended in the literature. Table 1. FWHA research recommendations for minimum pavement marking retroreflectivity.(7)
Note: Retroreflectivity values are in mcd/m²/lux Table 2. Zwahlen’s recommended minimum RL values.(1)
1 mi/h = 1.61 km/h
FHWA presented the results of Turner’s research in three workshops held for public agencies in 1999. Consensus from these workshops was incorporated into an unpublished report that recommended two preferred alternatives for the format of minimum retroreflectivity guidelines.(8) One format was based on color and speed; the other based on color and roadway classification. It should be noted that no additional research was used to adjust the earlier FHWA research recommendations shown in table 1. Rather, the adjustments made as a result of the three workshops reflect the consensus of the workshop participants. The two alternatives are shown in table 3 and table 4. Table 3. Workshop-proposed speed-based minimum pavement marking retroreflectivity values.(8)
1 mi/h = 1.61 km/h Table 4. Workshop-proposed classification-based minimum pavement marking retroreflectivity values.(8)
The American Traffic Safety Services Association (ATSSA) undertook a similar effort in 2004, with the ATSSA Pavement Marking Committee developing minimum retroreflectivity recommendations that were then approved by the ATSSA Board of Directors.(9) As with the recommendations from the FHWA agency workshops, the ATSSA recommendations (shown in table 5) are not based on any specific research; instead, they are based on the consensus of traffic safety professionals. The most significant element of this proposal is that the minimum maintained pavement marking levels are the same for both yellow and white pavement markings. Table 5. ATSSA recommended minimum RL values.(9)
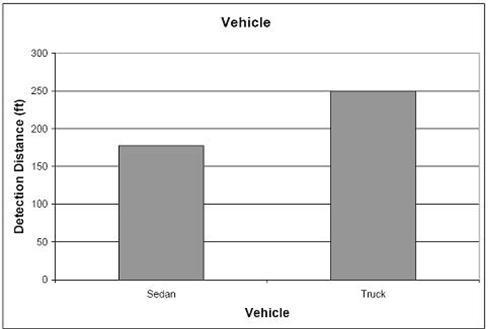
2.2. Minimum Pavement Marking Retroreflectivity ResearchThe above proposals take into account the results of several studies that attempt to identify the minimum pavement marking retroreflectivity that is needed by drivers. These studies recommend a range of minimum retroreflectivity values, depending on the research protocol. The following section provides a summary of some of the key studies that have shaped these proposed minimum pavement marking retroreflectivity levels. In 1986, the 3M Company conducted a study where subjects drove a test road marked similarly to one side of a four-lane freeway. The markings applied to the roadway ranged in retroreflectivity from 30 to 1,700 mcd/m²/lux. Participants viewed the markings at distances of 30 m (98.4 ft) and 100 m (328.0 ft) and were asked to rate the markings on a scale of one to seven, with one being “very poor” and seven being “superior.” The minimum acceptable rating was three. The researchers fit a regression curve to relate the average rating to the retroreflectivity of the pavement markings and found that a minimum acceptable rating corresponded with a retroreflectivity value of 90 mcd/m²/lux. A minimum value of 100 mcd/m²/lux was suggested as a conservative recommendation due to instrument variability.(10) In a 1991 University of North Carolina study, 59 participants were driven over a 32-km (20-mile) test course. The participants made 20 observations of pavement markings with various retroreflectivity levels and evaluated them as less than adequate, adequate, or more than adequate. The participants also made subjective evaluations of markings presented to them in a laboratory setting. Markings with a retroreflectivity value of 93 mcd/m²/lux were rated as adequate or more than adequate by 90 percent of the participants. The researchers noted that the participants were mostly younger drivers and that older drivers would likely need a higher retroreflectivity value than 93 mcd/m²/lux.(11) Therefore, the researchers performed a similar study in 1996 that focused on older drivers, finding that 85 percent of drivers aged 60 or older rated markings with a retroreflectivity of 100 mcd/m²/lux as adequate or more than adequate.(12) The Minnesota Department of Transportation (MnDOT) sponsored a 1998 study that used a sample of drivers (200 in total) with an age distribution comparable to the age distribution in the state. Each participant drove a designated route on existing roads and was asked to rate the quality of the pavement markings. The study found that 90 percent of the participants rated markings with a retroreflectivity of 100 mcd/m²/lux as acceptable. Additionally, the researchers found that the acceptability ratings of the pavement markings increased dramatically as the retroreflectivity increased from 0 to 120 mcd/m²/lux, much less as the retroreflectivity increased from 120 to 200 mcd/m²/lux, and almost none as the retroreflectivity increased beyond 200 mcd/m²/lux. The researchers recommended that MnDOT use 120 mcd/m²/lux as the threshold between acceptable and unacceptable pavement marking retroreflectivity in its pavement marking maintenance program.(13) In a 2002 study for the New Jersey Department of Transportation (NJDOT), 64 participants drove a 52-km (32-mile ) course laid out on existing roadways in their own vehicles and were asked to rate the markings as acceptable or unacceptable. For drivers younger than 55 years of age, the retroreflectivity threshold of an acceptable pavement marking was between 80 and 130 mcd/m²/lux while the threshold for drivers older than 55 years of age was between 120 and 165 mcd/m²/lux. Pavement markings deemed acceptable by participants ranged from 70 to 170 mcd/m²/lux. The analysis further suggested that NJDOT should concentrate on re-marking roadways with pavement marking retroreflectivity less than 130 mcd/m²/lux rather than those with a retroreflectivity greater than 130 mcd/m²/lux to achieve “a greater relative increase in driver satisfaction.”(14) 2.3. Key Factors Affecting Pavement Marking VisibilitySeveral factors affect the ability of a driver to see a pavement marking. Key research investigating the effects that these factors have on pavement marking visibility is summarized in the flowing sections. 2.3.1. Pavement Marking RetroreflectivityResearch has shown that increasing the retroreflectivity of a pavement marking will increase the detection distance—the distance at which a driver will initially see an approaching pavement marking (or its end). The Texas Transportation Institute (TTI) conducted a study evaluating the visibility of signs and pavement markings from the perspective of commercial vehicle drivers.(15) Two tape products were investigated, one of which was used both in new condition and with a clear mask applied. Thus, three different markings were tested, representing low, medium, and high retroreflectivity coefficients. Pavement marking detection distance data were collected in a 1998 Chevrolet Lumina and a 1986 Freightliner traveling at 48.3 km/h (30 mi/h) . Participants were following a solid white right edge line and asked to indicate to the researcher in the vehicle with them when they could clearly see the end of the pavement marking. The results showed that as the retroreflectivity increased from 100 to 800 mcd/m²/lux, average detection distance also increased from 86.9 m (285 ft) to 152.7 m (502 ft) , respectively, as shown in figure 1. Figure 1. Detection distance versus pavement marking retroreflectivity. 2.3.2 Pavement Surface MaterialOne of the key factors that determine whether a pavement marking will be seen is its contrast with the surrounding pavement. The same pavement marking will be more easily seen when applied to material with which it has a greater luminance contrast than when applied to one with which it has a lower luminance contrast. Computer-based visibility models such as CARVE and TARVIP evaluate the visibility of a pavement marking by comparing this luminance contrast between the marking and the surrounding road surface with a minimum human contrast threshold.(16) In 1999, Schnell et al. developed retroreflectance matrices for old asphalt, new asphalt, old concrete, and new concrete. The researchers designed an apparatus that functioned as a goniometer but did not require the extraction of a road surface sample. Measurements of luminance and illuminance were taken over a range of observation and entrance angles for typical headlamp-pavement-marking-driver geometry, varying from a 5 percent female driver in a small car to a 95 percent male driver in a semi truck. The resulting RL values were then calculated. The research results showed that the new asphalt surface was substantially less reflective than the old asphalt surface. The old Portland cement concrete surface, however, was found to be less reflective than the new concrete surface, with embedded rubber, dirt, and grease leading to a darker surface. New concrete and old asphalt were found to have similarly high reflectance levels. The new asphalt had the lowest reflectance levels, therefore providing better luminance contrast for optimal pavement marking visibility.(16) 2.3.3 Vehicle TypeThe geometry of the subject vehicle has several influences on the driver’s visibility of pavement markings. The height of the headlamps above the pavement surface determines the entrance angle of the headlamps’ light for a given distance away from the pavement marking. This height can also determine how far the headlamps’ light travels away from the vehicle before meeting the road surface. The vertical separation between the driver’s eyes and the headlamps determines the observation angle for a given distance away from the pavement marking. Finally, the height of the driver’s eyes above the pavement determines the size of the projected area of the pavement marking on a plane perpendicular to the driver’s line of sight for a given distance away from the pavement marking. In a 2005 static study of the visibility of wet pavement markings, Gibbons et al. had 33 participants over the age of 60 evaluate the visibility of six different pavement markings in simulated rain conditions by counting the number of skip lines they could see from both a stationary Volvo Class 8 tractor and a stationary Ford Crown Victoria. One of the findings of the study showed that under saturated conditions, the visibility distance from the semi truck was between 8 percent and 56 percent greater than the visibility distance from the Ford Crown Victoria, as shown in figure 2. The researchers theorized that because the skip line looks larger from the truck than it does from the sedan, the larger visual target creates a lower contrast threshold for a given skip mark in the truck compared with the sedan.(17) Figure 2. Saturated condition visibility distance versus marking type and vehicle type. In a 2006 study of the impact of pavement marking width on visibility distance, Gibbons et al. had 19 truck drivers and 19 sedan drivers operate a vehicle at 40.3 km/h (25 mi/h) on a course at the Virginia Smart Road Facility. When the research participants detected an approaching pavement marking, they notified the researcher seated next to them. The researchers found that the semi truck drivers had a significantly larger average detection distance than the sedan drivers, as shown in figure 3.(18) Figure 3. Average skip line detection distance versus vehicle type. The University of Michigan performed a study where the mounting height of a low-beam headlamp and driver eye height were varied. Participants were stationary and asked to state when they detected a retroreflective pavement marking moving toward them. The researchers found that as the mounting height increased from 0.6 m (2 ft) to 1.2 m (4 ft), the detection distance increased by 19 percent, suggesting that pavement markings are more visible for truck drivers than for car drivers.(19) 2.3.4 Vehicle HeadlampsThe changing nature of vehicle headlamps and their beam patterns have had an effect on driver visibility of pavement markings. This can be illustrated using the Exact Road Geometry Output (ERGO) software. ERGO calculates entrance and observation angles based on the exact location and orientation of headlamps, visual targets such as signs or pavement markings, and the driver’s eye. ERGO then determines the illuminance reaching the visual target as well as the luminance reaching the driver’s eyes.(20) For this study, ERGO was used to estimate the illuminance reaching pavement markings as a function of four different headlamps. A total of four distances were selected for evaluation purposes: 30 m (98 ft), 60 m (197 ft), 100 m (328 ft), and 150 m (492 ft) from a vehicle , for both the right edge line and the center line (see table 6). The 2A1 headlamp is a sealed beam headlamp that was found in vehicles sometime before 1985.(21) The CARTS50 headlamp is a conglomeration of the 50 th percentile of 26 sealed beam and replaceable bulb headlamps from vehicles sold from 1985–1990.(22) Two vehicle headlamp conglomerations developed by the University of Michigan Transportation Research Institute (UMTRI), the 1997 and 2004 U.S. market weighted headlamps, were included as well.(23) The four headlamps represent the progression of vehicle headlamp technology from the 1970s to now. The results of the ERGO modeling, shown in table 6, indicate that each evolution of newer headlamps casts more light upon edge lines and center lines at distances past 30 m (98 ft) than the older headlamps. Therefore, the trend in headlamp design generally improves pavement marking visibility. Table 6. Headlamp illuminance along edge lines and center lines.
Note: Lane width = 3.66 m ( 12 ft ) 2.3.5 Overhead LightingResearch has shown that overhead roadway lighting can improve the visibility of retroreflective pavement markings. For example, in an industry-sponsored study, participants drove through a closed course and viewed the pavement markings with levels of retroreflectivity varying from 30 to 1,700 mcd/m²/lux with 15.2-m (50-ft) high luminaires to the left of the roadway. The luminaires contained 250-watt mercury-vapor lamps and were spaced at 76.2 m (250 ft). The researchers found that none of the markings were rated below a minimum acceptable level in the lighted condition (in the unlighted condition a 100 mcd/m²/lux minimum acceptable level was derived). Adequate line luminance was provided by the roadway lighting without any contribution from the pavement marking retroreflectivity. Therefore, lines of similar retroreflectivity received higher ratings from the participants under the illuminated condition than they received under the dark condition. (10) 2.3.6 Edge Line PresenceResearch suggests that the additional marking material provided by white edge lines over a road marked with only a center line improves driver visibility of the roadway, providing longer end detection distances. In a 1997 study, (24) researchers at Ohio University had 40 healthy college students drive a 1989 Dodge Aries sedan through a closed course on an unused airport runway. The subjects were asked to inform the researcher seated in the car with them when they saw the end of various pavement markings treatments. The first part of the experiment consisted of five center line only markings: two single dashed lines of different widths, two single solid lines of different widths, and a double solid line. The second part of the experiment consisted of two fully marked roads: one with two solid white edge lines and a double solid yellow center line, and the other with two solid white edge lines and a single dashed yellow center line. On average, the pavement marking treatments with solid white edge lines and single dashed or double solid yellow center lines resulted in end detection distances that were approximately twice those of the pavement marking treatments consisting of the corresponding yellow center line alone. The researchers also found that the addition of a yellow center line only marginally increased the detection distance (8.5 percent) of a road marked with only a solid white edge line on the right shoulder, implying that the edge lines predominantly govern the detection distance of a fully marked road. 2.3.7 Wider Longitudinal MarkingsPast research efforts have been inconclusive in determining the effect of wider longitudinal markings on driver visibility. In the 1997 Ohio University study mentioned previously, the researchers found that for dashed center lines, increasing the line width from 0.05 m (0.16 ft) to 0.1 m (0.3 ft) provided a 6.6 percent increase in average end detection distance. For a single solid center line, the researchers found that the same increase in line width provided a 47 percent increase in average end detection distance.(24) Gibbons et al. found that increasing marking widths from 102 mm (4 inches ) to 152 mm (6 inches) increased detection distance, but there was no increase in detection distance when widening the markings from 152 mm (6 inches) to 203 mm (8 inches).(18) However, researchers in Virginia evaluated the effects of replacing 102-mm (4-inch) edge lines with 203-mm (8-inch) edge lines on rural two-lane roads. Twelve sections of roadway were outfitted with speed and lateral position detectors to collect speed and lane position data from passing vehicles in the before (102-mm (4-inch) edge lines) and after (203-mm (8-inch) edge lines) conditions. The researchers found that increasing the edge line width from 102 mm (4 inches) to 203 mm (8 inches) produced no statistically significant difference in lateral placement variance, encroachment by autos and trucks, mean speed, or speed variance. They concluded that the wider edge lines did not practically effect lateral placement or speed. (25) In another study, researchers identified 853 km (530 mi) of rural two-line highways in New Mexico that had high run-off-the-road (ROR) crashes. Of these roads, 283.3 km (176 mi) were treated with 203-mm (8-inch) edge lines while the remainder was treated with 102-mm (4-inch) edge lines for control purposes. The researchers compared 42 months worth of “before” crash data and 17 months of “after” crash data at the two sites and found that the treatment sites did not perform any better than the comparison sites in terms of ROR crashes.(26) TTI researchers conducted an investigation of the visibility of various pavement marking materials under wet and dry conditions, including 102-mm- (4-inch-) and 152-mm- (6-inch-) wide materials. In Phase I, participants drove down an isolated test track in a passenger sedan at 48.3 km/h (30 mi/h ) and were asked to inform the researcher in the vehicle with them when they could see isolated skip lines in the center of the travel lane ahead. Subjects repeated their observations while driving down the test track in a simulated rain environment. Although not a focus of the Phase I work, the researchers noted that the detection distances for one of the materials tested (a wet-weather tape, which happened to be one of the best performers in the Phase I study) increased approximately 30 percent under wet conditions when the width was increased from 102 mm (4 inches) to 152 mm (6 inches).(2) This finding led the research team to a more focused effort on detection distances of wider lines under dry and wet conditions. For Phase II of the research, the research team designed a robust experimental protocol to ensure adequate statistical power for testing the potential differences between 102-mm (4-inch) and 152-mm (6-inch) lines (the Phase I finding related to wider lines was based on limited empirical results and not robust statistical testing). In Phase II of the study, the researchers tested the effect of width on the dry and wet detection distances for five different pairs of 102-mm (4-inch) and 152-mm (6-inch) pavement markings. Under wet conditions, two of the 152-mm (6-inch) markings had longer average detection distances (but only by 4.9 m (16 ft) and 4.6 m (15 ft) while one of the 102-mm (4-inch) markings had an average detection distance 3.4 m (11 ft) longer than its 152-mm (6-inch) counterpart. Under dry conditions, three of the 152-mm (6-inch) markings had longer average detection distances (by 5.5 m (18 ft), 5.5 m (18 ft), and 4.6 m (15 ft)), and two of the 102-mm (4-inch) markings had longer average detection distances than their 152-mm (6-inch) counter parts (3.0 m (10 ft) and 4.3 m (14 ft)). The average detection distances did not vary more than 6.1 m (20 ft ), and the researchers found that the differences in average detection distances were no greater than 5 percent.(27) Despite the lack of conclusive evidence supporting wider markings, a survey of state departments of transportation conducted in 2001 showed that at the time, 29 out of 50 states indicated that they were using wider markings to some degree.(28) Fifty-seven percent of the respondents indicated that they used wider lines to improve visibility. Most agencies using wider markings were satisfied with their use, and no agency indicated planned discontinuation of its use. However, the crash-reduction benefits of wider lines are unknown as 10 states indicated that they had performed or taken part in crash studies and found inconclusive results. Therefore, the cost-effectiveness of wider markings is currently unknown. Conclusive evidence that the use of wider pavement markings reduces crashes is not available in the literature, although some positive impacts have been found when using detection distance as a surrogate for safety. However, even those findings are inconclusive in showing that wider lines can increase detection distance or otherwise benefit drivers2.3.8 RRPM PresenceThere are many studies that investigate the visibility of striping and RRPMs separately but few that investigate the interaction between the two and if less line luminance is required of a pavement marking by the driver if RRPMs are present. Researchers with the FHWA conducted driving simulator studies to determine the relative luminance of RRPMs and pavement markings. Participants were shown combinations of RRPMs and pavement markings with low, medium, and high luminance and asked to state when they detected an upcoming curve. The researchers used the data to develop discount factors for required pavement marking luminance when RRPMs were present. Of primary interest are the discount factors for pavement markings with low luminance for low, medium, and high RRPM luminance (23 percent, 48 percent, and 79 percent, respectively). While RRPM luminance drops off rapidly from the “new” condition, it should be noted that due to limitations in the simulation technology, even the high RRPM luminance condition had a luminance well below that which would be expected from a new RRPM (4.06 cd/m² versus 41.2 cd/m²). Therefore, the medium and high RRPM luminance discount factors should not be dismissed.(29) The researchers also conducted field validation studies of the discount factors derived from the simulation studies. Participants drove on a newly-constructed two-lane roadway and were asked to identify when they detected a simulated curve ahead. The curves were delineated with combinations of RRPMs and pavement markings with low, medium, and high luminance. The RRPMs were deployed in conformance with the MUTCD along the center line only. The results showed that the RRPMs had a powerful effect, washing out any influence that pavement markings could exert on curve recognition distance. The results indicated that pavement markings could deteriorate to less than 1 percent of their original luminance before creating any detrimental effect on curve recognition distance. The researchers noted that the weaker RRPMs in the simulator study might be comparable to worn, dirty, or weathered RRPMs that have been in use for some length of time on a roadway. Also of interest, the data showed a 59 percent discount factor in center line pavement marking luminance when white edge lines are also present.(30) Other research shows that RRPMs in good condition far out perform new pavement markings of any material in terms of detection distance, especially in wet weather. In the previously mentioned TTI study by Carlson et al., the researchers found that under rainy conditions, RRPMs had an average detection distance of more than 168 m (550 ft), or more than 61 m (200 ft) further than the next best pavement marking material investigated.(2) Before and after studies investigating the safety effects of RRPMs have shown mixed results. Analysis of crash data from six states showed that nonselective implementation of RRPMs on two-lane highways created no significant reduction or increase in nighttime crashes. However, when RRPMs were deployed based on nighttime crashes in wet conditions in New York, the data showed a nearly 24 percent reduction in crashes of this type. The researchers also found a reduction in wet-night crashes on freeways with RRPM deployment.(31) 2.3.9 Driver AgeIn humans, aging causes several elements of the vision system to degrade, which ultimately reduces older driver visibility. Consequently, younger drivers do not need as much light as older drivers to see the same object on a roadway, and older drivers will require pavement markings to have higher retroreflectivity in order to see them as well as younger drivers. Because of this, several studies investigating minimum pavement marking retroreflectivity have based their recommendations on the needs of older drivers. Zwahlen and Schnell investigated the effects of aging on pavement marking visibility.(32) Two groups of participants were used: 10 older drivers with an average age of 68.3 years and 10 younger drivers with an average age of 23.2 years. The subjects performed runs along an old unused airport runway marked as a two-lane road with solid white edge lines and dashed yellow center lines. Subjects informed researchers in the vehicle with them when they saw the end of the pavement marking treatment. The data showed that driver age had a significant effect on the visibility of the pavement marking. Depending on whether low beams or high beams were used and on what pavement marking material was used, the increase in detection distance for the younger drivers over the older drivers ranged from 49.1 percent to 61.6 percent. In the Carlson et al. TTI study of pavement marking visibility under wet conditions, participants were divided according to age into a younger group (18–54 years old) and an older group (55 years and older). Overall, the average detection distance for older drivers was found to be 14 percent less than that for younger drivers. Additionally, drivers with high visual acuity had significantly higher average detection distances than those with lower visual acuity when a vehicle with low headlamp illumination output was used. It should be noted, however, that the difference was not significant in a vehicle with higher headlamp illumination output.(27) 2.3.10 Preview TimeA driver must be able to see pavement markings at a certain distance down the road in order to receive adequate information to safely guide the vehicle. This distance allows the driver adequate time to perceive, process, and react to the information that the pavement marking presents. Since the required distance increases as the speed of the vehicle increases, it is often expressed as a constant preview time. The FHWA conducted a 1988 study that recommended two separate preview times for adequate marking of a roadway. For long-range guidance preview time, 3 seconds was recommended, which makes the driving task much easier and allows the driver to make quick adjustments. For short-range extreme driving conditions, 2 seconds of preview time was recommended as the safe minimum acceptable limit, allowing enough time for the driver to perceive and react to the pavement marking in hazardous conditions, such as heavy rain or fog.(33) Driving simulator studies reported in COST 331, a European Union study tasked with recommending optimum pavement marking design, showed that the absolute minimum preview time required for safe driving is 1.8 seconds; otherwise, drivers will have trouble maintaining steady lane keeping. The authors emphasized that this was the bare minimum and that a higher value should be used, although they did not go as far as to recommend what that value should be.(34) 2.3.11 Summary of Key FactorsA summary of the key factors affecting pavement marking visibility identified above is presented in table 7. Other factors not addressed here are summarized in table 8. Table 7. Summary of key factors affecting pavement marking visibility.
Table 8. Other factors affecting pavement marking visibility.(35)
|
||||||||||||||||||||||||||||||||||||||||||||||||||||||||||||||||||||||||||||||||||||||||||||||||||||||||||||||||||||||||||||||||||||||||||||||||||||||||||||||||||||||||||||||||||||||||||||||||||||