U.S. Department of Transportation
Federal Highway Administration
1200 New Jersey Avenue, SE
Washington, DC 20590
202-366-4000
Federal Highway Administration Research and Technology
Coordinating, Developing, and Delivering Highway Transportation Innovations
 |
| This report is an archived publication and may contain dated technical, contact, and link information |
|
Publication Number: FHWA-HRT-08-034
Date: August 2008 |
|||||||||||||||||||||||||||||||||||||||||||||||||||||||||||||||||||||||||||||||||||||||||
Wildlife-Vehicle Collision Reduction Study: Report To CongressPDF Version (2.92 MB)
PDF files can be viewed with the Acrobat® Reader® Chapter 5. Mitigation Methods that Attempt to Influence Driver BehaviorThis broad category of WVC mitigation strategies includes those that attempt to help drivers avoid a WVC by changing their behavior. The specific mitigation measures reported on in this chapter, by broad category based on their intent, consist of the following categories:
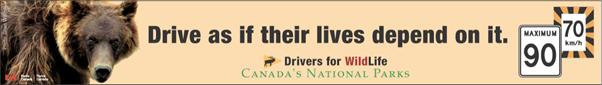
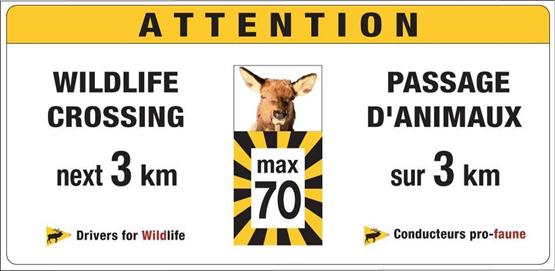
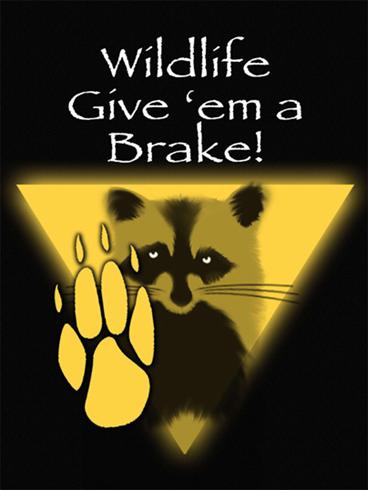
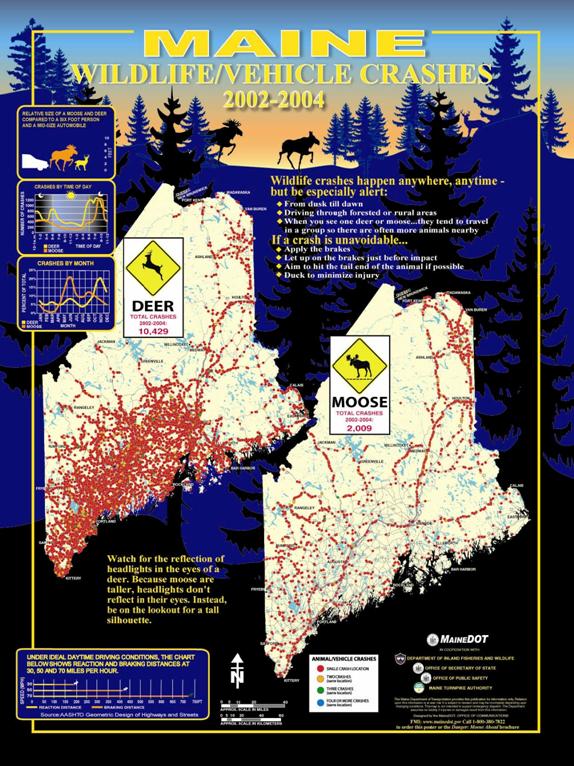
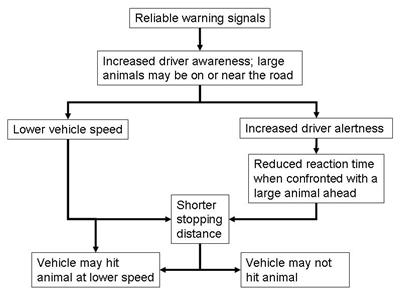
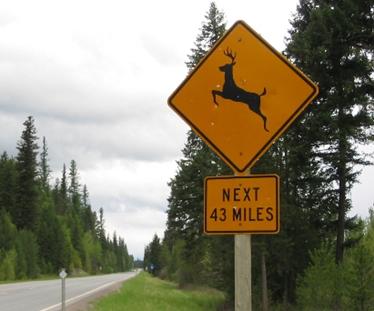
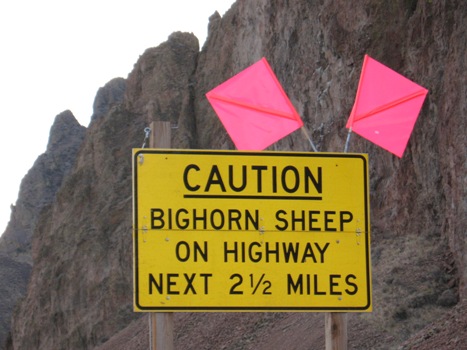
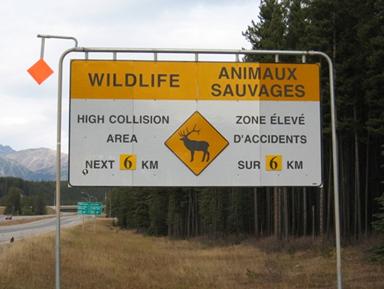
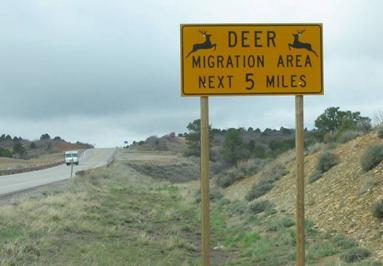
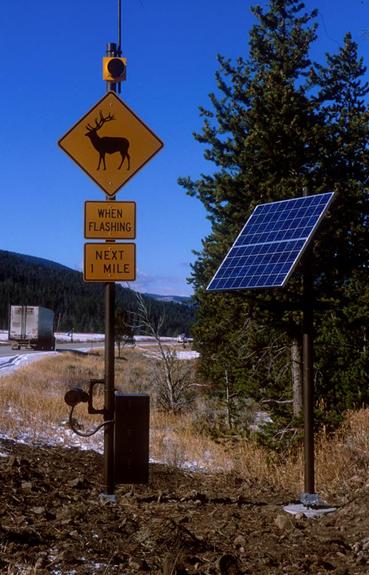
The mitigation measures presented in the report are what might be considered by planners as possible mitigation measures. FHWA is not recommending any of these measures by including them in this report. The majority of the mitigation measures presented have been used in practice or at least tried as a case study, the exceptions being in-vehicle roadside animal detection linked to on-board computer warning and reduction in traffic volume on the road network. Public Information and EducationIncreasing roadway safety via public information and driver education seeks to reduce death and serious injury on roadways by increasing motorists' awareness of the impacts, causes, and high-risk locations of WVCs, as well as to give drivers advice on the best actions to take to avoid crashes with animals. These WVC reduction efforts are implemented through general messages in the media, videos, brochures, posters, and bumper stickers. Often these activities work in concert with roadside messages at specific high-risk locations or in specific seasons of high wildlife migration or movement. Public information and driver education efforts are thought to work best when conducted in concert with other WVC reduction techniques.(172,173) The most common WVCs in the United States involve deer. DVC education and information efforts can be divided into two categories. In one category are efforts that provide information describing DVC significance, such as the local rates of DVCs or locations of roadway segments with high rates of DVCs. In the second category are efforts that provide information on DVC avoidance, namely, actions drivers can take to avoid wildlife if they appear on or near the roadway.(53) Many transportation professionals and researchers have discussed driver education and public information campaigns as a means to help reduce WVCs or have conducted research to incorporate their findings into motorist education efforts. (See references 29, 38, 70, 174, 175, and 176.) However, there are no known studies indicating the statistical effectiveness of driver education or public information/awareness efforts that have directly, by themselves, decreased the incidence rates of WVCs.(176) A national phone survey indicated driver respondents believe WVCs are a serious problem, and more than 97 percent believe driver education and media information to the general public would be helpful in reducing WVCs.(175) Respondents to a survey in Michigan (1,653 questionnaires) are receptive to receiving more information on what actions to take to reduce their probability of being involved in a WVC. They indicated newspapers as the preferred medium, although they also chose eight other avenues of receiving information.(177) In British Columbia a survey of 1,882 licensed drivers indicates respondents strongly (81 percent) believe wildlife warning signs reduce WVCs.(178) Public information and driver education, combined with other WVC reduction activities must work in concert to effectively reduce crashes and increase safety. Given a receptive audience for information, campaigns have great potential to tap into a public that seeks to more fully understand the dangers of WVCs, the actions drivers can take to avoid accidents, and the locations of high-risk roadways. Many states have developed safety campaigns to increase public awareness. For example, the Maine Department of Transportation's Safety Office has a public information campaign to increase awareness of WVCs. They have developed a video, brochures, and crash maps for moose and deer at: http://www.maine.gov/mdot/safetyoffice/maine-crash-data.php (accessed January 25, 2007). The Iowa Departments of Transportation, Public Safety, and Natural Resources in conjunction with insurance agencies and local law enforcement have developed the "Don't Veer for Deer" campaign. Public information maps, brochures, Public Service Announcements, and a poster can be found at http://www.dps.state.ia.us/commis/gtsb/deercrashes/index.shtml (accessed January 25, 2007). The "Colorado Wildlife on the Move" Campaign reached more than three million people through television, magazines, and other media and included 58,000 driver safety tip sheets and 500 posters distributed in welcome centers, national parks, and Enterprise Rent-A-Car offices in 85 cities and 175 locations.(179) As a result of a local outreach campaign in Montana, survey respondents who had heard or seen information on WVCs increased from 21 to 33 percent.(173) Case Studies and Contacts Two relevant case studies relating to public information and education are the "Drivers for Wildlife" program in Jasper National Park and the program to reduce bird collisions at the NASA Kennedy Space Center. The Parks Canada Drivers for Wildlife program in Jasper National Park combines public education, which includes bumper stickers (see figure 28) and roadway billboards (see figure 29, with two digital signs that record speed and advise drivers to slow down in the high-risk wildlife zone. The number of road-killed animals along park highways decreased by about 15 percent after the first 10 months of the public education and roadside sign program; however, the signs were given the most credit for the reduction of WVCs.(172) Figure 28. Photo. Example of bumper sticker for a driver awareness campaign to reduce WVCs in Jasper National Park, Canada (copyright: Parks Canada). For information about Jasper National Park's campaign, contact Brenda Shepherd, Park Ecologist, Jasper National Park, (780) 852-6232, brenda.shepherd@pc.gc.ca . In July of 2005, the space shuttle Discovery hit a vulture during take-off. Initially NASA formed an "Avian Abatement Team" to address this safety issue. The program has been expanded to include prevention of roadkill (which attracts the birds) in concert with the Merritt Island National Wildlife Refuge, which is a 140,000-acre overlay of the Kennedy Space Center. The refuge provides a buffer zone for NASA. Figure 29. Photo. Roadside billboard along highway in Jasper National Park, Canada (copyright: Parks Canada). The Kennedy Space Center has developed a Web site with a video, materials, posters (see figure 30), stickers and updates on the latest roadkill statistics at: http://environmental.ksc.nasa.gov/projects/roadkill.htm (accessed January 25, 2007). The Web site includes a link to the FHWA's Critter Crossings Web site at: https://www.fhwa.dot.gov/environment/wildlifecrossings/index.htm (accessed January 25, 2007). Figure 30. Photo. Poster created by NASA's John F. Kennedy Space Center as part of its RoadKill Prevention Program (copyright: NASA). Direct Benefits The Iowa Department of Transportation's Don't Veer for Deer campaign appears to be demonstrating benefits. Since implementation of this program the number of fatalities resulting from deer-car collisions dropped 60 percent in 2005, from 10 in 2003 to 4 in 2005, according to their Web site ( http://www.dps.state.ia.us/commis/pib/Releases/2006/10-05-2006_Deer.htm ).(180) The long-term effect requires further study. The reduction in severity (i.e., number of fatalities) is a positive benefit, but no campaigns identified the direct level of correlation between public information and driver education efforts and the reduction of WVCs. Figure 31. Photo. Poster produced by the Maine Department of Transportation (copyright: Maine Department of Transportation). Indirect Benefits Many driver education and public information campaigns summarize and display crash data maps related to WVCs. This spatial information can also be used for focusing limited resources to roadside mitigation methods for the most problematic areas within a state, county, or metropolitan area. Undesirable Effects No undesirable effects were identified in the literature review. Costs For statewide public information campaigns, costs were low compared to other mitigation methods. Maine has spent about $6,500 for its moose and deer crash maps and moose safety brochures. This investment provided an adequate outreach supply to last for about three years (Duane Brunell, Maine Department of Transportation, personal communication). In Colorado, the "Wildlife on the Move" Campaign cost $16,335. Most expenses were in two categories: (1) printing of publications (a little more than $10,000) and (2) contract labor for outreach (a little more than $4,500) (Monique DiGiorgio, Southern Rockies Ecosystem Project, personal communication). Costs for the Don't Veer for Deer campaign in Iowa were negligible (Michael Pawlovich, Iowa Department of Transportation, personal comment). Guidelines Given that drivers are open to receiving more educational information to help reduce WVCs, it may be most cost effective to focus driver education and public information efforts toward 18- to 45-year-olds, as they are involved in the highest numbers of AVCs (see figure 32). In a study in Kent County, MI, registered drivers between the ages of 30 and 39 had the highest number of DVCs.(181) If public campaigns or local education programs can be focused for specific age groups, 30- to 45-year-olds should be targeted. Note that figure 32 also suggests that drivers do not benefit from driving experience where AVCs are concerned. Campaigns directed at younger drivers, who have higher AVC crash rates, may also be studied. Figure 32. Graph. Driver age distribution for all crashes and AVCs (HSIS data). Roadway Warning SignsRoadway wildlife warning signs are perhaps the most commonly applied WVC mitigation measure.(85,182) The signs alert the drivers to the potential presence of wildlife on or near the road and urge them to be more alert, to reduce the speed of their vehicle, or a combination of both. These signs attempt to prevent a collision or to reduce the severity of a collision if one does occur by lowering vehicle speeds at impact (figure 33). Since the effectiveness of warning signs depends on driver response, it is critical that warning signs are reliable (i.e., the driver is warned when there is a high chance of WVC). The warning signs discussed below (standard warning signs, large or enhanced warning signs, seasonal wildlife warning signs, and animal detection systems) should be placed in road sections that exceed a certain minimum risk of WVC. The current location selection process can typically be improved upon.(53,183,184) Seasonal wildlife warning signs need to be in place during those periods of the year that animals cross the road most frequently. Animal detection systems (if used) need to be connected to reliable sensors used for the detection of large animals on or near the road. Figure 33. Flow chart. Warning signs and driver response. Driver awareness and response are influenced by the type of warning sign.(185,186,187) Large and graphic signs, flags attached to wildlife warning signs, permanently flashing lights on top of or around wildlife warning signs, and messages displayed on variable message signs are designed to attract the attention of the driver and invoke response to a greater extent than standard wildlife warning signs. Seasonal wildlife warning signs are designed to deliver a more time specific warning message to drivers; they are only displayed during certain times of the year when the risk is much higher, for example during the seasonal migration of certain species. Animal detection systems are even more time specific in their operation; the warning signals are only activated after a large animal has been detected on or near the road. Driver response is split into two components: increased alertness and lower vehicle speed. Increased alertness can lead to a reduction in driver reaction time. Driver reaction time to an unusual and unexpected event can be reduced from 1.5 s to 0.7 s if drivers are warned.(188) Assuming a constant vehicle speed of 88 km/h (55 mi/h) before and after warning signals have been presented to a driver, increased driver alertness could reduce the stopping distance of the vehicle by 21 m (68 ft). This reduction in reaction time and stopping distance, however, has not been specifically tested with respect to the presence of large animals in rural areas, let alone for warning signals that may apply to road sections of many miles rather than a point or short road section. Lower vehicle speed allows for more reaction time, and should a collision still happen, it is likely to be less severe.(189) At relatively high speed even small reductions in vehicle speed matter because the relation between vehicle speed and the risk of a severe accident is exponential; small reductions in vehicle speed result in a disproportionate decrease in the risk of a severe accident.(189) Standard Wildlife Warning SignsThe standard deer warning sign in the United States is a diamond-shaped panel with a black deer symbol on a yellow background, sometimes accompanied by text signs that indicate the length of the road section to which the sign applies (figure 34). Figure 34. Photo. Standard deer warning sign along Montana Highway 83 (copyright: Marcel Huijser, WTI). Meyer investigated the effectiveness of standard deer warning signs in Kansas by comparing the accident data before and after sign installation.(190) After taking all available accident data before sign installation and other road and landscape parameters into consideration, there was no evidence that the presence of the deer warning signs had resulted in fewer DVCs.(190) Rogers also concluded that the number of DVCs had not reduced as the result of the installation of deer warning signs.(38) Furthermore, the installation of standard camel crossing signs in Saudi Arabia did not result in reduced vehicle speed.(191) Finally, in a driving simulator study, a standard deer warning sign resulted in an average vehicle speed of 123.2 km/h (76.6 mi/h), just over the posted speed limit of 120.7 km/h (75 mi/h).(192) This result shows that a standard deer warning sign was unable to reduce the average vehicle speed to the posted speed limit or lower. Case Studies and ContactsFor information about the study on the effectiveness of deer warning signs in Kansas, contact: Eric Meyer, University of Kansas, Civil, Environmental & Architectural Engineering Department, 1530 West 15th Street, Room 2150, Lawrence, KS 66045-7609 (he is currently affiliated with Meyer Intelligent Transportation Services, (785) 843-2718, emeyer@insighthawks.com ). Direct BenefitsBased on the available data, standard deer warning signs are concluded to be ineffective in reducing WVCs, in general, and DVCs, in specific. Most authors doubt the effectiveness of standard warning signs, but only two studies were found that had investigated the effectiveness, confirming the existing doubts. (See references 9, 38, 58, 182, 185, 190, and 193.) Indirect BenefitsNo indirect benefits were identified in the literature review. Undesirable EffectsAs a general rule, unnecessary signs should be removed as they may distract drivers and require maintenance. However, standard warning signs may be required to reduce liability in case of WVCs.(194) CostsOne study estimated costs at $94 (note not adjusted for inflation) per sign.(185) USA Traffic Signs reports the following costs: $55 (61 by 61 cm (24 by 24 inches)), $62 (76 by 76 cm (30 by 30 inches)), $85 (91 by 91 cm (36 by 36 inches)).(195) GuidelinesTheManual on Uniform Traffic Control Devices(MUTCD) provides guidance on animal warning signs. The standard warning sign (figure 34) is known as W11-3. The MUTCD is very specific in the sign dimensions, colors, etc. However, the manual only provides general guidance on when to use these signs: "Nonvehicular signs [this includes animal warning signs] may be used to alert road users in advance of locations where unexpected entries into the roadway or shared use of the roadway by pedestrians, animals, and other crossing activities might occur."(196) See Knapp and Yi for a discussion on guidelines for the installation of standard deer warning signs.(183) Large, NonStandard Wildlife Warning SignsLarge or enhanced animal warning signs may take many forms. They can be larger than the standard wildlife warning signs, include graphic images of a vehicle hitting wildlife, and have permanently activated flashing amber warning lights, light emitting diodes (LEDs), or red flags attached to the signs (figure 35 and figure 36). Figure 35. Photo. Large enhanced warning sign for bighorn sheep along State Highway 75 in Idaho (copyright: Marcel Huijser, WTI). Lighted animated deer crossing signs reduced vehicle speed by 4.8 km/h (3.0 mi/h) compared to the same signs when they were turned off.(185) The presence of deer carcasses as a "supplement" to the signs resulted in a much greater reduction in vehicle speed: 12.6 km/h (7.9 mi/h) (lights turned off) and 10.0 km/h (6.2 mi/h) (lights turned on).(185) Despite the successful speed reduction of the lighted animated signs, they did not result in a reduction of DVCs.(185) Hammond and Wade conducted an experiment in a driving simulator and exposed drivers to standard deer warning signs and enhanced deer warning signs that had a flashing light on top of a standard deer warning sign.(187) The average vehicle speed with standard deer warning signs was 99.6 km/h (61.87 mi/h) (SD = 5.16). The enhanced sign with the lights turned off resulted in similar speeds of 99.5 km/h (61.80 mi/h) (SD = 4.80), but the enhanced sign with the lights turned on resulted in significantly lower vehicle speed of 95.9 km/h (59.55 mi/h) (SD = 4.66), a reduction of 3.7 km/h (2.32 mi/h).(187) Figure 36. Photo. Large enhanced elk warning sign along the Trans-Canada Highway in Banff National Park, Canada (copyright: Marcel Huijser, WTI). Enhanced camel warning signs in Saudi Arabia resulted in a significant reduction of vehicle speed whereas standard camel warning signs did not.(191) The standard warning signs were triangular where all sides were 110 cm (43 inches), with a red border and white interior with black camel silhouette, and did not have diamond reflective material. The enhanced signs were signs that were larger than the standard warning signs, had diamond reflective material, had a yellow camel on a black background, and/or were accompanied by the text message "camel-crossing" and a reduced advisory speed limit. The enhanced signs reduced vehicle speed by 3–7 km/h (2–4 mi/h).(191) Hardy and others found that wildlife advisory messages posted on permanent and portable dynamic message signs (DMS) can reduce vehicle speeds.(173) The greatest effect occurred during "dark" conditions, when the number of AVCs is higher. Stanley and others conducted experiments with a driving simulator and found that enhanced wildlife warning signs resulted in lower vehicle speeds and earlier braking when drivers were confronted with a deer in the simulated environment.(192) Case Studies and ContactsFor information about a driving simulator study with enhanced deer warning signs, contact Curtis Hammond and Michael G. Wade, University of Minnesota, Division of Kinesiology, 1900 University Ave SE, Minneapolis, MN 55455; (612) 625-2051, chammond@umn.edu; (612) 626-2094, mwade@umn.edu . For more information about a field test with enhanced camel warning signs in Saudi Arabia, contact Ali Al-Ghamdi and Saad AlGadhi, Civil Engineering Department, College of Engineering, King Saud University, P.O. Box 800, Riyadh 11421, Saudi Arabia, +966-1-4677019, (fax +966-1-4673366), asghamdi@ksu.edu.sa . For information about wildlife advisory messages posted on permanent and portable DMS, contact Amanda Hardy, Western Transportation Institute, (406) 994-2322, ahardy@coe.montana.edu . For information about a driving simulator study with enhanced deer warning signs, contact Laura Stanley, Virginia Polytechnic Institute & State University, Blacksburg, VA 24060, (540) 808-5140, lstanley@vtti.vt.edu . Direct BenefitsThe only study identified that directly looked at sign impact on WVCs, rather than the impact on driver response, suggests that large or enhanced wildlife warning signs are not effective in reducing WVCs in general or DVCs specifically.(185) Nonetheless, the observed reduction in vehicle speed (3–7 km/h (2–4 mi/h)) suggests that the signs may be somewhat effective after all, perhaps reducing the severity of the crash in terms of property damage, human injuries and human fatalities. Only limited data are available on this subject. Indirect BenefitsNo indirect benefits were identified in the literature review. Undesirable EffectsUniform warning signs across the United States are desirable so that drivers learn and understand what different signs represent (known as "driver expectancy"). While nonstandard signs may draw attention, a potential downside is that it takes drivers longer to interpret the sign, simply because it is nonstandard. CostsOne cost estimate reported in the literature was $2,000 (note: not adjusted for inflation) per sign.(185) GuidelinesIt should be noted that many nonstandard animal warning signs deviate from the MUTCD. Although some states have adopted alternative signs into their state manual on traffic control, care should be taken when the MUTCD is not followed exactly. It may degrade driver expectancy and could open the State DOT to liability issues. See Knapp and Yi for a discussion of guidelines for the installation of nonstandard deer warning signs.(183) Seasonal Wildlife Warning SignsSeasonal wildlife warning signs are only present at certain times of the year when animals cross the road most frequently, such as during a seasonal migration (figure 37). Figure 37. Photo. Seasonal deer migration sign in Utah (copyright: Marcel Huijser). Sullivan and others erected temporary warning signs with (1) reflective flags and (2) permanently flashing amber lights in locations that were known to be used by mule deer (Odocoileus hemionus) during their seasonal migration.(43) The number of DVCs was reduced by 51 percent (range 41.5–58.6 percent for individual test areas) compared to control areas. The signs reduced the percentage of speeders from 19 percent to 8 percent during their first season of operation, but the effect was less pronounced in the second season, perhaps due to driver habituation.(43) Rogers investigated the effect of enhanced deer warning signs (black on yellow sign showing a deer and a car symbol, combined with a black on orange sign stating "HIGH CRASH AREA") on the number of DVCs.(38) The signs were deployed between October and January (the peak of DVCs) for three consecutive years. Rogers found no effect of the seasonal signs on the number of DVCs.(38) Case Studies and ContactsFor information about a field study on the effectiveness of seasonal warning signs in Utah, Nevada and Idaho, contact Todd L. Sullivan, Jack H. Berry Institute, Department of Forest, Range and Wildlife Sciences, Utah State University, Logan, UT. (Current address: USDA/APHIS Wildlife Services, 5107 Austin Ellipse, Moody Air Force Base, GA 31699). Direct BenefitsSeasonal deer warning signs may reduce DVCs; however, more studies on their effectiveness are required. Indirect BenefitsNo indirect benefits were identified in the literature review. Undesirable EffectsThe signs reportedly are subject to vandalism and theft.(43) CostsSullivan and others reported a cost of $268 per 1,609 m ($435 per mi).(43) GuidelinesSee Knapp and Yi for a discussion of guidelines for the installation of seasonal deer warning signs.(183) Animal Detection SystemsAnimal detection systems use sensors to detect large animals that approach the road. Once a large animal is detected, warning signals are activated to inform the drivers that a large animal may be on or near the road at that time (figure 38). The warning signals are extremely time specific. Huijser and others listed more than 30 locations in North America and Europe that have had an animal detection system installed, and they describe the experiences with installation, operation and maintenance, reliability, and effectiveness.(197) Since August 2007, a number of additional locations were equipped with an animal detection system, including along SR 260 near Payson, AZ (David Bryson, Electrobraid Fence Ltd., personal communication; Norris Dodd, Arizona Game and Fish Department, personal communication). An animal detection system combined with electric fencing was used at these locations. Figure 38. Photo. Animal detection system along Highway 191 in Yellowstone National Park, MT (copyright: Marcel Huijser, WTI). Two broad categories are commonly used in animal detection systems: area-cover systems and break-the-beam systems. Area-cover systems detect large animals within a certain range of a sensor. Area-cover systems can be passive or active. Passive systems detect animals by only receiving signals. The two most common systems are passive infrared and video detection. These systems require algorithms that distinguish between, e.g., moving vehicles with warm engines and moving pockets of hot air and movements of large animals. Active systems send a signal over an area and measure its reflection. The primary active area-cover system is microwave radar. Break-the-beam sensors detect large animals when their body blocks or reduces a beam of infrared, laser, or microwave radio signals sent by a transmitter to a receiver. Other less common detection systems include a system that depends on radio-collared animals and receivers placed in the right of way, and a system that uses seismic sensors to detect vibrations in the soil as large animals approach.(197) Most of these systems have or had problems with the reliability of the sensors, although some of the manufacturers seem to have overcome these problems.(197) The effectiveness of animal detection systems has been investigated with regard to a potential reduction in vehicle speed and a potential reduction in AVCs. Once a driver is aware that a large animal may be on or near the road ahead, the driver may lower the speed of the vehicle. Previous studies have shown variable results: substantial decreases in vehicle speed (greater than or equal to 5 km/h (3.1 mi/h)), minor decreases in vehicle speed (less than 5 km/h (3.1 mi/h)), and no decrease or even an increase in vehicle speed. (See references 42, 187, 198, 199, 200, and 201.) This variability of the results appears to be related to various conditions, namely, type of warning signal and signs, whether the warning signs are accompanied with advisory or mandatory speed limit reductions, road and weather conditions, whether the driver is a local resident, and perhaps also cultural differences that may cause drivers to respond differently to warning signals in different regions.(197) Kistler, Romer and Mosler-Berger, and Mosler-Berger and Romer have reported on the number of AVCs before and after seven infrared area-cover detection systems were installed in Switzerland (table 8). (See references 198, 202, 203, and 204.) These systems reduced the number of AVCs by 82 percent on average (1-sided Wilcoxon matched-pairs signed-ranks test, P= 0.008,n= 7).(197) All seven sites showed a reduction in collisions after an animal detection system was installed, and three of the seven sites did not have a single collision after system installation (as of 6–7 years after installation). The data relate to collisions with roe deer (Capreolus capreolus) and red deer (Cervus elaphus), and collisions that occurred during the day when the systems were not active were excluded from the analyses. While the data on the effectiveness of animal detection systems are encouraging, animal detection systems should still be regarded as an experimental mitigation measure rather than a measure that will reduce WVCs on short term with a high degree of certainty.(197)
Case Studies and ContactsFor a general overview of technology, reliability and effectiveness, contact Marcel Huijser, Western Transportation Institute, P.O. Box 174250, Bozeman, MT 59717-4250, (406) 543-2377, mhuijser@coe.montana.edu . For information about a field study on the effectiveness of animal detection systems, contact Christa Mosler-Berger, Wildtier Schweiz, Strickhofstrasse 39, 8057 Zürich, Switzerland, wild@wild.unizh.ch . For more information about the animal detection system and wildlife fencing along State Route 260 in Arizona, contact Norris Dodd, Wildlife Research Biologist, Arizona Game and Fish Department, Research Branch, P.O. Box 2326, Pinetop, AZ 85935, (928) 368-5675, doddnbenda@cybertails.com . Manufacturer: Terry Wilson, Sensor Technologies and Systems, Inc., 8900 East Chaparral Road Scottsdale, AZ 85250, (480) 483-1997, (fax (480) 483-2011), terry_wilson@sensor-tech.com , http://www.sensor-tech.com/ (accessed January 25, 2007). Manufacturer: Calonder Energy AG's representative in USA: Willy Bärchtold, Swiss Army Vehicles, 1436 Van Asche Drive, Fayetteville, AR 72704, (479) 521-0056, cars@sav.ms . Direct BenefitsThe only available data on the effectiveness of animal detection systems show a reduction in collisions with large animals of 82 percent.(197) This percentage may change as more data become available. Indirect BenefitsAnimal detection systems do not restrict animal movements when deployed over long distances. Undesirable EffectsAnimal detection systems can reduce collisions with large animals, but the presence of poles and equipment in the right of way is a potential hazard to vehicles that run off the road.(197) CostsEstimated costs of these systems are $40,000–96,000 per km ($65,000–154,000 per mi) (excluding installation costs) (unpublished data, Marcel Huijser, Western Transportation Institute, Montana State University).(197) The costs for the equipment will be higher if the road section concerned has curves or slopes, or if the line of sight in the right of way is blocked by objects. GuidelinesIt should be noted that many animal detection systems use signs that deviate from the MUTCD. Some states have adopted alternative signs into their state manual on traffic control. Care should be taken when the MUTCD is not followed exactly. It may degrade driver expectancy and could open the State DOT to liability issues. See Huijser and others for considerations for planning and design.(197) In-Vehicle Warnings: Roadside Animal Detection System Linked to On-Board Computer Warning SystemThe concept of an animal detection system that is linked to an on-board computer warning system is described in Huijser and others.(197) The technology would be designed to warn a driver through a warning signal inside the vehicle that an animal is on or near the roadway within a certain distance from the vehicle. This technology is not currently deployed. This information should be provided just before drivers get to the area covered by the animal detection system. Road signs and highway advisory radio messages are the most obvious ways to deliver this information to the driver. When approaching the animal detection system, a driver may be confronted with an activated warning signal indicating that a large animal has been detected and is present on or near the road at that time. In the future the information about the purpose and the location of the animal detection system may also be delivered to an on-board computer inside the vehicle. This procedure would require a two-way GPS-based communication system. The most essential part of the concept is that the warning signal from the animal detection system is delivered to the on-board computer as soon as the vehicle gets within a certain radius of the animal detection system and if a large animal has been detected. Case Studies and ContactsNo case studies and contacts are available, as this technology has not yet been deployed. Direct BenefitsThis mitigation measure has not been specifically investigated. However, the effectiveness can be expected to be similar to that of animal detection systems, i.e., 82 percent reduction in collisions with large animals.(197) This percentage is likely to change as data become available. Indirect BenefitsAnimal detection systems do not restrict animal movements when deployed over long distances. Undesirable EffectsAnimal detection systems can reduce collisions with large animals, but the presence of poles and equipment in the right of way is a potential hazard to vehicles that run off the road.(197) CostsEstimated costs for these systems are $40,000–96,000 per km ($65,000–154,000 per mi) (excluding installation costs), plus additional costs for the on-board computer and communication system (Marcel Huijser, unpublished data, Western Transportation Institute, Montana State University).(197) The costs for the equipment will be higher if the road section concerned has curves or slopes, or if the line of sight in the right of way is blocked by objects. GuidelinesSee Huijser and others for considerations for planning and design.(197) In-Vehicle Warnings: On-Board Animal DetectorsOn-board animal detectors (typically infrared detectors) inform drivers when a large animal (or human being) is detected within a certain range from the sensors attached to the vehicle. (See references 205, 206, 207, and 208.) The range should be sufficient to allow for the driver to stop the vehicle before impacting the detected animal. The system could potentially detect large animals anywhere; it would not depend on the installation of any roadside equipment. However, it is uncertain whether these on-board detectors are still in production. Case Studies and ContactsFor design concept, contact Masaki Hirota, Nissan Motor Co., Ltd., 1 Natsushima-cho, Yokosuka Kanagawa 237-8523, Japan, m-hirota@mail.nissan.co.jp . Direct BenefitsBecause this concept is still in the design phase, no direct benefits were identified in the literature review. However, the benefits would be expected to be similar to animal detection systems. Indirect BenefitsThe system would not only detect large animals but potentially also humans (e.g., pedestrians, bicyclists). Undesirable EffectsVehicle-based systems only inform drivers in vehicles equipped with such a detection system. Drivers in other vehicles will not benefit. CostsA reported cost for these detectors is $2,250 per vehicle.(53) GuidelinesSee Hirota and others for design concept.(207) Increase Visibility of Animals to DriversA driver's ability to avoid a collision with an animal may be determined in a split second. Once drivers see a road hazard, it may take 0.7 to 1.5 s (depending on whether the hazard was anticipated or unexpected) to move their foot from the accelerator to the brake.(188) Depending on vehicle speed and when an animal crossing the road is first seen, a collision may occur before the driver even has the chance to brake. The sooner drivers see an animal in the road, the better their chances of responding quickly to avoid a collision. Roadway lighting and vegetation removal have been used in an attempt to increase visibility to provide as much time and space possible for drivers to see and respond to animals in or near the roadway. Increase Visibility of Animals to Drivers: Roadway LightingMost WVCs occur between dusk and dawn when light, and thus visibility, is limited (see Section on Causes and Factors of WVCs: Temporal Distributions). (See references 9, 10, 38, 75, 78, 79, 209, 210, and 211.) The drab coloring of most wildlife species increases the probability that a driver may not see an animal in the dark. Even the most attentive driver would have difficulty seeing a dark-colored moose on a dark road at night in time to avoid a collision. Garrett and Conway characterized moose-vehicle collision occurrences in Anchorage, AK, finding these incidents were 2.6 times more likely to occur during periods of darkness; further, 61 percent of collisions that occurred during dark periods occurred where there were no streetlights illuminating the road.(79) Lavsund and Sandegren found the risk of moose-vehicle collisions in Sweden was six times higher during hours of darkness compared to daylight conditions.(76) It has been hypothesized but not well documented that lighting may help drivers see animals and avoid such collisions in nondaylight hours. Numerous reviews of WVC mitigation measures mention use of roadway lighting in attempts to reduce WVCs. (See references 3, 9, 68, 74, 176, 212, 213, 214, 215, and 216.) Most of these reviews either do not provide support that highway lighting is effective or conclude that highway lighting is ineffective. Reed and Woodard found that highway lighting was not effective in reducing DVCs in Colorado.(217) L-P Tardiff and Associates, Inc. cited a study by Miller indicating that lighting was ineffective for mitigating WVCs (no further information was provided and the report was unavailable at the time that this review was drafted).(68,218) Alternatively, one review states, "Lighting has been used on numerous occasions and has been shown to be effective in high crash locations because it gives drivers a longer reaction time" but does not cite any specific studies to support that claim.(215) Knapp classifies the use of roadway lighting as a method that is "not generally used and rarely studied for safety impacts" and cites that the American Association of State Highway Transportation Officials regard this measure as "experimental."(176) Despite discrepancies in the tested effectiveness of highway lighting, the practice of using highway lighting has been recommended in certain situations. Garrett and Conway recommend the installation of streetlights, encouraging drivers to upgrade older vehicles' headlights with halogen bulbs, and keeping the lenses of the lights free of dirt and debris to increase the chance of seeing a moose in time to avoid a collision.(79) Thomas also suggests that roadway lighting be considered for reducing moose-vehicle collisions in Alaska.(78) Given the paucity of information on the efficacy of lighting to reduce WVCs, there is a need to further explore the usefulness of this approach. If recommendations to install lighting are pursued, quantitative studies with experimental designs should be employed to further understand the effect that lighting and increased visibility may have on WVCs. Reed and Woodard conducted a five-year study in Colorado that involved alternately turning roadside lights on and off for one-week periods to quantify the effect on DVCs, observed deer crossings of the highway at night, and vehicle speeds.(217) Lighting did not affect DVCs or driver speeds; however, drivers did significantly reduce speeds when a deer decoy was present (this practice was discontinued due to concerns about abrupt driver responses to the decoy, creating a potential safety concern for other motorists). Lighting did not disrupt deer crossing behaviors, although it appeared that a greater proportion of deer crossed in the lighted areas compared to prior to the study and when the lights were off. A four-year study of the installation of roadway lighting, fencing, one-way gates and bridge modifications along 11.5 km (7.1 mi) of the Glenn Highway near Anchorage, AK, revealed a 70 percent decrease in moose-vehicle collisions overall.(213,219,220) The entire area was lighted, while about 5.5 km (3.4 mi) of the road had fencing, one-way gates, and modified bridges. The lighted area with fences reduced moose-vehicle collisions by 95 percent, while the areas with lighting but without fencing reduced moose-vehicle collisions by 65 percent. However, it was not clear if the 65 percent reduction in moose collisions was the result of moose avoiding the lighted areas or the result of increased motorist visibility.(213,219,220) Case Studies and ContactsFor information about roadway lighting and fencing to reduce WVCs, contact Biota Research and Consulting, Inc., info@biotaresearch.com . Direct BenefitsReduction of moose-vehicle collisions by 65 percent was found in Alaska, but it is not clear if this was due to increased visibility or moose avoiding the lighted area. Indirect BenefitsGriffith found that highway lighting reduced all "property damage only" (i.e., no human injury) crashes at night.(221) The typical method for comparisons for before/after installation is a reduction in the ratio of nighttime crash rates to daytime crash rates. Griffith found this ratio reduced by 32 percent for all property damage only crashes. However there was no reduction in injury or fatal crashes. Undesirable EffectsAn undesirable effect of roadway lighting is the impact on a driver's vision after leaving the lighted area. While driving through the lighted area, a driver's eyes will become accustomed to the light. Afterward, it may take some time before the driver's eyes readjust to less light. Some sensitive species (e.g., Canada lynx, mountain lions (Felis concolor), bears, and gray wolves (Canis lupus) may avoid light, which may result in an unintentional barrier effect for lighted areas.(222) In addition, roadway lighting may temporarily blind certain species as their eyes are adapted to darkness, potentially increasing their vulnerability to traffic.(212) CostsMode and others noted that in 2001, $1.3 million was dedicated to lighting three miles of the Glenn Highway in Alaska to improve motorist visibility of moose.(223) Hedlund and others state that roadway lighting is expensive but did not provide any figures to illustrate the estimated expense.(214) L-P Tardiff and Associates, Inc. mention Miller's report, which states that highway lighting is expensive, but again, no figures accompanied that statement.(68,218) GuidelinesFor guidelines on highway lighting, refer to theRoadway Lighting Handbookand Addendum.(224,225) Increase Visibility of Animals to Drivers: Vegetation RemovalVisibility may be improved by reducing roadside vegetation that may obscure wildlife approaching the road. In a study of DVC mortalities in east central South Dakota, Gleason and Jenks found that deer were killed more often than expected in areas adjacent to shelterbelts with canopy vegetation.(226) Puglisi and others found that DVC occurrences were less common where wooded areas were more than 23 m (25 yds) away from a highway in Pennsylvania.(32) Clearing vegetation from roadsides resulted in a 20-percent reduction in moose-vehicle collisions in Sweden.(76) In a study examining the effect of scent marking, intercept feeding and forest clearing, analyses demonstrated that forest clearing resulted in a 49-percent reduction in collisions.(227) While it is recognized that the results may not translate to a highway setting, the clearing of vegetation across a 20- to 30-m (70- to -100-ft) swath on each side of a Norwegian railway reduced moose-train collisions by 56 percent (+/-16 percent).(228) Thomas states that vegetation clearing is one of the most commonly applied measures to reduce moose-vehicle collisions; recommendations from that report include that vegetation clearing should be applied in an effort to reduce moose-vehicle collisions in Alaska.(78) Distance between the roadway and forest cover has been shown to be negatively correlated to DVCs in Illinois; recommendations from that study included removing vegetation to provide an open width of the road corridor of at least 40 m (131 ft) in areas where DVCs are particularly high.(30) Based on results from predictive models, Seiler notes that moose-vehicle collisions in Sweden were more common on roads that cross through clear cuts and young forests and suggests collisions with moose may be reduced by 15 percent in areas where the distance between forest cover and the road exceeds 100 m (300 ft).(25) In addition to affecting visibility, roadside vegetation management may be directed to reducing the attractiveness of roadside forage to animals. While vegetation management to increase visibility and reduce the draw of animals to the right of way may be complementary goals in some cases, Putman and others summarize the potentially conflicting outcomes of reducing vegetation along roadways: "The management of roadside vegetation—and specifically, the clearance of woodland or scrub from a margin at the road edge—may have benefits both in increasing driver awareness of deer at the roadside, and increasing visibility of oncoming traffic to the deer themselves. In addition, removal of such vegetation and the cover that it provides may also reduce the probability of deer approaching so close to the road edge in the first place. The method and timing of removal of such vegetation may however be critical. While the removal of vegetation within transportation corridors may help improve driver and animal visibility, simple cutting of encroaching shrub and tree growth may at the same time increase the subsequent attractiveness of these cut-over areas as foraging sites by deer. Such measures might thus actually result in an increase in the number of deer utilizing the roadside—ultimately increasing the risk of accident."(58) For further discussion of vegetation issues, see also the section titled "Influence Species Composition or Minimize Nutritional Value of Vegetation in Right of Way" in chapter 6. Case Studies and ContactsNo contacts for this mitigation measure were identified in the literature review. Direct BenefitsJaren et al. and others conducted an eight-year study of the effect of vegetation removal on moose-train collisions in Norway and found that clearing vegetation across a 20- to 30-m (70- to 100-ft) swath on each side of the railway reduced moose-train collisions by 56 percent (+/-16 percent).(228) Lavsund and Sandegren showed that clearing of vegetation along transportation corridors resulted in a 20-percent reduction in moose-vehicle collisions in Sweden.(76) Indirect BenefitsReducing the number of large trees near roads may result in fewer collisions with these stationary obstructions.(214) Undesirable EffectsRemoval of brushy species of vegetation or canopy may result in fresh growth of attractive forage that draws grazing animals to the right of way, potentially counteracting the potential safety gains of better visibility with increased probability of drivers encountering wildlife.(74) CostsVegetation removal requires long-term maintenance commitment and may involve expenses to acquire right of way in order to manage vegetation as desired. Jaren and others calculated that if collisions are reduced by at least 50 percent as a result of removing vegetation, then the costs of vegetation removal treatment would be economically beneficial if applied in areas where more than 0.3 per km (0.48 per mi) moose-train collisions occur.(228) Andreassen and others estimate forest clearing for 18 km (11.2 mi) costs $500 per km ($800 per mi) or $9,000 per year, showing that the number of moose saved using this technique could result in a profit of $1,080.(227) Andreassen and others state that forest clearing may be more economical compared to scent marking and supplemental feeding, stating that the initial cutting is the main expense.(227) GuidelinesThomas provides a summary of a variety of vegetation clearing methods used in Alaska including hydroaxing, hand clearing, steam clearing, and spray inhibitors.(78) The timing and effect of vegetation clearing depends on the vegetation and climate at the roadway site and needs to be carefully evaluated. Increase Visibility of Animals to Drivers: Wider StripingDrivers may see a break in the painted highway striping (particularly if it is wide) when an animal crosses it, even if the animal itself is difficult to distinguish due to color, background, or lighting conditions, and thus be warned of its presence on the highway. In addition, wide striping may make the driver perceive a narrower roadway, potentially resulting in lower vehicle speed (see later section on traffic calming and reducing design speed). Wide striping was used along Rt. 4 in Phillips, ME, and along Rt. 6/15 in Shirley, ME.(229) The Rt. 6/15 road section in Shirley also had temporary optical markers (TOMs) installed. TOMs are small yellow reflective tags which are typically used as a substitute for striping during roadway construction activities. When a large animal, e.g., a moose, enters the roadway, the absence of light reflecting off the TOMs obstructed by the animal may result in a visual break for drivers, and thus a warning.(229) No evaluation or results of these installations were found. Case Studies and ContactsContacts for the case studies mentioned above could not be identified. Direct BenefitsNo direct benefits were identified in the literature review. Indirect BenefitsNo indirect benefits were identified in the literature review. Undesirable EffectsNo undesirable effects were identified in the literature review. CostsNo costs were identified in the literature review. GuidelinesNo guidelines were identified in the literature review. Increase Visibility of Animals to Drivers: Reflective Collars for AnimalsOne of the mitigation measures under consideration at a location in Canada is to put collars with reflective tape on a number of animals to increase their visibility to drivers. Free ranging wood bison (Bos bison) were reintroduced in northeast British Columbia. Their number has grown to about 100 individuals. The bison spend about 90 percent of their time on or near a 150-km (31-mi)-long section of the Alaska Highway near the Yukon border because of the attractive vegetation in the right of way and because the disturbance associated with the right of way may provide a shelter from predators. They are typically found in large groups, and a number of serious bison-vehicle collisions have taken place. Case Studies and ContactsFor information about the proposal to put collars with reflective tape on bison, contact Conrad Thiessen, Wildlife Biologist, Peace Region, Ministry of Environment, 400-10003 110 Ave., Fort St. John, British Columbia, V1J 6M7 Canada, phone: (250) 787-3287, fax: (250) 787-3490, Conrad.Thiessen@gov.bc.ca Direct BenefitsNo direct benefits were identified in the literature review. Indirect BenefitsNo indirect benefits were identified in the literature review. Undesirable EffectsIt requires considerable and continuous effort to have a certain minimum number of bison (or any other species, including deer) equipped with collars with reflective tape. In addition, capturing and handling activities are likely to cause stress and risk of injury and death for the animals involved. CostsNo costs were identified in the literature review. GuidelinesNo guidelines were identified in the literature review. Increase Visibility of Animals to Drivers: Reduce Height of SnowbanksGarrett and Conway suggested reducing the height of snow berms in order to increase drivers' visibility of moose on the side of the road.(79) They acknowledge this practice would be impractical and expensive to employ on all streets, and thus this might be better applied in particular areas with high rates of moose-vehicle collisions. Case Studies and ContactsNo contacts were identified in the literature review. Direct BenefitsNo direct benefits were identified in the literature review. Indirect BenefitsNo indirect benefits were identified in the literature review. Undesirable EffectsNo undesirable effects were identified in the literature review. CostsNo costs were identified in the literature review. GuidelinesNo guidelines were identified in the literature review. Reduce Traffic Volume on Road NetworkThe increase in the number of WVCs (chapter 2) is associated with factors such as new highway construction, increased traffic volumes and speeds, wildlife population distribution, and wildlife abundance.(58,230) As mentioned in chapter 2 in the section titled "Is the Problem Growing," the average crash rate (number of crashes per vehicle mile traveled) has held fairly constant for WVCs; but the total number of VMT and thus the total WVCs have increased. The relationship between the number of WVCs and traffic volume on a single roadway, however, is confounded by changes or differences in wildlife population size and relatively great data variability.(74) No original studies were located that tested the effectiveness of permanently lowering traffic volume on highways or permanently lowering road density of paved roads as a mitigation measure for reducing WVCs. Literature reviews by Danielson and Hubbard, D'Angelo and others, Putman and others, and Knapp did not address this potential mitigation measure on either the local or landscape scale. (See references 58, 61, 176, and 231.) Some modeling efforts found a relationship between traffic volume and WVCs and suggest reduced traffic volumes as a potential solution to WVCs.(17,19,20) The modeling effort only identified a relationship between roads with a certain traffic volume and the presence of WVCs; it did not prove a causal relationship. Jaarsma and Willems for example, suggest implementing traffic calming on the more minor rural roads in order to shift the traffic onto a few major highways.(20) A similar number of studies found that higher volumes on roadways reduced the number of WVCs (see section in chapter 2 on traffic density and speed). As presented in a later section on "Undesired Effects," lower densities may actually increase crash rates. Citing road mortality as one of the reasons, Friends of the Earth is campaigning for a 10-percent reduction in overall road traffic levels in the UK by 2010, as compared to 1990 levels.(232) However, it is unclear how to feasibly achieve this reduction. Case Studies and ContactsReducing traffic volume has not been attempted directly as a mitigation measure for reducing WVCs. However, Catharinus Jaarsma has done extensive modeling on possible impacts (see description in previous paragraphs): Catharinus Jaarsma, Land Use Planning Chair, Wageningen University, the Netherlands. Direct BenefitsSome modeling studies suggest reduced traffic volumes will result in decreased WVCs, although other studies found the opposite result. The relationship between road mortality, traffic volume and animal density, and mobility warrants further study.(22) Indirect BenefitsNumerous indirect benefits can be suggested such as reduced energy demand, reduced pollution, etc. However, one should keep in mind the more holistic picture. For example, traffic calming measures may shift traffic to more major highways, but this would actually require drivers to travel further to get where they are going, ultimately increasing fuel use and emissions. Undesirable EffectsLower traffic volumes do not necessarily equate with fewer roadkills.(20) As noted above, this method may actually increase the number of WVCs. Additionally, limiting traffic on a roadway may have adverse economic impacts. CostsNo costs were identified in the literature review. GuidelinesNo guidelines were identified in the literature review. Temporary Road ClosuresDuring periods of high animal movement, roads could be temporarily closed. Several temporary closures have been implemented for the reduction of WVCs. Some low-volume paved roads are closed seasonally during the night. In Delaware Water Gap National Recreation Area, the River Road is closed annually during the night (6 p.m. to 6 a.m.) in March and April when there is a forecast calling for rain with temperatures greater than 10 ºC (50 ºF). This allows multiple amphibian species to cross the road during their seasonal migration.(233,234) In the Shawnee National Forest, the LaRue Road at the base of the bluffs adjacent to LaRue Swamp is closed day and night from March 15 to May 15 and September 1 to October 30 to allow amphibians and reptiles, including several snake species, to conduct their seasonal migration.(235) In East Brunswick, NJ, the Beekman Road is closed several nights in the spring to allow spotted salamanders to cross the road during their seasonal migration.(236) Case Studies and ContactsFor information on road closure in the LaRue-Pine Hills in the Shawnee National Forest, contact: Mississippi Bluffs Ranger District, 521 North Main Street, Jonesboro, IL 62952, (618) 833-8576. Direct BenefitsAlthough the magnitude of impacts on WVCs has not been documented in the literature, it is clear that while a road is closed to traffic, there will be no WVCs. Indirect BenefitsLike the previous section, numerous indirect benefits can be suggested such as reduced energy demand, reduced pollution, etc. (assuming that drivers do not just take an alternative route). Undesirable EffectsClosing roads may have adverse economic impacts and accessibility issues. Road closures may require people to reroute, actually requiring drivers to travel further to their destination, ultimately increasing fuel use and emissions. CostsNo costs were identified in the literature review. GuidelinesNo guidelines were identified in the literature review. Reduce Vehicle SpeedFor areas with high WVC frequency, reducing vehicle speed is occasionally suggested as a mitigation strategy. Before discussing the methods and implications of this strategy, it is important to understand the different types of speeds associated with the design and operation of a highway:
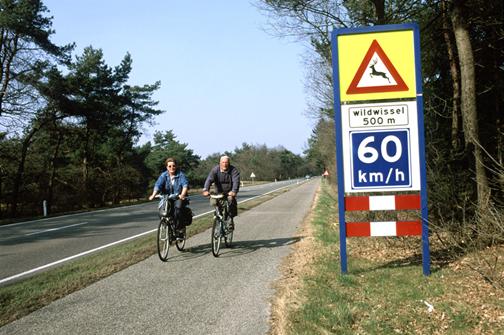
Figure 39. Photo. Advisory speed sign in The Netherlands located at a gap in exclusionary wildlife fencing (copyright: Marcel Huijser). Under typical circumstances, the design speed, operating speed, and posted speed should be almost equal for a given roadway. With this in mind, there are effectively three ways to reduce vehicle speed: (1) reduce the posted speed, (2) reduce the design speed through traffic calming or redesign, and (3) post an advisory speed. Reduce Vehicle Speed by Reducing the Posted Speed LimitThis mitigation entails reducing the posted speed. The ability to do this depends on who owns the roadway (state, county, city), as well as the legislation and guidelines governing those agencies. Once approval for the reduced speed is obtained, this mitigation is implemented by replacing the existing speed limit signs. One location where posted vehicle speeds were reduced to mitigate WVCs is in Jasper National Park in Alberta, Canada, on the Yellowhead Highway. This roadway is a rural two-lane highway in a national park, with 3.7-m (12-ft) lane widths, and 3-m (10-ft) shoulders.(237) Passing sight distance exists for most of the length. Passing sight distance is defined as "determined on the basis of the length needed to complete normal passing maneuvers in which the passing driver can determine that there are no potentially conflicting vehicles ahead before beginning the maneuver."(1) Prior to the mitigation, the speed limit for the roadway was 90 km/h (56 mi/h). Traffic in 1998 was 1.2 million vehicles per year with a high percentage of trucks, buses, and recreational vehicles. The area includes grizzly bear, white-tailed deer, mule deer, bighorn sheep, and elk. In 1991, the speed limit was reduced from 90 km/h (56 mi/h) to 70 km/h (43 mi/h) on three sections of the road; 2.5, 4, and 9 km (1.5, 2.5, and 5.6 mi) in length. Bertwistle reported that on average, 5,475 speeding tickets are issued each year (although he was not specific as to if these were in the 70 km/h (43 mi/h) zones or on the highway as a whole). Even with the speed limits and enforcement, a speed study in 1995 at two of the speed reduction locations showed that less than 20 percent of the vehicles obeyed the 70 km/h (43 mi/h) speed limit. Bertwistle reported that bighorn sheep collisions actually increased in the reduced speed zones and decreased in the control areas (the 90 km/h (56 mi/h) areas). Elk collisions were monitored at one reduced speed location and both the control and the reduced speed zones had increases in elk vehicle collisions. Bertwistle stated that there was a relationship between reducing the posted speed and the frequency of elk-vehicle collisions; however, the data presented in the paper appear to be inconclusive. A report by Biota Research and Consulting, Inc. summarizes WVCs in the Jackson, WY area.(213) On a particular 1.4-km (0.9-mile) stretch of highway, the authors suggest highway lighting as a solution, because even with the posted speed limit reduced to 56 km/h (35 mi/h), drivers continue to strike and kill deer. The report does not state whether or not there was a decrease in WVCs from the posted speed limit reduction. Often reduced speed zones are tied to other mitigation methods. A variable speed limit is associated with an animal detection system in Switzerland. (This system is described in the section on Animal Detection Systems earlier in this chapter.) Advisory speeds have also been used in conjunction with gaps in exclusionary fencing in The Netherlands, as previously mentioned (figure 39). Case Studies and ContactsFor further information on the reduced speed limits in Jasper National Park, contact Jim Bertwistle, Warden, Jasper National Park, Alberta, Canada, (403) 852-6155. GuidelinesIf reduced speed zones are implemented, the following design considerations are recommended:
Direct BenefitsThe effect of reducing vehicle speed on WVCs is unclear. However, for all crashes, reducing vehicle speeds will generally reduce the frequency of severe crashes (i.e., human injury or fatality).(238) Indirect BenefitsIndirect benefits cited in the literature include
Undesirable EffectsExtreme caution should be taken in reducing the posted speed limit excessively below the operating speed. Such a reduction can set up a situation where motorists are encouraged to break the law and leads to speed dispersion (the spread of vehicle speeds). Instead of a tight distribution of speeds for vehicles on the road, there tends to be two speed groups: one group of vehicles will travel at the posted speed limit and another will travel at the operating speed. It has been shown that speed dispersion increases crash rates even if average speeds decrease. Solomon and Cerrelli found that vehicles traveling close to the average speed had the lowest crash involvement rates.(240,241) Crash involvement rate not only increased for faster vehicles, but also for slower vehicles. Garber and Gadiraju found a similar U-shaped relationship, where the further the posted speed was from the design speed, the higher the crash rate for the roadway.(242) Speed dispersion is particularly an issue on two-lane rural roads (where WVCs occur most often), because it increases the number of vehicles passing in unsafe situations. CostsCosts include the following:
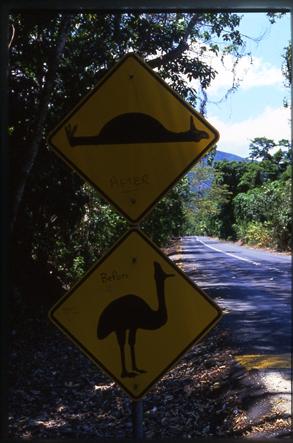
Reduce Vehicle Speed By Traffic Calming/Reducing Design SpeedReducing the design speed of a road may be more effective in reducing vehicle speed than reducing the posted speed limit. A lower design speed typically relates to sharper horizontal and vertical curves, narrow lane widths, narrow or no shoulders, and narrow clear zones (i.e., obstructions such as trees closer to the roadway). In addition to the basic highway geometrics, there are numerous traffic calming methods used to slow vehicles down. These are typically used in residential neighborhoods or on a highway approaching a town, and rarely on major highways where most WVCs occur. Traffic calming treatments include speed bumps/humps, traffic circles, curb extensions, sidewalk extensions, raised medians, and rumble strips. Gunther and others showed that in Yellowstone National Park, roads with higher posted speed limits had higher WVC occurrences.(243) His primary evidence is shown in 1 mi/h = 1.61 km/h figure 40, where an 88 km/h ( 55 mi/h) roadway has significantly higher roadkill per mile than roadways with lower posted speed limits. Notice, however, that WVC frequencies do not increase until 88 km/h (55 mi/h) speed limit. The 88 km/h ( 55 mi/h) road (U.S. 191) used by Gunther in this analysis is not an interior roadway and experiences much higher traffic over the year than the other roads considered. Gunther did show that internal roadways that were reconstructed with higher design speeds did see an increase in roadkill. 1 mi/h = 1.61 km/h Figure 40. Graph. Roadkill by posted speed limit in Yellowstone.(243) Below are three examples of traffic calming applications for wildlife: One example is shown in figure 41 where speed bumps are used to reduce vehicle speed for Cassowaries (Casuarius casuarius), a large bird species in Queensland, Australia. The top sign originally displayed a warning for a speed bump, but was vandalized with a black marker to look like a dead bird. Figure 41. Photo. Speed bumps used to reduce WVCs in Australia (copyright: Marcel Huijser). (Please disregard graffiti on signs.) A second example is the installation of four "slow points" on a road in Tasmania that experienced a dramatic increase in collisions with eastern quolls (Dasyurus viverrinus) and Tasmanian devils (Sarcophilus laniarius) after the road section in a national park was widened and sealed and modal speed increased by 20 km/h (12.4 mi/h).(244) In addition, after the initial widening the population size of the two species declined substantially and the eastern quoll population became extinct. The slow points consisted of concrete barriers with a " Give Way" sign that constricted traffic to a single lane in the center of the road in or close to locations that had a concentration of roadkill.(244) The tight curves and the merging of traffic forced vehicles to slow down. After the installation of the slow points, the median vehicle speed in the center of the road section dropped by about 20 km/h (12.3 mi/h) (17–35 percent reduction), while vehicle speed at the outer two slow points close to the park boundary and wildlife zone boundary was only reduced by 1–7 percent. In addition, road mortality became more sporadic; the eastern quoll population became reestablished and was at 50 percent of its size before the road was widened and sealed two years after the installation of the slow points.(244) Furthermore, there was some indication that Tasmanian devil population was recovering as well. A third example is the installation of (1) rumble strip patches along a road in south Florida in combination with (2) a black-on-yellow warning sign that reads "PANTHER CROSSING NEXT X MI" that has (3) a permanently activated flashing amber light installed on top of the warning sign. These mitigation measures are designed to increase driver alertness and to reduce vehicle speed to reduce collisions with the Florida panther. Case Studies and ContactsAlthough this mitigation has not been implemented directly, Kerry Gunther has done extensive modeling on potential impacts of design speed reductions: Kerry Gunther, Bear Management Office, Yellowstone National Park, kerry_gunther@nps.gov . For more information on the slow points installed in Tasmania, contact Menna Jones, Department of Zoology, University of Tasmania, GPO Box 252-5, Hobart, Tas. 7001, Australia, E-mail: Menna.Jones@utas.edu.au . Direct BenefitsDirect benefits of this measure in reducing WVCs are inconclusive. Indirect BenefitsLower speeds may reduce the number of fatal crashes and improve the overall safety of the roadway. Undesirable EffectsCertain traffic calming measures have maintenance issues with snow removal. Also, the economic impacts of longer travel times should be considered. CostsNo costs were identified in the literature review. GuidelinesFor further information on typical traffic calming measures and design guidelines, refer to the FHWA/ITE report on "Traffic Calming: State of the Practice" available at: http://www.ite.org/traffic/tcstate.htm (accessed January 25, 2007). Reduce Vehicle Speed by Posting Advisory Speed SignsAdvisory speeds are typically only used in conjunction with other mitigation methods (primarily roadway warning signs). The results of those implementations are not revisited here, as they are discussed in other sections. Wildlife Crossing GuardsIn some cases, individuals will direct traffic in areas where animals cross the roadway. This situation often occurs in national parks where mini-traffic jams (referred to as "animal jams") occur as vehicles stop on the highway to view wildlife. In some cases, this traffic control is conducted by park staff. In other situations, it may be the work of volunteers. For example, a story inUSA Todayon September 24, 2006, by Mick Cochran told of the volunteer group calling itself the Bugle Corps in Rocky Mountain National Park that manages traffic along the park's roads during the Rocky Mountain elk (Cervus elaphus nelsoni) rutting (breeding) season.(245) Case Studies and ContactsMost local technical assistance program (LTAP) centers offer flagger training and certification. Contact information for LTAP centers is located at: http://www.ltap.org/ (accessed January 25, 2007). Direct BenefitsNo direct benefits were identified in the literature review. Indirect BenefitsWhen vehicles stop to view wildlife, it creates an unsafe situation with vehicles weaving around the stopped vehicles and pedestrians walking along roadways. This mitigation measure may reduce vehicle-vehicle and vehicle-pedestrian collisions. Undesirable EffectsStaff or volunteers that manage traffic are exposed to potential injury from inattentive motorists. CostsCosts include training costs and the cost of the time spent by the individuals managing traffic. Costs of safety vests and stop/yield paddles (mandatory) are minimal. GuidelinesVolunteers or staff should be trained in traffic control. Note that the application of this mitigation measure is typically in national parks or other protected areas where wildlife may be habituated to people, traffic, and roads. In addition, the measure is typically only deployed when traffic volume is relatively high and when staff or volunteers are available. |
|||||||||||||||||||||||||||||||||||||||||||||||||||||||||||||||||||||||||||||||||||||||||