U.S. Department of Transportation
Federal Highway Administration
1200 New Jersey Avenue, SE
Washington, DC 20590
202-366-4000
Federal Highway Administration Research and Technology
Coordinating, Developing, and Delivering Highway Transportation Innovations
 |
| This report is an archived publication and may contain dated technical, contact, and link information |
|
Publication Number: FHWA-HRT-08-051
Date: June 2008 |
Surrogate Safety Assessment Model and Validation: Final ReportPDF Version (3.39 MB)
PDF files can be viewed with the Acrobat® Reader® Chapter 2. SSAM SoftwareThis chapter provides a brief overview of the SSAM software, developed to automate the process of identifying conflicts and calculating surrogate safety measures. [3] The software overview is organized into the following sections:
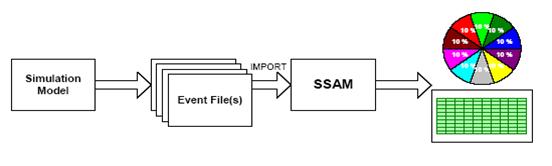
The SSAM software and corresponding user manual are available upon request from the Federal Highway Administration (FHWA). [4] SSAM WorkflowThis section provides an overview of the typical workflow of using the SSAM software, tracing the flow of information through various input data, tasks or operations, and resulting outputs. In doing so, many of the screens of SSAMs graphic user interface (GUI) are introduced. SSAM operates by processing data describing the trajectories of vehicles driving through a traffic facility (e.g., a signalized intersection) and identifying conflicts. The vehicle trajectory input data for SSAM are generated by traffic simulation software in a trajectory file format (where files are labeled with a .trj file extension), specially designed for SSAM. SSAM calculates surrogate measures of safety corresponding to each vehicle-to-vehicle interaction and determines whether or not each interaction satisfies the criteria to be deemed an official conflict. A table of all identified conflicts and their corresponding surrogate safety measures is then presented to the user. Figure 1 illustrates the workflow for using SSAM.
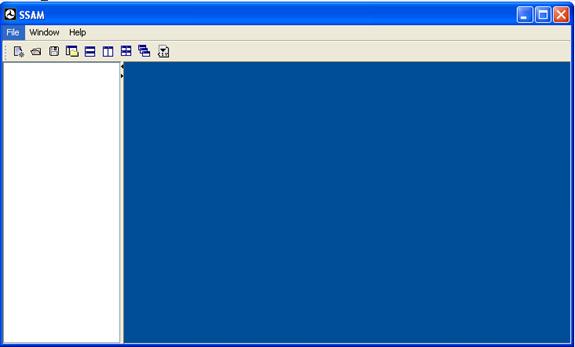
Figure 1. Illustration. SSAM Operational Concept. The traffic engineer begins the analysis by first enabling output of vehicle interaction (or trajectory) data in the simulation model of his or her choice. The traffic engineer then runs the simulation model for a number of iterations (replications with alternate random number seeds) to obtain a statistically sufficient set of simulation output data. The traffic engineer then launches the stand-alone SSAM application. The user interface of SSAM is shown in figure 2.
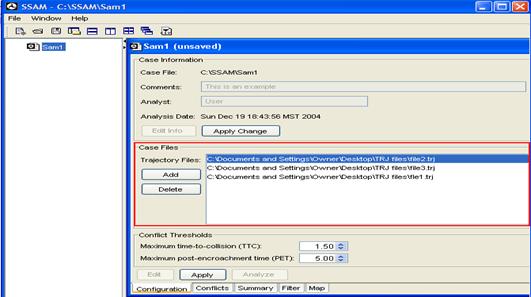
Figure 2. Screen Capture. SSAM User Interface after Launching. The user begins by defining a new conflict analysis case by using the Menus to create a new case file (or alternatively to open an existing case file). The user interface provides a tree-view listing of all existing case documents in the left-hand pane of the display, as shown in figure 3 (with a single existing case document). One or more case documents may be viewed in the workspace in the right-hand pane. Figure 3 shows a case document where various views of its corresponding input and output data are organized in a multi-tabbed format. In particular, the Configuration tab (or panel), shown in figure 3, allows the user to browse the file system and select one or more trajectory files to be processed for the current case. The software uses two threshold values for surrogate measures of safety to delineate which vehicle-to-vehicle interactions are classified as conflicts. These two thresholds are applied to the value of
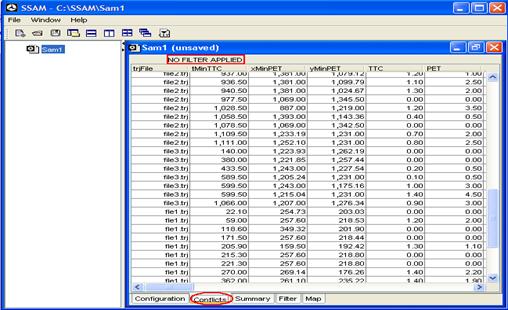
The software provides default threshold values for these measures, which the analyst may optionally override with his or her preferred alternate values. SSAM utilizes a default TTC value of 1.5 seconds, as suggested in previous research.(10, 11) Use of a PET threshold is attributed to research by Hyden.(12) Once the conflict identification thresholds are determined, the user presses the Analyze button, and simulation (trajectory) data are processed to identify vehicle-to-vehicle interactions which satisfy the conflict classification criteria. Each conflict identified during analysis (including data from the trajectory files of all corresponding replications of the simulation) is listed in a table (the conflict table) under the Conflicts tab, which is shown in the right-hand pane in figure 4. The conflict table shows all conflict details, including the time, location, and all surrogate measures of safety for that conflict.
Figure 3. Screen Capture. SSAM User Interface with Case File Defined.
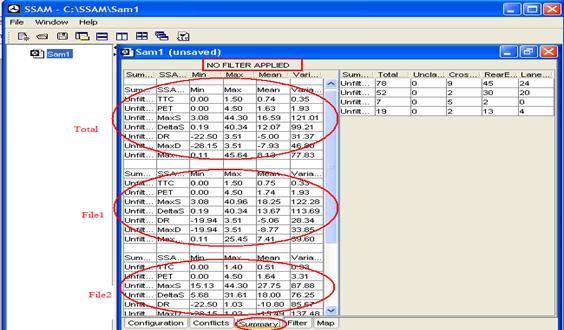
Figure 4. Screen Capture. SSAM User Interface with Conflicts Tab Selected. SSAM also provides a Summary screen for each case, as shown in figure 5. Users click the summary tab to switch from the conflict table to a view of summary statistics. Summary statistics include the number of different conflict types for each simulation replication, as well as the average and total values over all replications. Additionally, average values of each proposed surrogate measure are presented in the summary.
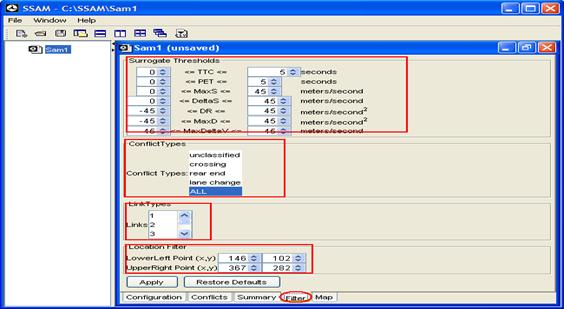
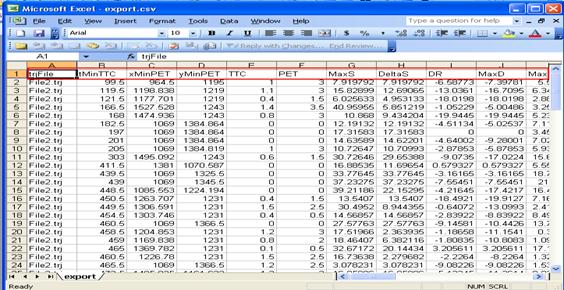
Figure 5. Screen Capture. SSAM User Interface with Summary Tab Selected. SSAM also includes a Filter tool, shown in figure 6, which can be accessed via the Filter tab of the case display. By configuring filter parameters, the user can effectively instruct the software, Show me all rear-end conflict events where the speed differential was greater than 40.25 km/h (25 mi/h) occurring in lane 5 of link 12. Once the filter is applied, only those conflicts satisfying the filter criteria appear in the conflict table, and the summary statistics are recomputed for this subset of the conflicts. SSAM also supports analysis and report generation by providing copy and paste features so that data from the filtered conflict table may be transferred to a spreadsheet application such as Microsoft Excel®. Alternatively, the table can be exported (i.e., saved to a file) in comma separated values (CSV) format, which is a universal format that can be imported into other applications for statistical analysis, charting, and report generation. Figure 7 shows an exported CSV file as it appears when opened with the Microsoft Excel spreadsheet application.
Figure 6. Screen Capture. SSAM User Interface with Filter Tab Selected.
Figure 7. Screen Capture. CSV File from SSAM. In addition, the SSAM software also features two additional screens which also appear as tabs on the user-interface. These additional screens are a Map panel and a t-test panel. The Map panel allows a user to display a map or image of the underlying roadway network and overlay conflicts on that map. The map display can be exported to an image file to facilitate report generation. In additional, the t-test panel can be used to calculate statistical property of the conflict data to facilitate comparisons. More information about SSAM is available in a corresponding user manual. CONFLICT IDENTIFICATION ALGORITHMSThis section summarizes the algorithms used by SSAM to identify conflicts from the vehicle trajectory files (TRJ files) to be processed. This can be a computationally intensive task depending on the size of the TRJ file, which is a function of the number of vehicles in the network model and the amount of time simulated. A high-end computer might require more than 10 minutes to process data from 5 hours of traffic for a single intersection model. Large multi-intersection networks might require hours of processing time. The following steps summarize the technique to identify conflicts: Step 1Determine the dimensions of the analysis area based on the header name in the TRJ file. These dimensions define the width and height of a rectangular analysis area and indicate if trajectory data are provided in English or metric units. SSAM constructs a zone grid to cover the entire rectangular analysis area, as shown in figure 8. Individual square zones cover 15.25-m by 15.25-m (50-ft by 50-ft) areas depending on the units specified in the TRJ file. By dividing the region into these zones, the number of vehicle-to-vehicle comparisons necessary to identify potential conflicts is reduced considerably.
Figure 8. Illustration. Illustration of Zone Grid. Step 2Analyze a single time step of a trajectory file. For each vehicle in the analysis region, SSAM projects that vehicles expected location as a function of its current speed, if it were to continue traveling along its (future) path for up to the duration of the configured time-to-collision (TTC) value. A vehicles projected path is based on a look ahead over the next 10 seconds of trajectory data. The path, as shown in figure 9, is a set of straight line segments (labeled S) connecting the vehicles future downstream locations (labeled X). The threshold TTC value is configured by the user of SSAM, typically with a threshold value of order of 1.5 seconds. Conflicts with TTC values larger than 1.5 seconds are not generally considered in the safety community to be severe enough events for recording in a traditional field conflict study.
Figure 9. Illustration. Illustration of Vehicle Path. The process of projecting the distance that a vehicle may progress forward during the specified look-ahead time interval and the calculation of the exact coordinates of that projected vehicle position occurs as follows, assuming SSAM is going to analyze the conflicts for vehicle A at time t1. First, SSAM extracts all data related with vehicle A from the trajectory file, such as vehicle As location, speed, acceleration, etc., at time t1 and several time steps after t1. Each location is denoted as (x1,y1), (x2,y2), etc. Then SSAM projects vehicle As distance forward along its trajectory defined by those locations:
Figure 10. Illustration. DIS 1 and DIS 2.
Figure 11. Illustration. Updated DIS 1 and DIS 2 when Old DIS 1 > DIS 2.
Figure 12. Illustration. Projection Point when DIS 1 < DIS 2. Step 3For each vehicle, calculate the rectangular perimeter delineating the location and orientation of that vehicle at its projected future position. Overlay that rectangle on the zone grid, calculating which (rectangular) zones in the grid will contain at least some portion of that vehicle. For each zone the vehicle will occupy, add the vehicle to that zone, or rather, add that vehicle to a list of occupants maintained for each zone. Any time a vehicle is added into a zone that currently contains one or more other vehicles, check for overlap of the new vehicle (rectangle) with each of the other vehicles (rectangles) in that zone. It is possible that two vehicles may partially occupy the same zone without overlapping. However, two overlapping rectangles indicate that a future collision is projected for this pair of vehicles, and therefore, a potential conflict has been identified, as portrayed in figure 13. SSAM maintains a list of all conflicting vehicle-pairs (all conflict events) for the current time-step. Each time-step, the list is prepopulated with all conflicting vehicle-pairs from the prior time-step. If the current vehicle being added to the zone grid overlaps with any other vehicle, that vehicle-pair is added to the conflict list for the current time-step (if not already in the list).
Figure 13. Illustration. Checking Conflict Between Two Vehicles at MaxTTC. Step 4Continue so that SSAM can perform more detailed processing of each conflicting vehicle-pair in the list for the current time-step as follows:
Figure 14. Illustration. Checking Conflict Between Two Vehicles at TTC = 1.3 (Vehicles No Longer in Conflict). TERMS AND DEFINITIONSSSAM computes and records the following data or measures for each conflict identified in the vehicle-trajectory input data. This information is provided in the Conflicts table on the Conflicts panel. It is possible to filter out several of the conflicts based on specified ranges of these values, using the Filter tool. This data may also be exported for use in other third-party processing software, such as Microsoft Excel®, where more complicated analysis options may be available. tMinTTC is the simulation time when the minimum TTC (time-to-collision) value for this conflict was observed. xMinPET is the x-coordinate specifying the approximate location of the conflict at the time when the minimum PET was observed. More specifically, this location corresponds to the center of the (first) vehicle where the subsequent arrival of the second vehicle to the same location was the shortest encroachment observed. yMinPET is the y-coordinate specifying the approximate location of the conflict at the time when the minimum PET was observed. More specifically, this location corresponds to the center of the (first) vehicle where the subsequent arrival of the second vehicle to the same location was the shortest encroachment observed. ConflictAngle is an approximate angle of hypothetical collision between conflicting vehicles based on the estimated heading of the each vehicle (see explanation of FirstHeading). The angle, expressed in the perspective of the first vehicle to arrive at the conflict point, conveys the direction from which the second vehicle is approaching the first vehicle. The angle ranges from -180° to +180°, where a negative angle indicates approach from the left and a positive angle indicates approach from the right. An angle of 180° (or -180°) indicates a direct head-on approach, and an angle of 0° (or -0°) indicates a direct rear approach, as illustrated in figure 15.
Figure 15. Illustration. Conflict Angle. ClockAngle is an alternative expression of the conflict angle in terms of more familiar clock-hand positions. Again, the angle is expressed in the perspective of the first vehicle, with the clock time indicating the angle from which the second vehicle is approaching. The 12:00 position is directly ahead of the first vehicle, 3:00 is to the right, 6:00 is directly behind, and 9:00 is to the left, as illustrated in figure 16.
Figure 16. Illustration. Clock Angle. PostCrashV is an estimate of the post collision velocity of both vehicles. This estimate assumes that the vehicles did crash at the estimated ConflictAngle, at velocities observed at the tMinTTC. It also assumes an inelastic collision between the center of mass of both vehicles, where both vehicles subsequently deflect in the same direction and at the same velocity. PostCrashHeading is the estimated heading of both vehicles following a hypothetical collision (as discussed in PostCrashV). This heading is expressed as the angle measured counterclockwise from the x-axis (which is assumed to point right), such that 0° is right, 90° is up, 180° is left, and 270° is down. The angle ranges from 0° to 360°. FirstVID (SecondVID) is the vehicle identification number of the first (second) vehicle. The first vehicle is the vehicle that arrives to the conflict point first. The second vehicle subsequently arrives to the same location. In rare cases (actually collisions), both vehicles arrive to a location simultaneously, in which case the tie between first and second vehicle in broken arbitrarily. FirstLink (SecondLink) is a number indicating which link the first (second) vehicle is traveling on at tMinTTC. FirstLane (SecondLane) is a number indicating in which lane the first (second) vehicle is traveling on at tMinTTC. FirstLength (SecondLength) is the length of the first (second) vehicle in feet or meters. FirstWidth (SecondWidth) is the width of the first (second) vehicle in feet or meters. FirstHeading (SecondHeading) is the heading of the first (second) vehicle during the conflict. This heading is approximated by the change in position from the start of the conflict to the end of the conflict. Note that in most non-rear-end conflicts, at least one vehicle is turning throughout the conflict. Its actually heading would vary accordingly throughout the conflict. If the vehicle does not move during the conflict, then the direction in which it is facing is taken as the heading. This heading is expressed as the angle measured counterclockwise from the x-axis (which is assumed to point right), such that 0° is right, 90° is up, 180° is left, and 270° is down. The angle ranges from 0° to 360°. FirstVMinTTC (SecondVMinTTC) is the velocity (speed) of the first (second) vehicle at tMinTTC. xFirstCSP (xSecondCSP) is the x-coordinate of the first (second) vehicle at the conflict starting point (CSP). The CSP is the location of the vehicle at tMinTTC. yFirstCSP (ySecondCSP) is the y-coordinate of the first (second) vehicle at the CSP. The CSP is the location of the vehicle at tMinTTC. xFirstCEP (xSecondCEP) is the x-coordinate of the first (second) vehicle at the conflict ending point (CEP). The CEP is the location of the vehicle at either the last time step where the TTC value is below the specified threshold or where the last post-encroachment value was observed, whichever occurs later in the conflict timeline. yFirstCEP (ySecondCEP) is the y-coordinate of the first (second) vehicle at the CEP. The CEP is the location of the vehicle at either the last time step where the TTC value is below the specified threshold or where the last post-encroachment value was observed, whichever occurs later in the conflict timeline. Definitions of Surrogate Measures Computed by SSAMTTC is the minimum time-to-collision value observed during the conflict. This estimate is based on the current location, speed, and future trajectory of two vehicles at a given instant. A TTC value is defined for each time step during the conflict event. A conflict event is concluded after the TTC value rises back above the critical threshold value. This value is recorded in seconds. PET is the minimum post-encroachment time observed during the conflict. Post-encroachment time is the time between when the first vehicle last occupied a position and the time when the second vehicle subsequently arrived to the same position. A value of zero indicates a collision. A post-encroachment time is associated with each time step during a conflict. A conflict event is concluded when the final PET value is recorded at the last location where a time-to-collision value was still below the critical threshold value. This value is recorded in seconds. MaxS is the maximum speed of either vehicle throughout the conflict (i.e., while the TTC is less than the specified threshold). This value is expressed in feet per second or meters per second, depending on the units specified in the corresponding trajectory file. DeltaS is the difference in vehicle speeds as observed at tMinTTC. More precisely, this value is mathematically defined as the magnitude of the difference in vehicle velocities (or trajectories), such that if v1 and v2 are the velocity vectors of the first and second vehicles respectively, then DeltaS = || v1 - v2 ||. For context, consider an example where both vehicles are traveling at the same speed, v. If they are traveling in the same direction, DeltaS = 0. If they have a perpendicular crossing path, DeltaS = (√2)v. If they are approaching each other head on, DeltaS = 2v. DR is the initial deceleration rate of the second vehicle, recorded as the instantaneous acceleration rate. If the vehicle brakes (i.e., reacts), this is the first negative acceleration value observed during the conflict. If the vehicle does not brake, this is the lowest acceleration value observed during the conflict. This value is expressed in feet per second or meters per second, depending on the units specified in the corresponding trajectory file. MaxD is the maximum deceleration of the second vehicle, recorded as the minimum instantaneous acceleration rate observed during the conflict. A negative value indicates deceleration (braking or release of gas pedal). A positive value indicates that the vehicle did not decelerate during the conflict. This value is expressed in feet per second or meters per second, depending on the units specified in the corresponding trajectory file. ConflictType describes whether the conflict is the result of a rear end, lane change, or crossing movement. If link and lane information is not available for both vehicles then the event type is classified based solely on the absolute value of the ConflictAngle as follows. The type is classified as a rear-end conflict if ||ConflictAngle|| < 30°, a crossing conflict if ||ConflictAngle|| > 85°, or otherwise a lane-changing conflict. However, the simulation model that produced the vehicle trajectory data can generally provide link and lane information for both vehiclesthough the coding of these values may vary significantly from one simulation vendor to the next. If link and lane information is available, that information is utilized for classification in the case that the vehicles both occupy the same lane (of the same link) at either the start or end of the conflict event. If the vehicles both occupy the same lane at the start and end of the event, then it is classified as a rear-end event. If either vehicle ends the conflict event in a different lane than it started (while having not changed links), then the event is classified as a lane-change. If either of the vehicles changes links over the course of the event, then the conflict angle determines the classification as previously described, with the following possible exception). For two vehicles that begin the conflict event in the same lane but change links over the course of the event, the classification logic considers only rear-end or lane-change types, based on the conflict angle (using the threshold value previously mentioned). Note that vehicle maneuvers such as changing lanes into an adjacent turn bay lane or entering into an intersection area may be consider changing links, depending on the underlying simulation model. In some cases, vehicles which appear to be traveling in the same lane may actually by considered by the simulation model as traveling on different links that happen to overlap. MaxDeltaV is the maximum DeltaV value of either vehicle in the conflict (see FirstDeltaV or SecondDeltaV for more information). FirstDeltaV (SecondDeltaV) is the change between conflict velocity (given by speed FirstVMinTTC and heading FirstHeading) and the postcollision velocity (given by speed PostCrashV and heading PostCrashHeading). This is a surrogate for the severity of the conflict, calculated assuming a hypothetical collision of the two vehicles in the conflict. |