U.S. Department of Transportation
Federal Highway Administration
1200 New Jersey Avenue, SE
Washington, DC 20590
202-366-4000
Federal Highway Administration Research and Technology
Coordinating, Developing, and Delivering Highway Transportation Innovations
 |
| This report is an archived publication and may contain dated technical, contact, and link information |
|
Publication Number: FHWA-HRT 09-031
Date: June 2009 |
|||||||||||||||||||||||||||||||||||||||||||||||||||||||||||||||||||||||||||||||||||||||||||||||||||||||||||||||||||||||||||||||||||||||||||||||||||||||||||||||||||||||||||||||||||||||||||||||||||||||||||||||||||||||||||||||||||||||||||||||||||||||||||||||||||||||||||||||||||||||||||||||||||||||||||||||||||||||||||||||||||||||||||||||||||||||||||||||||||||||||||||||||||||||||||||||||||||||||||||||||||||||||||||||||||||||||||||||||||||||||||||||||||||||||||||||||||||||||||||||||||||||||||||||||||||||||||||||||||||||||||||||||||||||||||||||||||||||||||||||||||||||||||||||||||||||||||||||||||||||||||||||||||||||||||||||||||||||||||||||||||||||||||||||||||||||||||||||||||||||||||||||||||||||||||||||||||||||||||||||||||||||||||||||||||||||||||||||||||||||||||||||||||||||||||||||||||||||||||||||||||||||||||||||||||||||||||||||||||||||||||||||||||||||||||||||||||||||||||||||||||||||||||||||||||||||||||||||||||||||||||||||||||||||||||||||||||||||||||||||||||||||||||||||||||||||||||||||||||||||
Safety Evaluation of Lane and Shoulder Width Combinations on Rural, Two-Lane, Undivided RoadsPDF Version (734 KB)
PDF files can be viewed with the Acrobat® Reader® FOREWORDThe goal of this research was to estimate the safety effectiveness of various lane and shoulder width combinations on rural, two-lane, undivided roads in the Evaluation of Low-Cost Safety Improvements Pooled Fund Study (ELCSI-PFS) Phase II. This evaluation intends to identify optimal lane and shoulder width combinations for fixed total paved widths as a countermeasure for roadway departure crashes. The safety effectiveness for lane and shoulder width combinations was determined by conducting a scientifically rigorous case-control evaluation of rural, two-lane, undivided roads in the United States. The ELCSI-PFS provides crash reduction factors and an economic analysis for the targeted safety strategies where possible. This safety improvement and all other targeted strategies in the ELCSI-PFS are identified as low-cost strategies in the National Cooperative Highway Research Program (NCHRP) 500 Series reports. Participating States in the ELCSI-PFS are Arizona, California, Connecticut, Florida, Georgia, Illinois, Indiana, Iowa, Kansas, Kentucky, Maryland, Massachusetts, Minnesota, Mississippi, Montana, New York, North Carolina, North Dakota, Oklahoma, Pennsylvania, South Carolina, South Dakota, Tennessee, Texas, Utah, and Virginia. Raymond A. Krammes Acting Director, Office of Safety Research and Development Notice This document is disseminated under the sponsorship of the
U.S. Department of Transportation in the interest of information exchange. The
U.S. Government assumes no liability for the use of the information contained in this document. The
U.S. Government does not endorse products or manufacturers. Trademarks or manufacturers' names appear in this report only because they are considered essential to the objective of the document. Quality Assurance Statement The Federal Highway Administration (FHWA) provides high-quality information to serve Government, industry, and the public in a manner that promotes public understanding. Standards and policies are used to ensure and maximize the quality, objectivity, utility, and integrity of its information. FHWA periodically reviews quality issues and adjusts its programs and processes to ensure continuous quality improvement. Technical Report Documentation Page
Form DOT F 1700.7 (8-72) Reproduction of completed pages authorized Metric Conversion ChartTABLE OF CONTENTS
LIST OF FIGURESFigure 1. Odds ratios for 7.32-m (24-ft) total paved width for various AADT levels LIST OF TABLESTable 1. Categories for Pennsylvania and Washington Table 2. Example tabulation of matched case-control studys Table 3. Sample size calculations Table 4. Four-Legged Intersections in North Carolina with only Major AADT Available Table 5. Washington rural, two-lane, undivided crash and noncrash segments Table 8. Odds ratios and confidence limits for 7.32-m (24-ft) total paved width Table 9. Comparison of study results with CMFs from literature Table 10. Selected CMFs from table 9 converted for comparison within a given paved width Table 11. Summary of models estimated for the study Table 12. Additional covariates in Pennsylvania target crash model Table 14. Additional covariates in Pennsylvania total crash model (table 13) Table 15. Additional covariates in Washington target crash model, version 1 43 Table 17. Additional covariates in Washington target crash model (table 16) Table 19. Additional covariates in Washington total crash model (table 18) Table 20. Pennsylvania narrow pavement width model ABBREVIATIONS AND SYMBOLSAbbreviations
Symbols
EXECUTIVE SUMMARYThe Federal Highway Administration (FHWA) organized a pooled fund study of 26 States to evaluate low-cost safety strategies as part of its strategic highway safety effort. The purpose of the FHWA Low-Cost Safety Improvements Pooled Fund Study is to evaluate the safety effectiveness of several low-cost safety strategies presented in the National Cooperative Highway Research Program (NCHRP) 500 Series reports. Although not identified in the NCHRP 500 Series reports, one of the strategies selected for evaluation in the pooled fund study was the allocation of lane and shoulder width for fixed total paved widths on undivided, rural, two-lane roads. The safety effectiveness of various allocations of total paved width has not been thoroughly documented, and this study is an attempt to provide an evaluation through scientifically rigorous procedures. A matched case-control analysis was conducted to determine the safety effectiveness of lane and shoulder width configurations for total paved widths from 7.92 to 10.97 m (26 to 36 ft) using data from Pennsylvania and Washington. For narrow pavement widths (i.e., 7.32 m (24 ft)), a supplemental analysis was conducted using data from Pennsylvania only. Geometric, traffic, and crash data were obtained for the entire population of undivided, two-lane, rural road segments in both States. To account for potential confounding effects, segments were matched by average annual daily traffic (AADT) and segment length, while other variables (e.g., speed limit) were included in the model as covariates. In general, results were consistent with previous research efforts, showing crash reductions for wider paved widths, lanes, and shoulders, all else being equal. The results were not as clear for different configurations of lane and shoulder width, given a fixed pavement width. Considering Pennsylvania and Washington individually, some configurations show that additional lane width is favorable to additional shoulder width, while others indicate the opposite trend. One significant departure from previous research is that the effects of lane and shoulder width should be considered together. Specifically, the crash modification factor (CMF) for a given shoulder width may not be applicable across various lane widths. These recommendations are supported by recently completed research in Texas.(1) An objective of this study was to provide CMFs for various lane-shoulder combinations. The results from the individual State analyses were combined with the previous research in Texas, and CMFs were selected for several configurations of lane and shoulder width.(1) The selected CMFs present a more apparent trend where wider lanes and narrower shoulders are associated with a reduction in crashes given a fixed paved width. For 7.92- to 9.75-m (26- to 32-ft) total paved widths, a 3.66-m (12-ft) lane provides the optimal safety benefit; the CMF ranges from 0.94 to 0.97, indicating a 3-6-percent crash reduction for 3.66-m (12-ft) lanes compared with 3.05-m (10-ft) lanes for a fixed paved width. For a 10.36-m (34-ft) total paved width, 3.35-m (11-ft) lanes provide the optimal safety benefit; CMF was 0.78 compared with the 3.05-m (10-ft) baseline. For a 10.97-m (36-ft) total paved width, both 3.35- and 3.66-m (11- and 12-ft) lanes provide the optimal safety benefit; CMF was 0.95 compared with the 3.05-m (10-ft) baseline. A supplemental analysis was conducted for narrow pavement widths (7.32-m (24-ft) total paved width) on rural, undivided, two-lane roads in Pennsylvania. Results indicated a strong interdependence between traffic volume and lane and shoulder configuration. The CMFs increase nonlinearly with increasing traffic volumes. Also, the rate of increase differs for each lane and shoulder configuration. At the lowest levels of AADT (less than 1,000 vehicles per day), configurations with shoulders have lower CMFs than the baseline (3.66-m (12-ft) lanes and no shoulders). For example, at 500 vehicles per day, the CMFs for the 2.74-m (9-ft) lane and 0.91-m (3-ft) shoulder, 3.05-m (10-ft) lane and 0.61-m (2-ft) shoulder, and 3.35-m (11-ft) lane and 0.30-m (1-ft) shoulder configurations are 0.79, 0.86, and 0.81, respectively. At AADTs greater than 1,000 vehicles per day, configurations with shoulders have higher CMFs than 3.66-m (12-ft) lanes with no shoulders. For example, at 1,500 vehicles per day, the CMFs for the 2.74-m (9-ft) lane and 0.91-m (3-ft) shoulder, 3.05-m (10-ft) lane and 0.61-m (2-ft) shoulder, and 3.35-m (11-ft) lane and 0.30-m (1-ft) shoulder configurations are 1.12, 1.11, and 1.08, respectively. Therefore, for narrow pavement widths, it is beneficial to provide narrower lanes with wider shoulders at low AADTs (less than 1,000 vehicles per day), but the configuration with 3.66-m (12-ft) lanes and no shoulders appears to be most beneficial for large AADTs (greater than 1,000 vehicles per day). There should be no cost for this strategy because the position of the edgeline is the only difference in design. It is likely that the choice of lane-shoulder configuration will be made prior to construction or prior to a resurfacing project and will not involve re-striping the roadway. Due to the zero cost of the strategy, even small expected reductions in crashes will justify their use. For those configurations that show promise (i.e., lower crash odds within a fixed paved width), the benefits are directly related to the expected reduction in crashes; however, the expected crash reduction must be computed on a case-by-case basis. Based on the estimated safety effectiveness of this strategy, specific configurations of lane and shoulder width have the potential to reduce crashes and related costs effectively on rural, two-lane, undivided roads. INTRODUCTIONBackground on StudyIn 1997, the American Association of State Highway and Transportation Officials (AASHTO) Standing Committee on Highway Traffic Safety, with the assistance of the FHWA, the National Highway Traffic Safety Administration, and the Transportation Research Board Committee on Transportation Safety Management, met with safety experts in the field of driver, vehicle, and highway issues from various organizations to develop a strategic plan for highway safety. These participants developed 22 key areas that affect highway safety. The National Cooperative Highway Research Program published a series of guides to advance the implementation of countermeasures targeted to reduce crashes and injuries. Each guide addresses 1 of the 22 emphasis areas and includes an introduction to the problem, a list of objectives for improving safety in that emphasis area, and strategies for each objective. Each strategy is designated as proven, tried, or experimental. Many of the strategies discussed in these guides have not been rigorously evaluated; about 80 percent of the strategies are considered tried or experimental. The FHWA organized a pooled fund study of 26 States to evaluate low-cost safety strategies as part of this strategic highway safety effort. The purpose of the pooled fund study is to evaluate the safety effectiveness of several tried and experimental, low-cost safety strategies through scientifically rigorous crash-based studies. The safety effects of lane and shoulder width have been researched extensively; however, the safety tradeoff for different configurations of lane and shoulder width, given a fixed pavement width, has not been previously addressed. Based on inputs from the Pooled Fund Study Technical Advisory Committee, the following research question was selected for study: Given a fixed roadway width for two-lane, undivided, rural roads, is it safer to provide wider shoulders or wider lanes?State and local agencies are often faced with a decision of how to enhance safety on two-lane, undivided, rural roads when the total paved width is to remain the same. One option is to reconfigure the combination of lane and shoulder width. As an example of the question at hand, given a 9.14-m (30-ft) total paved width, is it best to provide two 3.66-m (12-ft) lanes with 0.91-m (3-ft) shoulders or 3.35-m (11-ft) lanes with 1.22-m (4-ft) shoulders? The application of this strategy is most likely to be incorporated during new construction or during a resurfacing project. It is not likely that an agency would restripe an existing roadway as a standalone treatment. Background on StradegyResearch regarding the safety implications of lane and shoulder width has been conducted for over 20 years and remains of interest today. Among the more recent activities in this area is the work of an expert panel to review research results for the Interactive Highway Safety Design Module (IHSDM). Several studies were reviewed to develop CMF for lane width and shoulder width.(2,3,4) The studies used a variety of data analysis techniques and statistical tools in an attempt to derive the effect of lane and shoulder width on safety. The CMFs developed by the expert panel were later adopted by the Highway Safety Manual (HSM). The first study reviewed by the expert panel estimated the effects of lane widening on two-lane, rural roads in Texas.(2) Weighted least squares regressions were used to investigate relationships of single- and multivehicle crash rates to surface width. The study investigated the importance of AADT on expected number of crashes and subdivided segments by four categories of AADT. Separate regressions were run for each of the four categories and no relation was found between multivehicle crashes and width. Single-vehicle crashes were reported to decrease with increasing lane width in the three highest AADT categories. Reductions were reported up to 50 percent for 2.44 m (8 ft) of pavement widening from 5.49 to 7.92 m (18 to 26 ft), which is equivalent to a 1.22-m (4-ft) lane widening. These reductions, however, may reflect the effects of other variables because the models did not account for several potential confounders (e.g., speed and curvature). The second study estimated the effects of lane and shoulder widths on expected crashes for rural, two-lane roads.(3) Target crash types included run-off-road, head-on, and sideswipe crashes. Segments were grouped by facility type, AADT, number of access points, lane width, and shoulder width. Target crash reductions were reported up to 39 percent for 3.35-m (11-ft) lanes when compared with 2.13-m (7-ft) lanes and up to 21 percent for 2.74-m (9-ft) shoulders when compared with no shoulders. Confidence intervals were not included with these estimates. The study did not account for horizontal curvature, vertical curvature, or speed in the analysis. The third study used a multiplicative crash prediction model and included AADT, lane width, paved and unpaved shoulder width, roadside hazard rating, and terrain as predictors.(4) As with the previous study, target crashes included run-off-road, head-on, and sideswipe crashes. Terrain, grade, and horizontal curvature were found to be highly related to number of crashes, but only terrain was included in the model. Expected reductions in target crash types were reported for general lane and shoulder widening, not for specific widths. Results were consistent with previous findings for lane width (reductions up to 40 percent for lane widening of 1.22 m (4 ft)), but much greater effects were reported for shoulder widening (49-percent reductions for shoulder widening of 2.44 m (8 ft)). The large difference in reported crash reductions between the two studies raises some concern and may indicate the presence of confounding effects. The literature review indicates that there is fairly substantial evidence of the benefits of adding shoulders to nearly all lane widths. Work by the expert panel for the HSM and IHSDM has established CMFs for lane width and shoulder width, individually; however, they do not address the issue of the optimal lane and shoulder width combination, given a fixed total paved width. The safety effectiveness of various lane-shoulder width combinations for a fixed paved width is explored empirically in this study to provide better support to the States when selecting a lane-shoulder combination for a given paved width. OBJECTIVEThe objective of this study was to determine the safety effectiveness of combinations of lane and shoulder width on two-lane, rural, undivided roads for a fixed pavement width. Target crash types included the following:
All modeling was conducted for both target and total crashes. Intersection-related crashes are excluded because this study focused on segment-related crashes. METHODOLOGYBACKGROUNDWhile the Empirical Bayes (EB) before-after method is the preferred study design to rigorously develop CMFs, it was not possible to employ the EB method for this study because States do not frequently change the allocation of lane and shoulder width for a fixed pavement width. It is more common to adjust the total paved width during the process of reallocating lane and shoulder width. Thus, a cross-sectional design was appropriate. In particular, the use of the case-control method was suggested as a strong alternative to the EB approach for the assessment of this strategy. The case-control design is well established in epidemiology where it is used to relate risk factors within a study population to a particular outcome or disease. Case-control methods have been occasionally used in road safety studies. However, they have been applied in relatively few studies on the safety effectiveness of road geometric characteristics. One of the earliest, and in many ways the classic reference on the use of the method, is the Haddon et al. study of pedestrian crashes in Manhattan in 1961.(5) More recent studies include applications to truck crash risk and vehicle configuration, motorcyclists and pedestrians, and childhood pedestrian injuries.(6,7,8) Several studies were conducted using case-control methods to associate truck driver crash risk with hours of service. (See references 9-13.) Just one application of the case-control method was identified in the literature that investigated the safety effects of roadway geometrics.(14) The basic concept of the case-control design is to identify case and control populations based on the outcome of interest and compare the prevalence of risk factors between the two groups. The most important step in a case-control study is defining the cases and controls. Ambiguous or broad definitions for cases and controls may lead to misclassifications and will likely produce unclear results. In the highway safety context, the outcome is defined as a crash, the risk factor is a particular geometric feature or countermeasure, and the subjects are roadway segments. For this study, cases are defined as segments that experience at least one crash during a particular year, and the controls are drawn from those segments not experiencing a crash during the same year. This study includes matching within the case-control design. The primary reason for a matched case-control design is to control for confounding variables. Confounding variables include those variables that completely or partially account for the apparent association between an outcome and risk factor. Specifically, a confounder is a variable that is a risk factor for the outcome under study, and is associated with, but not a consequence of, the risk factor in question.(15) As an example of confounding, consider the effect of lane width on crash risk. A potential confounding variable on the true effect of lane width is AADT. Previous studies have shown AADT to be a significant predictor of crash risk, and it is likely that AADT is associated with lane width; higher-type facilities are usually associated with relatively high AADTs and wider lanes. Hypothetically, an increase in lane width may be associated with an increase in crashes, ignoring the confounding variable (AADT). In fact, lane width may prove to be insignificant or wider lanes may even reduce the risk of a crash when potential confounders, such as AADT, are accounted for appropriately. Based upon previous research AADT and segment length were identified as potential confounders to include in this study.(16) Matching as a means of addressing confounding is accomplished during the selection of controls. Controls are selected so that each matched case-control pair has identical values for the confounding variables (or at least similar values based on a range). For example, continuous variables such as AADT may be categorized into increments of 500 vehicles per day, and controls are randomly selected from the AADT category that corresponds to the matched case. The main advantage of matching during the design stage is direct control of confounders. A disadvantage to the matched design is the increased complexity of data collection and sample selection, especially when there are many matching variables. This may increase the cost and certainly the time for the data collection and analysis process. When matching upon multiple variables, the sample sizes within each matching combination may become small due to the limited number of sites that match the criteria exactly. In road safety, this has been stated as a limitation to cross-sectional studies that involve matching.(17) This study applies a matching scheme to account for the most apparent confounders (AADT and segment length) while including other potential confounders as covariates in the model. CREATION OF CATEGORIES FOR MATCHING VARIABLESAs discussed previously, matching cases and controls by exact values is not practical because it significantly reduces the available sample size. Therefore, categorical variables were created for AADT and segment length, and matching is completed by category. Multiple categories were created for segment length and AADT using the following three steps:
For Pennsylvania and Washington, categories were created for segment length and AADT as shown in table 1. It was not necessary to normalize the segment length data as they were approximately normally distributed. A cube root transformation (i.e., AADT1/3) was necessary to normalize AADT before creating the categories. The mean and standard deviation for the respective variables were then used to create the categories. Table 1. Categories for Pennsylvania and Washington.
Note: Categories of AADT are based on categories created using AADT1/3. 1 ft = 0.305 m ANALYSISThe nature of the study design (i.e., matched case-control study) requires the analysis to account for the matching process between cases and controls. In a matched case-control design, conditional logistic regression may be used to investigate the relationship between the outcome and risk factor.(18) It should be noted that in a matched design, the effect of the matching variables cannot be estimated because they are used as selection criteria when selecting cases and controls. However, the interaction between matching variables and risk factors may be analyzed. For this study, the risk factors of interest are lane width and paved right shoulder width. The analysis determines the odds ratio for various combinations of lane and shoulder width for fixed values of total pavement width. Matching is used to control for the effects of AADT and segment length while other variables are included in the model as covariates to account for potential confounding effects. For Pennsylvania, additional covariates include speed limit, unpaved right shoulder width, and regional indicators. For Washington, additional covariates include speed limit and indicators for horizontal and vertical curvature. The safety effectiveness for each lane-shoulder width combination is estimated using conditional logistic regression. The conditional probability of an outcome associated with the unmatched variables x1,xp for each member of the jth matched set is given by equation 1.(19)
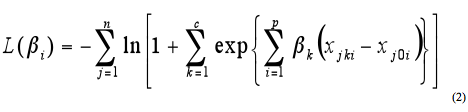
Where: In this application β i is interpreted as the odds ratio for a given value of a covariate compared with the baseline (odds ratio = 1.0) for that variable. For all lane-shoulder combinations, the baseline pavement width category is 10.97 m (36 ft) with 3.66-m (12-ft) lanes and 1.83-m (6-ft) shoulders. The odds ratio for a specific lane-shoulder combination represents the expected percent change in crashes compared with the baseline. Estimates of the coefficients for the explanatory variables are obtained by maximizing the likelihood expression in equation 2.
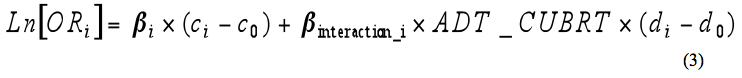
Where: NARROW PAVEMENT WIDTHSA supplemental analysis was conducted for very narrow pavement widths (i.e., less than 7.92 m (26 ft)) on undivided, two-lane, rural roads. The performance of these narrow pavement widths is considered with respect to various lane and shoulder width combinations. The Pennsylvania database was used to identify narrow pavement width configurations. The Washington database did not contain sufficient sample sizes of narrow widths to include in the analysis. Similar models were developed to those used for the wider paved widths; however, the results were not interpretable. Therefore, alternative model forms were considered for the narrow pavement widths. The models had a number of different features compared with those used for the wider widths as follows: A ratio of 2 controls to 1 case was used for the narrow pavement widths to increase the sample size included in the analysis (i.e., 36,206 control segments and 18,103 case segments). Matching variables included segment length and speed limit using the same procedures for defining categorical variables as previously described. AADT was treated as a continuous variable. In order for the variable to have an approximate normal distribution, a cube root transformation was performed. The cube root of AADT was then included as a predictor in the models as a continuous variable. Interactions of lane and shoulder width configurations and AADT were included in the model. Care was taken in estimating the models and interpreting the effect of the interaction since AADT was a continuous variable. In order to successfully capture the effect of the AADT interactions, a clear statistical method needed to be developed. The method must capture the effect of the lane and shoulder width configuration as well as the AADT interactions on the estimates of the odds ratios. It is incorrect to simply use exponentiation of the coefficients because the effect depends on the level of AADT. As such, the log odds must be obtained using equation 3.
Where: The log odds may be transformed to a conventional odds ratio using equation 4, which is the exponentiation of each side of equation 3. All variables are as previously defined.
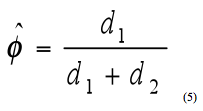
An effective way to show the presence of interaction is via a graph of the estimated conditional (fixed-effects) logistic regression of this model. Confidence limits can also be developed for the odds ratios that include the interaction terms.(20) STUDY DESIGNThe study design involved a sample size analysis and prescription of needed data elements. The sample size analysis assessed the size of sample required to statistically detect a change in safety. A 1:1 matched case-control design was selected as the method to evaluate lane-shoulder width combinations. In this design, a single control is randomly matched to each case based on similar values of the confounding variables (i.e., AADT and segment length). Once the case-control pairs have been established, the presence of the risk factor (i.e., lane-shoulder width combination) is determined for each observation. The data can be summarized as shown in table 2.(18)
Concordant pairs (c1 and c2) are not of interest in the analysis because both the case and control have the same risk factor status. Discordant pairs (d1 and d2), those pairs with different risk factor status, are of particular interest. The probability ( ) that a discordant pair includes a case with the risk factor is estimated by equation 5.
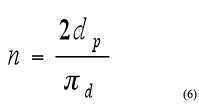
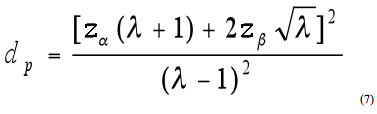
Where: SAMPLE SIZE AND POWERFor a matched case-control design, the required sample size (i.e., number of segments) is equal to twice the number of discordant pairs divided by the proportion of expected discordant pairs in the sample as shown in equation 6.(18) Where: The required number of discordant pairs is estimated from equation 7, which is related to the desired level of significance, power, and detectable difference in risk. The probability of a discordant pair (πd ) must be estimated, either from previous studies or from a sample of existing data. Where: Table 3 illustrates the required sample sizes for various combinations of λ and πd . The number of discordant pairs was calculated based on a desired power of 90 percent and a significance level of 0.10. The Pennsylvania data were examined to determine the percent discordant pairs for both lane and shoulder width, which was used as an estimate for the probability of a discordant pair. There were approximately 70 percent discordant pairs for lane width and 80 percent for shoulder width. Table 3 illustrates how the required number of segments changes based on the probability of a discordant pair with values ranging from 0.5 to 0.8.
In most cases, the available sample size will decrease as the matching scheme becomes more complex. For Pennsylvania, the available sample size is 41,350 segments for the most complex matching scheme. Assuming 70 percent discordant pairs, this sample is adequate to detect a minimum change in crashes of 5 percent at a 10-percent significance level with 90-percent power. However, if the probability of a discordant pair is reduced to 0.6 or 0.5, then the available sample size for Pennsylvania will be inadequate for the desired levels of power, significance, and detection. For Washington, the available sample size is 46,316 segments for the most complex matching scheme. DATA COLLETIONIn order to make the best use of available study resources, existing data from the States of Pennsylvania and Washington were used in the analysis. During the study, additional years of data became available for Pennsylvania and were used in the study targeting narrow pavement widths. PENNSYLVANIAFor Pennsylvania, geometric, traffic, and crash data were obtained for more than 71,616 km (44,500 mi) of roadway segments in from 1997 to 2001. The data were obtained from the Pennsylvania Department of Transportation (PennDOT) in two parts: (1) a crash inventory database extracted from the Pennsylvania Crash Reporting System and (2) a roadway inventory file. Each database identifies segments by County, State Route Number, and Segment Number. Crash data were available for each year of the study period; however, only one geometric file was available for the five-year period. The initial analysis, undertaken to explore the safety implications of lane-shoulder combinations, used these data. The term "wider-lanes" is used to indicate these analyses because they contain lane-shoulder combinations that range from 7.92 to 10.97 m (26 to 36 ft) in total paved width. After initial presentation of these results, the technical advisory committee inquired about the safety effects of narrower total widths. A second data set was obtained from PennDOT, including crash data from 2003 to 2006 in a new integrated database called Crash Data Analysis and Retrieval Tool (C-DART) to pursue narrower total paved widths including widths from 4.27 to 7.32 m (14 to 24 ft). Roadway inventory data were available for each of the four years, reflecting the roadway conditions at the end of each calendar year. PennDOT does not retain the roadway inventory files after each calendar year, so it was not possible to retrieve roadway data for each of the years 1997-2001. Note also that 2002 crash data reflected a transition to a new crash reporting form which resulted in substantially fewer crashes being reported to PennDOT for that year; as a result 2002 was considered an anomaly and not used for this analysis. The crash inventory data include all reportable crashes for midblock locations (i.e., nonintersection crashes). Reportable crashes are defined as those in which at least one vehicle is towed from the scene. Also, any data from ""phantom" or "hit-and-run" crashes are excluded. The dataset includes State roads only and does not include crashes on the Pennsylvania Turnpike facilities. A list of variables contained in the crash inventory database is shown below:
The roadway inventory file contains geometric and traffic data for all segment types. Every State route is divided into segments, which are typically numbered starting with "0010" and increase in increments of 10 from south to north and west to east. Segment length varies as a new segment is created whenever there is a change in cross section or section characteristics. A list of the relevant variables from the roadway inventory file is given below:
The crash inventory database was merged with the roadway inventory file based on unique identifying variables for each segment (i.e., county, route number, and segment number). Once the crash data were merged with the roadway inventory file, the database was cleaned to eliminate segments with incomplete geometric data. There were 197 segments removed due to missing data. The data were then separated by year, and the rural, two-lane, undivided segments were identified for further analysis. A summary of the number of crash and noncrash segments by year is provided in table 4. Crash segments are defined as the number of segments experiencing a crash in a particular year, while noncrash segments are those segments with zero crashes in the same year. Segment lengths are not equal for all segments included in the analysis, but case-control pairs were matched on similar values of segment length. The average segment length in Pennsylvania was approximately 0.80 km (0.5 mi).
Indicates that no data were available for 2002. WASHINGTONGeometric, traffic, and crash data were obtained through the Highway Safety Information System for more than 13,358 km (8,300 mi) of State-maintained highway segments in Washington from 1993 to 1996 and 2002 to 2003. The Washington data were obtained in four parts: (1) a roadway inventory file, (2) a horizontal curve file, (3) a vertical curve file, and (4) a crash inventory database. The geometric databases (roadway inventory, vertical curve, and horizontal curve files) identify segments by a road inventory number as well as beginning and ending milepost. Crash locations are identified by road inventory number and approximate milepost. The crash inventory data included all reportable midblock crashes from calendar years 1993-1996 and 2002-2003. Roadway inventory data were not available for 1997-2001 and were therefore excluded from the analysis. The State of Washington defines the reporting threshold as a crash that involves at least $700 of damage. This dataset does not contain crashes occurring at or near intersections. A list of variables contained in the crash inventory database is shown below:
The roadway inventory file contains geometric and traffic data for all segments by location (i.e., rural and urban). Information regarding horizontal and vertical curvature was included in separate files. The data were merged to obtain a single roadway inventory file of homogeneous roadway segments. First, the horizontal curve file was merged with the roadway data file. Segments were merged by road inventory number and beginning and ending milepost. A new segment was created for every curve and any changes in roadway geometry (e.g., number of lanes, lane width, shoulder width, and shoulder type). The vertical curve file was then merged with the roadway and horizontal curve file in a similar fashion, creating a new segment for every vertical curve. A list of variables contained in the complete roadway file is given below:
The crash inventory database was merged with the complete roadway inventory file. Each crash was identified by approximate milepost and matched with the appropriate segment based on the beginning and ending milepost. Once the crash data were merged with the roadway inventory file, the database was cleaned to eliminate segments with incomplete data. The rural, two-lane, undivided segments were identified for further analysis. A summary of the number of crash and noncrash segments by year is provided in table 5. Washington did not have a sufficient sample of narrower total widths to permit additional analyses; the database had a less variable set of lane-shoulder combinations than Pennsylvania. Segment lengths are not equal for all segments included in the analysis, but case-control pairs were matched on similar values of segment length. The average segment length in Washington was approximately 0.64 km (0.4 mi).
Note: Roadway data were not available for 1997-2001. RESULTSWIDE PAVEMENT WIDTHSA series of models were estimated for pavement widths from 7.92 to 10.97 m (26 to 36 ft), using a 10.97-m (36-ft) total paved width with 3.66-m (12-ft) lanes and 1.83-m (6-ft) shoulders as the baseline. All crash odds are referenced to this baseline. Separate models were constructed for total crashes and target crashes. The process was repeated for both Pennsylvania and Washington data sets. All models matched segment length and AADT. While the effects of lane and shoulder width did not vary substantially by AADT, the sample included relatively few segments with AADT, fewer than 1,000 vehicles per day. Therefore, the results, in general, apply to roadways with AADTs greater than 1,000 vehicles per day. For Pennsylvania, 10 models were estimated, 5 using the dataset of target crashes and 5 using the dataset of total crashes. Initial models for Pennsylvania yielded results that were difficult to interpret, indicating the need for the series of additional modeling. Using what was learned from the Pennsylvania models, only four models were estimated with the Washington data. These models and their attributes are summarized in the appendix. The final model for Pennsylvania included speed, lane width, shoulder width, unpaved shoulder width, and district as covariates. The final model for Washington included speed, lane width, shoulder width, and horizontal and vertical curve presence as covariates. The additional covariates were used to account for potential confounding effects, and the results represent an average over all levels of the covariates. The results for these models for target crashes (i.e., run-off-road, head-on, sideswipe opposite direction, and sideswipe same direction crashes) and for total crashes are presented in the following sections. Table 6 and table 7 present the odds ratio and associated standard error for various lane-shoulder configurations. The odds ratio represents the expected percent change in crashes compared with the baseline. The baseline is indicated by an odds ratio of 1.0. An odds ratio less than 1.0 represents an expected reduction in crashes, while an odds ratio greater than 1.0 represents an expected increase in crashes (e.g., odds ratio of 1.10 indicates a 10-percent increase in crashes compared with the baseline). The standard errors indicate the significance of the odds ratio for a given pavement configuration in a specific State; the standard errors in the following tables cannot be applied to odds ratios or CMFs from other studies. The standard errors were used to compute the confidence limits for each specific lane-shoulder configuration. Confidence intervals that include 1.0 indicate that the odds ratio is not significantly different from the baseline. Pennsylvania Target Crash ModelThe results for Pennsylvania are summarized in table 6, indicating the effects of lane and shoulder width configurations on target crashes. The table provides the sample size (i.e., number of segments) for each lane and shoulder width combination as well as the confidence intervals for the estimated values. The appendix provides estimates of the additional covariates included in the target crash model.
Note: Bold denotes results significant at the 95-percent confidence level. 1 ft = 0.305 m In table 6, the odds ratio is an estimate of the odds of a crash for a total pavement width with specific lane and shoulder width combination, compared with a 10.97-m (36-ft) total paved width with two 3.66-m (12-ft) lanes and two 1.83-m (6-ft) shoulders. The odds ratio is estimated directly from the conditional logistic regression shown in equation 1. The following are noteworthy interpretations from table 6. There is a general declining trend for the odds ratio as total paved width increases (again, controlling for AADT, segment length, speed, district, and unpaved shoulder width). This is apparent as the odds ratios for wider pavement widths 9.75-10.97 m (32-36 ft) are less than the odds ratios for narrow pavement widths 7.92-9.14 m (26-30 ft). This is generally consistent with the findings of earlier research.(2,3,4) More specific to the objective of this study, one can examine the trend in crash odds within each total paved width. For example, for a 7.92-m (26-ft) total paved width, the crash odds are nearly the same for 0.91-m (3-ft) shoulders (3.05-m (10-ft) lanes) and 0.61-m (2-ft) shoulders (3.35-m (11-ft) lanes). This is indicated by the scale of the odds ratio parameter (1.127 and 1.116, respectively) and the degree of overlap of the 95-percent confidence limits (1.044-1.217 and 1.028-1.212). However, the 7.92-m (26-ft) paved width with 0.30-m (1-ft) shoulders (3.66-m (12-ft) lanes) has a much higher odds ratio (1.845), and the 95-percent confidence limits exclude the odds ratios for the other two configurations. This indicates a significant difference despite the small sample size (134) for the 3.66-m (12-ft) lanes with 0.30-m (1-ft) shoulders configuration. The 8.53-m (28-ft) total width illustrates a similar trend for the configurations with 3.05-m (10-ft) and 3.35-m (11-ft) lanes, except in this case, the last category (3.66-m (12-ft) lanes with 0.61-m (2-ft) shoulders) has overlapping confidence limits and does not appear to be significantly different from the other two configurations. Interestingly, all have confidence limits greater than 1.0, indicating an increased crash risk compared with the baseline design (3.66-m (12-ft) lanes with 1.83-m (6-ft) shoulders). The 9.14-m (30-ft) total paved width has a slight increasing trend in crash odds as shoulder width decreases; a reversal of the trend for 7.92-m (26-ft) total width. Examination of the upper and lower confidence limits indicates that there is not a significant difference in odds among any of the three lane and shoulder width configurations (i.e., the odds ratio for each configuration is contained within the confidence limits of the other configurations). The 9.75-m (32-ft) total paved width has a relatively constant odds ratio for the 1.22-m (4-ft) shoulder (3.66-m (12-ft) lanes) and 1.52-m (5-ft) shoulder (3.35-m (11-ft) lanes) configurations; however, the odds ratio declines significantly for the widest shoulder configuration (3.05-m (10-ft) lanes and 1.83-m (6-ft) shoulders). This is the second indication that wider shoulders are preferred over wider lanes, given a fixed pavement width. The 10.36-m (34-ft) total paved width has a relatively small sample size (only 54 segments) in the 3.05-m (10-ft) lanes with 2.13-m (7-ft) shoulders configuration. This leads to broad confidence limits for that parameter; however, the odds ratio for the 3.05-m (10-ft) lanes with 2.13-m (7-ft) shoulders configuration is much higher than the other two configurations, which are virtually the same. This is an indication that wider lanes are preferred over wider shoulders, given a fixed pavement width. The 10.97-m (36-ft) total paved width contains the baseline configuration (3.66-m (12-ft) lanes with 1.83-m (6-ft) shoulders), which is fixed at an odds ratio of 1.0. The other two configurations have odds ratios below 1.0, indicating a decrease in risk as shoulder width increases, but only the widest shoulder configuration (3.05-m (10-ft) lanes with 2.44-m (8-ft) shoulders) is statistically different from the baseline. The analysis included relatively few segments with an AADT of fewer than 1,000 vehicles per day. Therefore, the results, in general, apply to segments with an AADT of greater than 1,000 vehicles per day. To confirm that the results do not vary substantially by AADT, a subsequent model was developed, excluding those sites with an AADT of fewer than 1,000 vehicles per day. The results were nearly identical to the analysis that included all segments. The analysis included segments with posted speed limits ranging from 24 to 89 km/h (15 to 55 mi/h). To confirm that the results do not vary substantially by speed limit, separate models were developed for high-speed (i.e., greater than 72 km/h (45 mi/h)) and low-speed segments (i.e., 72 km/h (45 mi/h) and less). While the odds ratios were generally slightly greater for higher-speed roads compared with low-speed roads, the difference was not statistically significant. Pennsylvania Total Crash ModelThe model results for the total crash analyses are contained in the appendix. The general trends were virtually the same as those for the target crash model, except the results for the target crash model showed greater sensitivity with respect to changes in lane and shoulder combinations. For example, configurations with an elevated risk of target crashes (odds ratio greater than 1.0) had a slightly higher odds ratio when compared with the same configuration in the model of total crashes. Segments with a reduced risk of total crashes (odds ratio less than 1.0) had an even lower odds ratio for target crashes. This is rational since the concept of target crashes is that they are likely to be more directly affected by changes in lane and shoulder combinations than total crashes. This expectation was supported by the models. Washington Target Crash ModelThe Washington model results for target crashes are presented in table 7. The table illustrates that there are predominant lane and shoulder combinations in Washington compared with Pennsylvania (i.e., for a given fixed pavement width in Washington, there is typically one configuration with a large number of segments as indicated by the sample size). As a result, there are few good combinations for comparison within a total paved width in Washington. For example, total widths of 7.92 and 8.53 m (26 and 28 ft) have only one configuration each with a sample size greater than 200 observations, making comparisons within these total widths difficult due to the relatively large confidence intervals. Three other total widths of 9.14, 9.75, and 10.36 m (30, 32, and 34 ft) have two configurations, each with relatively large samples; the results indicate a reduction in crash odds as the lane width is increased. In all cases, however, the upper and lower confidence limits overlap, indicating it is unlikely that the crash odds are different from each other. For a fixed lane width of 3.35 m (11 ft) (i.e., comparing the odds ratio as shoulder width increases from 0.61 to 2.13 m (2 to 7 ft)), there is a clear trend in reduced crash odds as shoulder width increases. This trend provides validation against accepted relationships from the HSM and other previous research but does not answer the question of interest concerning lane and shoulder width tradeoffs.(21) The presence of a horizontal or vertical curve on a segment increases crash odds. Comparison of model parameters for the lane and shoulder combinations with (table 7) and without (see appendix) adjustment for horizontal and vertical alignment shows very little change in crash odds. It may be that additional design variables are needed to determine the effect of alignment with lane and shoulder width.
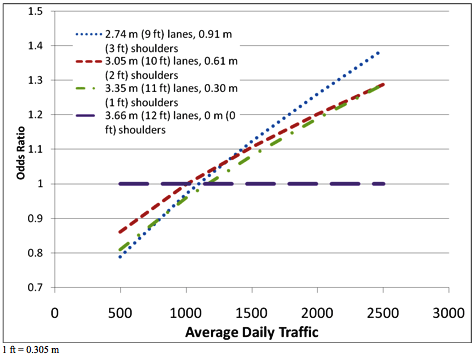
Note: Bold denotes results significant at the 95-percent confidence level. 1 ft = 0.305 m Washington Total Crash ModelThe results from the total crash model for Washington did not yield any significant additional insights. There was more variability in parameter estimates likely due to the fact that the total crash types include a portion of crashes that are unaffected by differences in lane and shoulder width. The total crash model is presented in the appendix and is comparable to the target crash model results displayed in table 7. NARROW PAVEMENT WIDTHSThis section presents results for the narrow pavement width analyses of Pennsylvania data. These analyses are considered supplemental to the previous results and include pavement widths less than 7.92 m (26 ft). The results of the model estimation are summarized in the appendix. The models included AADT as a continuous rather than categorical variable because earlier modeling attempts using categories led to inconsistent results. The models consistently show a strong interdependence between AADT and odds ratio, necessitating the use of interaction terms in addition to main effects. Virtually all main effects and interactions are statistically significant. Crash odds increase nonlinearly with AADT, and the rate of increase differs for each lane and shoulder combination; this validates the use of the main effects and interactions model. At the lowest level of AADT, virtually all lane and shoulder combinations have lower odds than the baseline, but as AADT increases, a change occurs at approximately 1,900 vehicles per day, after which nearly all the configurations have a higher risk than the baseline. Table 8 and figure 1 explore the odds ratios for different lane and shoulder width configurations for the 7.32-m (24-ft) total paved width. The baseline was 3.66-m (12-ft) lanes with no shoulders. When AADT is less than approximately 1,000 vehicles per day, the odds ratios are less than 1.0. When AADT is greater than approximately 1,000 vehicles per day, the odds ratios exceed 1.0. These results are not statistically significant at the 95-percent confidence level as evidenced by the confidence intervals (i.e., confidence intervals that include 1.0 indicate insignificant results). Rather, these results are intended to show the importance of considering AADT when estimating the odds ratio for low-volume, narrow roadways. Taken as a whole, these results indicate some reduction in crash odds by adding shoulder width compared with lane width, but, in general, only when AADT is very low. Similar analyses were considered for other narrow paved widths, but there was either an insufficient sample size or configurations had insignificant main or interaction effects to indicate a trend in odds ratio.
C.L. = Confidence limit Figure 1. Odds ratios for 7.32-m (24-ft) total paved width for various AADT levels. SUMMARYThe objective of this study was to determine the safety effectiveness of specific combinations of lane and shoulder width on two-lane, rural, undivided roads. The case-control method was applied to estimate the relative safety effectiveness of various lane and shoulder width combinations using Washington and Pennsylvania data. In general, the Pennsylvania results for lane width and shoulder width, individually, are consistent with previous research; wider lanes and wider shoulders are associated with a reduction in crash risk. For a fixed pavement width, the results are not as clear. The results are too mixed to indicate a clear preference for wider shoulders or wider lanes for a fixed pavement width. Results for some configurations indicate a preference for wider lanes, while others support the use of wider shoulders. However, small sample sizes make it difficult to show a definitive trend for some configurations. As the results for each fixed pavement width are based on three lane-shoulder combinations, it is important to develop three reliable points to determine if a clear trend exists. The results apply, in general, to roadways with an AADT greater than 1,000 vehicles per day, but the results do not change significantly across levels of AADT. The same lack of consistency was present in the Washington results. There was a clear trend in reduced crash odds as shoulder width (and therefore total pavement width) increases for a fixed lane width of 3.35 m (11 ft). This trend provides validation against accepted relationships from the HSM but does not answer the question of interest concerning lane and shoulder width tradeoffs.(21) The narrow paved width analysis in Pennsylvania showed a strong interdependence with AADT. Detailed modeling of the 7.32-m (24-ft) paved width indicated that at low volumes (less than 1,000 vehicles per day) odds ratios are generally less than 1.0. When traffic volumes are greater than 1,000 vehicles per day, the odds ratios exceed 1.0, but the confidence intervals generally include 1.0. Taken as a whole, these results indicate some reduction in crash odds by adding shoulder width compared with lane width, but only when volumes are less than 1,000 vehicles per day. SELECTED CMF VALUES AND COMPARISONS TO LITERATUREWIDE PAVEMENT WIDTHSWide pavement widths 7.92 to 10.97 m (26 to 36 ft) were the primary focus of this research, and CMFs were developed using data from Pennsylvania and Washington. An additional analysis was undertaken to compare these study findings to the literature. Specifically, results were compared with the draft chapter on two-lane rural roads from the HSM and a report on design decisions by the Texas DOT (TxDOT) that includes an analysis of lane and shoulder width.(1,21) The HSM considers lane and shoulder width separately and does not consider the interaction between the two variables.(21) The HSM implicitly assumes that a given shoulder width would have the same effect on safety for roadways with different lane widths (e.g., a 1.22-m (4-ft) shoulder would have the same effect on safety for roadways with a 3.05-m (10-ft) lane as roadways with a 3.66-m (12-ft) lane). The TxDOT report explicitly considers interactions between lane width and shoulder width in the model formulation, allowing the effects of shoulder width to vary across different lane widths.(1) The approach adopted for this research also explicitly considers the interaction between lane and shoulder width by obtaining separate estimates of safety effectiveness for each lane-shoulder pair. The findings from the three studies are compared in table 9, and a CMF value is selected for each lane-shoulder configuration. The selected values represent a compromise that emphasizes findings from this study but also integrates results from the TxDOT research. In cases where the CMF from this study had an insufficient sample size, the TxDOT CMF was used to provide an estimated value of the CMF for the specific lane-shoulder configuration. If there was a choice between using the CMFs from Pennsylvania or Washington, the one with the larger sample size was chosen; this was always the Pennsylvania estimate. The research team believes that combining the results of the two studies produces a set of CMFs that reflects the project objective while filling gaps (i.e., unreliable estimates) with additional research findings. Standard errors and confidence limits are not provided in table 9 due to the combining of results from the two studies. The standard errors and confidence limits can be obtained from table 6 for those CMFs that are derived from the Pennsylvania results. Those CMFs selected from the TxDOT research (i.e., those marked with an asterisk in table 9) do not have standard errors. As such, it is difficult to determine the statistical significance of some estimates. The last column in table 9 presents the selected CMFs for various lane-shoulder configurations compared with a baseline configuration with 3.66-m (12-ft) lanes and 1.83-m (6-ft) shoulders. In general, the results apply to two-lane rural roads with an AADT greater than 1,000 vehicles per day. A disaggregate analysis did not reveal substantial differences across levels of AADT or speed. While the effects were generally greater for higher-speed roads (i.e., speed greater than 72 km/h (45 mi/h)) when compared with low-speed roads, the difference was not statistically significant. Overall, the safety effectiveness of lane-shoulder combinations appears to be consistent at various levels of AADT and speed. As a result of combining the research findings, there is a more apparent trend with respect to the optimal configuration of lane and shoulder width for a given pavement width. Comparing the magnitude of CMFs in table 9, it is clear that the HSM values are generally much larger, while the values from the Pennsylvania analysis and the TxDOT study are relatively similar in magnitude. The Washington CMFs are a bit more inconsistent, owing largely to lower sample sizes for many lane-shoulder combinations. Considering the differing methodologies and data employed, the CMFs from TxDOT and Pennsylvania are remarkably similar. The TxDOT model consistently results in lower crash risk by adding width to the lane rather than the shoulder.(1) For each total paved width, the configuration with the lowest crash risk is the one with the widest lane and narrowest shoulder (except the 10.97-m (36-ft) width). This is a reflection of the method applied and the data from Texas. It should be noted that the TxDOT model used fatal and injury crashes, not the "target crashes" used in this research and in the HSM.
* Selected CMF was based on the TxDOT
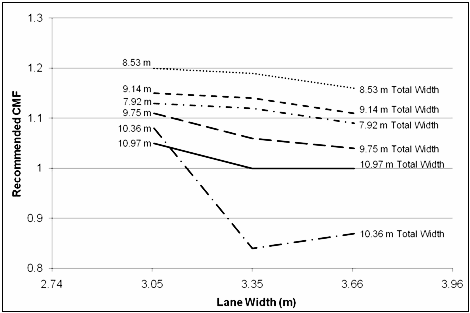
research. The selected CMFs from table 9 are also presented in figure 2 to better illustrate the trends. In general, wider lanes and narrower shoulders enhance safety for a fixed paved width (i.e., the CMF generally decreases as lane width increases from 3.05 m (10 ft) to 3.66 m (12 ft). For total paved widths from 7.92 m (26 ft) to 9.14 m (30 ft), the CMF decreases only slightly as lane width increases from 3.05 m (10 ft) to 3.35 m (11 ft). The CMF then decreases more substantially as lane width increases from 3.35 m (11 ft) to 3.66 m (12 ft). For total paved widths from 9.75 m (32 ft) to 10.97 m (36 ft), the most substantial reduction in the CMF occurs as lane width increases from 3.05 m (10 ft) to 3.35 m (11 ft). The CMF is then relatively constant, and even increases slightly for the 10.36-m (34-ft) paved width, as lane width increases from 3.35 m (11 ft) to 3.66 m (12 ft). Figure 2 also illustrates the general consistency of results with previous research; the wider pavement widths 9.75-10.97 m (32-36 ft) are associated with fewer crashes than the narrow pavement widths 7.92-9.14 m (26-30 ft). This figure is useful to show the general relationships between the crash experience of the various roadway widths but should not be used to derive the differences between individual pavement widths. Some of the configurations had limited sample sizes. Additionally, this figure does not take into account the factors that went into the total pavement width decision for a given road when the road was constructed. These factors may inherently affect the safety of the roadway. An example of this is terrain. Limited right of way in mountainous terrain may necessitate a 7.92-m (26-ft) roadway instead of a 10.97-m (36-ft) roadway. The terrain has an effect on crash occurrence that is not completely accounted for in these models.
Figure 2. Selected CMFs from research and literature in relation to 10.97-m (36-ft) baseline with 3.66-m (12-ft) lanes and 1.83-m (6-ft) shoulders. There is always a concern when studies from different locations are combined. This is referred to as model transferability. Reasons for concern include different design standards, different driver populations, and varying environmental and geographic conditions. What is convincing in this comparison to the literature is the striking similarity in magnitude with the Texas study and the equally striking difference with respect to HSM values. The results for the 10.36-m (34-ft) total paved width are the main substantial difference between the Texas and Pennsylvania analyses. The Pennsylvania findings were chosen in this case because of the strength of the statistical association demonstrated by the model. The comparisons have provided additional confidence that the selected values are a reasonable reflection of conditions. NARROW PAVEMENT WIDTHSThe odds ratios developed for the narrow pavement widths were not significant. However, a clear relationship was exhibited in the relationship between low-volume roadways and narrow pavement widths. At low volumes, odds ratios and confidence intervals are generally less than 1.0. When traffic volume is greater than approximately 1,000 vehicles per day, the odds ratios exceed 1.0. Taken as a whole, these results indicate some reduction in crash odds for narrow paved widths by adding shoulder width compared with lane width, but, in general, only when traffic volume is very low. SELECTED CMFs FOR COMPARISON WITHIN A GIVEN PAVED WIDTHThe CMFs in table 9 represent the expected change in target crashes compared with a baseline scenario of 3.66-m (12-ft) lanes and 1.83-m (6-ft) shoulders. When comparing lane-shoulder configurations for a total paved width other than 10.97 m (36 ft), it is necessary to adjust the CMFs by creating a new baseline. This is easily accomplished for any total paved width by dividing the CMF for the new baseline into the CMF for the configuration to be compared (equation 8).
For example, a State may be considering the potential configurations for a fixed pavement width of 9.75 m (32 ft). If the 3.05-m (10-ft) lane with 1.83-m (6-ft) shoulder configuration is selected as the new baseline for the 9.75-m (32-ft) paved width, the adjusted CMFs for 3.35-m (11-ft) lane with 1.52-m (5-ft) shoulder and 3.66-m (12-ft) lane with 1.22-m (4-ft) shoulder configurations are calculated as follows (equations 9 and 10) using the selected CMFs (table 9):
The adjusted CMFs indicate the expected change in crashes relative to the new baseline (3.05-m (10-ft) lane and 1.83-m (6-ft) shoulder configuration). Based on the adjusted CMFs, roadways with a 3.35-m (11-ft) lane and 1.52-m (5-ft) shoulder configuration are shown to have 0.95 times fewer crashes than the baseline configuration (a five percent decrease). Roadways with a 3.66-m (12-ft) lane and 1.22-m (4-ft) shoulder configuration are shown to have 0.94 times fewer crashes than the baseline configuration (a six percent decrease). For the 9.75-m (32-ft) total paved width, the (12-ft) lane and 1.22-m (4-ft) shoulder configuration is shown to be the optimal combination with respect to safety. Table 10 presents the selected CMFs from table 9 in this adjusted format. While the CMFs in table 9 are all in relation to a configuration with 3.66-m (12-ft) lanes and 1.83-m (6-ft) shoulders, the CMFs in table 10 have been adjusted to reflect a baseline scenario with 3.05-m (10-ft) lanes for each total paved width (i.e., CMF = 1.00). For fixed total paved widths from 7.92 m (26 ft) to 10.97 m (36 ft), the CMF is shown to decrease as lane width increases (i.e., wider lanes and narrower shoulders appear to be the optimal configuration with respect to safety). While 3.66-m (12-ft) lanes appear to be the optimal design for 7.92-m (26-ft) to 9.75-m (32-ft) total paved widths, 3.35-m (11-ft) lanes perform equally well or better than 3.66-m (12-ft) lanes for 10.36-m (34-ft) to 10.97-m (36-ft) total paved widths. There may be additional benefits to providing a 3.35-m (11-ft) lane width compared with a 3.66-m (12-ft) lane width for specific scenarios. For example, AASHTO recommends, as a minimum, 0.61 m (2 ft) of the shoulder width should be paved to provide for pavement support, wide vehicles, collision avoidance, and additional pavement width for bicyclists.(22) The 3.35-m (11-ft) lane will also provide an extra 0.30 m (1 ft) of shoulder, given a fixed paved width, which may provide the necessary additional shoulder width to accommodate disabled vehicles. From a maintenance perspective, it may be desirable to provide 3.35-m (11-ft) lanes compared with 3.66-m (12-ft) lanes to help keep drivers off of the edge of the pavement, particularly for very narrow total paved widths.
ECONOMIC ANALYSISCompletion of the economic analysis requires careful consideration of the project scope. The objective of this study was as follows: Given a fixed roadway width for a two-lane, undivided, rural road, is it safer to provide wider shoulders or wider lanes? This statement indicates that the activity of interest is not a re-striping project or a change in total paved width. Rather, for new construction or a resurfacing project with a given total paved width, there is a decision to be made regarding the allocation of lane and shoulder width. Given this description, the costs of alternatives are essentially equal; therefore, it is reasonable to just consider the benefits. The CMFs presented in this study provide the expected percent change in total crashes and target crashes for various lane and shoulder width configurations. For a fixed pavement width, the relative percent change in crashes is calculated as shown in the previous section. Once the relative percent change in crashes is calculated for the lane-shoulder combinations of a fixed pavement width (table 3), the most safety-effective configuration can be selected. The most cost-effective configuration for a given paved width is the one with the lowest CMF. Continuing with the example of a 9.75-m (32-ft) paved width and the selected CMFs (table 3), it is clear that the 3.66-m (12-ft) lane with 1.22-m (4-ft) shoulder configuration is the most safety-effective configuration within the 9.75-m (32-ft) paved width group. Crash cost savings are based on the expected reduction in crash frequency. To compute the expected reduction in crash frequency, the CMFs must be applied to actual crash data for a given location. Again, using the example of a 9.75-m (32-ft) paved width and the selected CMFs (table 3), the expected change in target crashes would be a 6-percent decrease by reallocating the lane and shoulder width from a 3.05-m (10-ft) lane with 1.83-m (6-ft) shoulder configuration to a 3.66-m (12-ft) lane with 1.22-m (4-ft) shoulder configuration. Assuming a crash experience of 100 target crashes per year in the before condition, this would yield a reduction of six crashes per year. Estimated crash costs are then applied to the expected change in crashes to estimate the dollar savings. Crash costs typically vary by State but can be estimated from the recent FHWA crash cost guide when State-specific crash cost data are not available.(23) CONCLUSIONSIn general, the Pennsylvania and Washington models indicated a reduction in crash odds as total pavement width increases on undivided, two-lane, rural roads. As a validation, the safety effects of lane and shoulder width were assessed individually. The models indicated a general reduction in crash odds as lane width increases while holding shoulder width constant and similarly, a reduction in crash odds as shoulder width increases while holding lane width constant. These results are consistent with previous studies. Comparing the results of this study with previous research, it is apparent that the effects of lane and shoulder width should be considered in the context of each other (i.e., the CMF for a given shoulder width may not be applicable across various lane widths). This study and the TxDOT report consider the interaction between lane and shoulder width, while the HSM considers lane width and shoulder width separately.(1) The results of this study are more consistent with the TxDOT report, while the HSM appears to overestimate the combined effects of lane and shoulder width. Supplementing the results of this study with previous research, CMFs were selected for the various configurations of lane and shoulder width on undivided, two-lane, rural roads. The selected values present a more apparent trend in the tradeoff between lane and shoulder width. In general, the selected CMFs for paved widths of 7.92-10.97 m (26-36 ft) indicate a slight benefit to increasing lane width compared with shoulder width for a fixed total width. These results apply, in general, to rural, two-lane roads with AADT greater than 1,000 vehicles per day, but results are relatively consistent across various levels of AADT. For narrow paved widths (i.e., 7.32 m (24 ft)), there is a slight reduction in crash odds by adding shoulder width compared with lane width, but only when traffic volume is very low (i.e., less than 1,000 vehicles per day). However, configurations with relatively narrow lanes may not be appropriate for roadways with notable truck traffic. This is due to issues related to off-tracking, where the rear wheels of trucks generally track inside the front wheels on horizontal curves. Therefore, the design vehicle should be considered when identifying potential lane-shoulder configurations. APPENDIX: SUPPORTING INFORMATION
C.L. = Confidence limit
C.L. = Confidence limit C.L. = Confidence limit C.L. = Confidence limit C.L. = Confidence limit
C.L. = Confidence limit
C.L. = Confidence limit
C.L. = Confidence limit
1 ft = 0.305 m ACKNOWLEDGEMENTSThe project team gratefully acknowledges the participation of the following for assistance in this study:
REFERENCES
|
|||||||||||||||||||||||||||||||||||||||||||||||||||||||||||||||||||||||||||||||||||||||||||||||||||||||||||||||||||||||||||||||||||||||||||||||||||||||||||||||||||||||||||||||||||||||||||||||||||||||||||||||||||||||||||||||||||||||||||||||||||||||||||||||||||||||||||||||||||||||||||||||||||||||||||||||||||||||||||||||||||||||||||||||||||||||||||||||||||||||||||||||||||||||||||||||||||||||||||||||||||||||||||||||||||||||||||||||||||||||||||||||||||||||||||||||||||||||||||||||||||||||||||||||||||||||||||||||||||||||||||||||||||||||||||||||||||||||||||||||||||||||||||||||||||||||||||||||||||||||||||||||||||||||||||||||||||||||||||||||||||||||||||||||||||||||||||||||||||||||||||||||||||||||||||||||||||||||||||||||||||||||||||||||||||||||||||||||||||||||||||||||||||||||||||||||||||||||||||||||||||||||||||||||||||||||||||||||||||||||||||||||||||||||||||||||||||||||||||||||||||||||||||||||||||||||||||||||||||||||||||||||||||||||||||||||||||||||||||||||||||||||||||||||||||||||||||||||||||||||


 (8)
(8) (9)
(9) (10)
(10)