U.S. Department of Transportation
Federal Highway Administration
1200 New Jersey Avenue, SE
Washington, DC 20590
202-366-4000
Federal Highway Administration Research and Technology
Coordinating, Developing, and Delivering Highway Transportation Innovations
 |
| This report is an archived publication and may contain dated technical, contact, and link information |
|
Publication Number: FHWA-HRT-09-039
Date: April 2010 |
|||||||||||||||||||||||||||||||||||||||||||||||||||||||||||||||||||||||||||||||||||||||||||||||||||||||||||||||||||||||||||||||||||||||||||||||||||||||||||||||||||||||||||||||||||||||||||||||||||||||||||||||||||||||||||||||||||||||||||||||||||||||||||||||||||||||||||||||||||||||||||||||||||||||||||||||||||||||||||||||||||||||||||||||||||||||||||||||||||||||||||||||||||||||||||||||||||||||||||||||||||||||||||||||||||||||||||||||||||||||||||||||||||||||||||||||||||||||||||||||||||||||||||||||||||||||||||||||||||||||||||||||||||||||||||||||||||||||||||||||||||||||||||||||||||||||||||||||||||||||||||||||||||||||||||||||||||||||||||||||||||||||||||||||||||||||||||||||||||||||||||||||||||||||||||||||||||||||||||||||||||||||||||||||||||||||||||||||||||||||||||||||||||||||||||||||||||||||||||||||||||||||||||||||||||||||||||||||||||||||||||||||||||||||||||||||||||||||||||||||||||||||||||||||||||||||||||||||||||||||||||||||||||||||||||||||||||||||||||||||||||||||||||||||||||||||||||||||||||||||
Pavement Marking Demonstration Project: State of Alaska and State of Tennessee-Report to CongressChapter 3. Cost EffectivenessPrevious | Table of Contents | Next As described earlier, the State transportation departments' pavement marking expenditures for 2007 were estimated at approximately $911 million.(7) Finding the most cost-effective pavement marking for a given location could help reduce this figure while providing additional funding for other highway safety and maintenance areas. However, it has proven difficult to determine specific cost effectiveness levels for different pavement marking materials, as there are a plethora of factors that influence the results. One of the best ways to determine the cost effectiveness of pavement markings is to test them under the same conditions for which they are used-on the road. There are numerous reports documenting pavement marking test deck designs and their results, but there are essentially two main types of on-the-road pavement marking evaluations: (1) transverse test decks and (2) long-line test decks (see appendix B). Transverse test decks are applied perpendicular to the flow of traffic. Long-line test decks are applied in the normal marking locations, consistent with the flow of traffic. Both transverse and long-line test decks may consist of several marking types to allow for comparative analysis. The researchers employed both test deck designs for this study. INTRODUCTIONPavement marking test decks were installed in Alaska and Tennessee with cooperation from the local State transportation departments. In 2006, a 12-material test deck was installed near Anchorage, AK, and a 9-material test deck was installed near Nashville, TN. In 2007, a second test deck (also with nine materials) was installed near Tusculum, TN. All three of these test decks included long-line configurations of the right edge line and near lane line. Each section consisted of approximately 0.5 mi of a test material either surface-applied, recessed in a groove, or both. The materials were only installed along tangent sections of highway, free of turning maneuvers and other activities that might have produced biased results. The Anchorage, AK, and Tusculum, TN, test decks also included transverse markings as well as high-build and low-temperature acrylic markings. All three test decks were installed on divided, multilane highways with asphalt pavements in good condition. See appendix C for detailed information about the test deck locations, pavement marking materials, and applications. During the installation of the test decks, the researchers were present and collected pertinent data for subsequent analysis. Industry representatives were also present to help ensure that the pavement marking materials were installed as per manufacturer recommendations. Samples were taken of all the materials used. The test decks were evaluated three to four times per year through retroreflectivity and presence measurements. This section of the report describes each test deck, the materials that were installed, and latest results of the monitoring. It also includes an analysis of cost effectiveness based on the current condition of the test deck pavement markings and an average cost for the materials. ALASKA TEST DECKIn August 2006, a pavement marking test deck was installed on the Glenn Highway (Alaska State Route (SR) 1) northeast of Anchorage, AK. The Glenn Highway is a six-lane divided highway with an AADT of approximately 51,000. The Anchorage, AK, pavement marking test deck area consists of 12 test sections along the Glenn Highway between Boniface Parkway and East Eagle River Loop Road. Table 13 lists the different pavement markings installed on the Alaska test deck. New markings were installed on the Alaska test deck in both 2007 and 2008 to replace markings that had failed during the previous winter. Throughout the life of the test deck, data were typically collected each year as soon as possible after the winter season, during the summer, and as late as possible prior to the next winter season. Table 13. Anchorage, AK, test deck edge line and outside lane line pavement markings.
1 August 7, 2006 installation date. 2 June 21, 2007 installation date. 3 September 24, 2007 installation date. 4 October 2, 2007 installation date. 5 August 5, 2008 installation date. TENNESSEE TEST DECKSThe researchers installed two test decks in Tennessee: one near Nashville where the central office of the Tennessee Department of Transportation (TDOT) is located and one near Tusculum, a region where snow fall is most likely in Tennessee. These test decks were designed to be similar in several ways to the Alaska test deck so that direct comparisons could be made between materials in Alaska and Tennessee. For instance, the Tusculum, TN, test deck materials were primarily installed with handcarts similar to the Anchorage, AK, test deck. However, there were differences as well. For example, most materials on the Nashville, TN, test deck were installed with long-line trucks. These installation techniques were chosen to assess possible differences between handcart-applied materials and long-line truck applied materials. Nashville, TN, Test DeckThe Nashville, TN, pavement marking test deck area was installed in October 2006. This test deck has nine sections along SR-840 between I-65 and I-24 with an AADT of approximately 19,000. Table 14 shows the different pavement markings that were installed. Unlike the other test decks, which had 4-inch-wide markings, all markings along the Nashville, TN, test deck were 6 inches wide, as this is the TDOT policy for markings on highways of this functional classification. In June 2008, the researchers added three lead-free yellow thermoplastic sections to this test deck in order to accomplish two objectives. The first objective was to provide data for the initial and maintained nighttime yellow appearance of the lead-free markings, which is a concern to many State transportation departments considering the switch to a more environmentally benign thermoplastic pavement marking. The second objective was to better understand the environmental impacts of pavement markings, which is further addressed in a subsequent chapter. Table 14. Nashville, TN, test deck edge line and lane line pavement markings.
N/A = Not applicable. 1 October 16, 2007 installation date. 2 June 5, 2008 installation date. Each year, data were typically collected as soon as possible after the winter season, twice during the middle of the year, and as late as possible prior to the next winter season. Tusculum, TN, Test DeckThe Tusculum, TN, pavement marking test deck area was installed in May 2007. This test deck has nine sections along SR-34 (AADT is approximately 12,000) between SR-107 and SR-75. Table 15 shows the different pavement markings that were installed. Table 15. Tusculum, TN, test deck edge line and lane line pavement markings.
DATA COLLECTION TECHNIQUESThe researchers designed a data collection protocol to determine the durability of the pavement markings on the test decks so that when combined with installation costs and indirect costs such as traveler delay, the overall cost effectiveness of the tested pavement markings could be calculated. As part of the data collection protocol, retroreflectivity measurements and photographic images were collected for each pavement marking along the edge line, lane line, and transverse line. Retroreflectivity MeasurementsRetroreflectivity data were collected using a handheld pavement marking retroreflectometer and a mobile retroreflectometer. The handheld retroreflectometer measures only the edge line markings whereas the mobile retroreflectometer measures the edge line and lane line markings. The handheld dataset is used as a way to verify the mobile retroreflectivity dataset. Retroreflectivity measurements were collected in dry conditions only. The data collection protocol was designed to yield enough data to obtain a statistically valid representation of the pavement markings while keeping the exposure of the data collection team to traffic at a minimum. The data collection protocol for this project was partially modeled after the methodology described in American Society of Testing and Materials (ASTM) D 6359, and all retroreflectivity devices met the criteria set in ASTM E 1710.(20,21) All data collection devices were properly calibrated prior to data collection. Mobile Measurements The mobile retroreflectivity data were measured continuously, and an aggregated average was recorded every 52.8 ft (0.01 mi). The value of 0.01 mi is a user-defined measurement length and is near the minimum length allowed by the retroreflectometer software. The first data point at the beginning and last data point at the end of each section were removed from the analysis to ensure that there was no overlap in the data between marking application types or markings not under study. Handheld Measurements The handheld retroreflectivity data were measured at specific predetermined points to yield robust and representative data. A sampling plan was developed so that the average value from each set of measurements for each line was within a 95 percent confidence of the true mean for the measured test section. Photographic ImagesPhotographic images of each section were taken using a digital camera. These were captured and recorded in order to document their general condition and to ensure their availability to be used later to quantify the presence of the pavement marking materials using a software tool developed by the researchers. A total of 10 images were taken of each marking section in representative locations near where the handheld measurements were taken. Pavement Marking DurabilityFor this project, a pavement marking system was deemed to have remaining service life if it maintained adequate presence as subjectively evaluated in situ and retroreflectivity of at least 100 mcd/m2/lux. The markings in Alaska experienced severe winter conditions, whereas the markings in Tennessee experienced relatively mild winter conditions. As a result, the durability data between the two regions were vastly different. It should be noted that the service life of any pavement marking system is quite variable and depends on numerous factors. The only true way to determine the durability of a marking is to monitor the marking’s performance throughout its life. Even then, the service life of that particular marking is only applicable to that given set of variables. Traffic volume, roadway surface type, and winter maintenance activities are some of the major influences on the service life of a pavement marking system. Other factors that can influence service life include the percentage of heavy vehicles, application conditions, weather conditions, orientation of the marking, roadway geometry, marking thickness, type of retroreflective optics used, and criteria for determining the end of the service life. Based on the actual conditions at each site, the service life could be longer or shorter than at another site that has the same marking applied. The next sections describe the durability observations from each region of this study. Appendix D includes figures showing the retroreflective degradation of markings that have lasted over 1 year. AlaskaThe winter weather conditions and associated winter maintenance activities experienced on the Alaska test deck proved difficult for many of the pavement marking systems. Some markings failed in either retroreflectivity, presence, or both during the first winter following installation. New materials were applied and tested the following year where materials failed, often with similar results. Table 16 describes the results of the various pavement marking sections along the Alaska test deck. It should be noted that the table only includes the results from the edge line. In all cases but one, the lane line results were similar which is explained as follows. Table 16 includes results of the in-situ presence ratings as well as the averaged retroreflectivity data by test section. Between April and July 2007, all of the markings were over-coated with standard Alaska Department of Transportation and Public Facilities (DOT&PF) pavement marking paint and beads as initially installed on test section 1 AK a. This material had failed to maintain presence and retroreflectivity through the first winter. The results in table 16 show that the performance of the paint in the second winter was the same. However, using paint to refresh durable markings that lost retroreflectivity but not presence over the winter appeared to be a viable solution for regions that experience winter conditions similar to those in Anchorage, AK. The paint-based pavement marking systems including the advanced acrylic pavement markings were unable to maintain retroreflectivity and presence past their first winter season. Placing the paint-based pavement marking systems in a groove did not help these systems make it through their first winter. They were the only markings to fail in both durability measures (retroreflectivity and presence) after their first winter. The only markings that maintained an adequate level of retroreflectivity past their first winter were the tape products installed in sections 5 AK a and 5 AK b. The tape products maintained adequate retroreflectivity past the second winter, although the presence on the lane line was judged as being less than adequate. As shown in table 16, the tape on the edge line continued to provide adequate presence and retroreflectivity through the end of 2008. The only other pavement marking systems that maintained adequate presence through the first two winters were both applications of extruded MMA. Interestingly, there were no apparent service life differences between surface-applied, shallow groove, and deep groove applications for the individual marking systems in Alaska. Two new pavement marking systems were installed in August 2008 and were evaluated in spring 2009. The remaining markings were also reevaluated at the same time to determine if they were able to maintain adequate levels of presence or retroreflectivity. The data collection trip that was scheduled for spring 2009 was the researchers’ last planned trip to the Alaska test deck. The section of highway including the test decks along the Glenn Highway was scheduled for rehabilitation during summer 2009. Table 16. Anchorage, AK, edge line pavement marking test deck results.
P = Presence rating from in-situ evaluations (A =
Adequate, M = Marginal, F = Fail). TennesseeThe pavement marking test sections on the Nashville, TN, test deck have been in service for over 2 years. All marking systems are still showing adequate retroreflectivity and presence. Table 17 and table 18 show the initial and most recent retroreflectivity readings for the edge lines and lane lines, respectively, for each of the different test sections. The data show that not all markings degraded at the same rate. Future retroreflectivity levels can only be accurately determined through continued data collection. The service life of all markings at the Nashville, TN, test deck based on the current data is greater than 2 years. The lead-free thermoplastic installations along the Nashville, TN, test deck were installed in June 2008. All of the installations continued to show adequate presence and retroreflectivity through the end of 2008. Table 19 shows the initial and most recent retroreflectivity readings for the three lead-free yellow sections. The current retroreflectivity readings are all much higher than the initial retroreflectivity readings. The increase in retroreflectivity is likely due to the fact that the initial measurements were taken the same day that the markings were applied. Initially, the glass beads were slightly over-embedded. As the markings wore, more of the glass beads were exposed, and loose beads were removed, which improved retroreflectivity. Daytime and nighttime color measurements were recorded over time to address concerns that lead-free materials do not provide the same level of a saturated yellow color as do thermoplastic markings with lead chromate as a pigment. Like the retroreflectivity and presence measurements, there is not yet enough information from the color measurements to make an accurate recommendation on these lead-free thermoplastic materials. Table 17. Nashville, TN, test deck edge line durability information.
N/A = Not applicable. Table 18. Nashville, TN, test deck lane line durability information.
N/A = Not applicable. Table 19. Nashville, TN, lead-free thermoplastic test deck durability information.
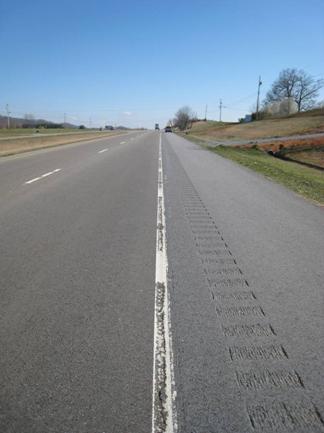
The pavement marking test sections at the Tusculum, TN, test deck have been in service for almost 2 years. The marking systems still show adequate retroreflectivity and presence, with the exception of the modified epoxy in section 1 TN-T. The presence of this material has been reduced to less than 1/2 of the initial installation. The remaining materials still provide retroreflectivity levels significantly higher than 100 mcd/m2/lux. The pattern of missing and present materials is an indication that the failure of the pavement marking system may be due to an installation problem and not a weakness of the material itself (see figure 8).
Figure 8. Photo. Tusculum, TN, test deck section 1 TN-T presence failure. Table 20 and table 21 display the initial and most recent retroreflectivity readings for the edge lines and lane lines, respectively, for each of the different test sections. Like the Nashville, TN, test deck, the Tusculum, TN, data clearly show that the markings degraded at different rates. The data only record the degradation of these pavement marking systems during the first 2 years of service. Future retroreflectivity levels can only be accurately determined through continued data collection. Based on the current data, the service lives of all markings at the Tusculum, TN, test deck were greater than 1.5 years. Table 20. Tusculum, T N, test deck edge line durability information.
Table 21. Tusculum, TN, test deck lane line durability information. Pavement Marking CostsThe three pavement marking test decks had many different types of pavement markings installed, each of which had a range of expected costs. Geographical location, availability of materials, contract size, application type, material thickness, types of retroreflective optics used, timing of application, surface preparation requirements (e.g., removal of preexisting marking material, preparation of grooves, etc.), and traffic control costs all impact the installation cost of pavement markings. The researchers reviewed information on typical costs for the materials that were installed on the test decks. (See references 22–34.) For materials where costs could not be found in literature, estimated costs were developed based on the cost of similar materials and expected price differences. The pavement marking costs, combined with the pavement marking durability data, were the primary elements needed to determine cost effectiveness levels. Table 22 displays the pavement marking costs found through a literature search and average bid costs for select States. Wider pavement markings were found to increase the cost of the marking by varying degrees. Tennessee bid prices for increasing marking width from 4 to 6 inches for thermoplastic showed a 57 percent increase in cost for spray applications and a 50 percent increase in the cost of extruded applications. Other State bid prices indicated a 7 to 28 percent increase for paint and a 50 to 76 percent increase for thermoplastic. A 2002 report by Gates and Hawkins cited an internal memo from the Arizona Department of Transportation which stated, “The main drawback cited to the use of wider markings is the increased cost over 4-inch markings, the magnitude of which depends on the marking width, contract size, materials used and striping procedure. Recent cost estimates by the Arizona DOT [stet] predicted a 38 percent increase in contracted cost for 6-inch thermoplastic markings compared to 4-inch markings.”(10) Grooving the road surface to create an area to recess the markings can be a substantial cost addition to the pavement marking system. In a 2006 report by Lagergren et al., it was reported that groove costs could be $1.05/ft for a 100 mil groove and $0.95/ft for a 60 mil groove.(31) In a 2007 report by Hawkins et al., it was reported that grooves can cost between $0.40/ft and $1.40/ ft.(32) Milled shoulder rumble strips that are used for rumble stripes were found to cost between $0.10/ft and $0.16/ft.(33,34) Table 22. Pavement marking cost information.
N/A = Not applicable. Table 23 through table 25 show the estimated costs for the markings applied at the Anchorage, AK; Nashville, TN; and Tusculum, TN, test decks, respectively. Replications were removed, and materials were ordered from least to most expensive. The costs are displayed for a typical new application on the surface of the road and for an in-laid marking where the cost of the groove is $0.75 per ft. The costs are also on a per linear foot and per mile basis. The Nashville, TN, test deck costs are for 6-inch-wide markings, as this was the only width of marking applied at that test deck. Table 23. Estimated pavement marking costs for Anchorage, AK, test deck.
Table 24. Estimated 6-inch pavement marking costs for Nashville, TN, test deck.
Table 25. Estimated pavement marking costs for Tusculum, TN, test deck.
Pavement Marking Cost effectivenessThere are several aspects to achieving the most cost-effective pavement marking. The first and most direct aspect is to compare the net present cost over a given interval using the direct and indirect costs and service life of each candidate material. The researchers designed and implemented an experimental plan that was intended to evaluate the service life of various pavement marking materials under different environmental conditions. However, the data from this project cannot currently be used for calculation of net present cost. The Alaska data are not useful for such a comparison, as the harsh winter conditions caused most of the materials to fail in providing adequate retroreflectivity after only one winter season. Under these conditions, agencies must evaluate the benefits provided by the presence of markings, which include guidance during daytime and a template against which the road can be remarked. The Tennessee data are incomplete in that none of the alternative pavement marking materials have degraded to the point of failure as of the end of 2008. Indirect costs that must be included in the overall evaluation of cost effectiveness include the delay and safety aspects imposed by striping and restriping activities as well as retroreflectivity measurements activities.(26) Another indirect cost that an agency may wish to include is the observed luminance of the pavement markings during wet night conditions. Materials that perform significantly better than average may eliminate the need for augmenting the pavement markings with delineators or RRPMs. Given the conditions described above, a cost effectiveness calculation cannot be provided at this time. As a result, the research project has been extended through spring 2010 in order to develop additional data on the degradation rates and service lives of the alternative materials. The results of this activity will be documented in a final research report to the FHWA due in June 2010. Advanced Acrylic Waterborne Pavement Markings findingsTwo types of advanced acrylic waterborne pavement markings (commonly referred to as low temperature and high build) were installed at each of the pavement marking test decks. These markings were designed to provide better performance (high build is considered more durable under typical traffic conditions and allows use of larger optical components for improved retroreflectivity) and greater installation flexibility (low temperature can be applied at reduced ambient and road temperatures) than standard waterborne paint. The cost analysis shows that these paint systems were equivalent in cost to conventional highway paint and much less expensive than other durable pavement markings systems. The durability of the advanced acrylic paints on the Anchorage, AK, test deck was not acceptable for a durable product (one that would last at least 1 year). Both types of acrylic markings were virtually gone after the first winter season, resulting in less than 1 year of service life. The durability of the advanced acrylic paints on both Tennessee test decks is acceptable to date. These markings have retained adequate retroreflectivity and presence through the end of 2008. Both advanced acrylic markings are performing comparably to some of the other alternative pavement marking systems as well. As more data are collected at the Tennessee test decks, the durability and resulting cost effectiveness of the advanced acrylic markings will become more evident. Chapter SummaryThree pavement marking test decks were installed to evaluate the durability of various pavement marking materials, including advanced acrylic pavement markings. The goal of these test decks was to obtain the necessary durability data and combine that with cost information to assess the cost effectiveness of the pavement marking systems under evaluation. The test decks were evaluated three to four times per year through measurement of retroreflectivity and presence. The test deck installed near Anchorage, AK, proved to be in a harsh environment for pavement markings of any type. Most of the markings tested on this test deck were deemed inadequate after their first winter even when installed in a recessed groove to minimize plow damage. The paint-based pavement marking systems, including the advanced acrylic pavement markings, were unable to maintain retroreflectivity and presence past the first winter season. The only markings that maintained adequate presence through the first two winters were the extruded MMA and the tape on the edge line. The tape product did not provide the same level of presence on the lane line as compared to the edge line. It is believed that the added weaving to which lane lines were exposed was responsible for the accelerated degradation of the tape product. The only marking that maintained adequate retroreflectivity through the first two winters was the tape on the edge line. The tape was the most expensive alternative marking installed on the Anchorage, AK, test deck, and it required application in a groove in areas where snow plow operations were expected. If maintained retroreflectivity and presence are deemed to be necessary throughout the winter months and into the spring, then the in-laid tape marking is the only system tested that is able to achieve these performance levels and only for 1 year on the lane lines. One strategy that the DOT&PF uses is applying a durable MMA marking in a groove and then remarking the MMA with low VOC paint each spring to provide adequate retroreflectivity through the summer and fall. This procedure provides a marking with year-round presence and retroreflectivity from the time the markings are restriped with paint in the spring until the paint wears away during the winter. Without considering the indirect costs of traffic delays and risk of crashes involved with more frequent striping activities, this may be the most cost-effective method for the conditions tested on the Alaska test deck. One option that may be equally effective but reduce the amount of hazardous chemicals is the use of low-temperature advanced acrylic paint in place of the low VOC paint for the spring painting activities. Two test decks were installed in Tennessee, one near Nashville and another near Tusculum. Essentially, all of the markings being evaluated on the Tennessee test decks continue to provide adequate presence and retroreflectivity. While the markings are not degrading at the same rate, none have reached a point where the retroreflectivity has fallen below the minimum level established for this project of 100 mcd/m2/lux. As a result, the cost effectiveness of the alternative pavement marking systems installed on the Tennessee test decks cannot be determined at this point. These markings continued to be evaluated through the 2009–2010 winter. |
|||||||||||||||||||||||||||||||||||||||||||||||||||||||||||||||||||||||||||||||||||||||||||||||||||||||||||||||||||||||||||||||||||||||||||||||||||||||||||||||||||||||||||||||||||||||||||||||||||||||||||||||||||||||||||||||||||||||||||||||||||||||||||||||||||||||||||||||||||||||||||||||||||||||||||||||||||||||||||||||||||||||||||||||||||||||||||||||||||||||||||||||||||||||||||||||||||||||||||||||||||||||||||||||||||||||||||||||||||||||||||||||||||||||||||||||||||||||||||||||||||||||||||||||||||||||||||||||||||||||||||||||||||||||||||||||||||||||||||||||||||||||||||||||||||||||||||||||||||||||||||||||||||||||||||||||||||||||||||||||||||||||||||||||||||||||||||||||||||||||||||||||||||||||||||||||||||||||||||||||||||||||||||||||||||||||||||||||||||||||||||||||||||||||||||||||||||||||||||||||||||||||||||||||||||||||||||||||||||||||||||||||||||||||||||||||||||||||||||||||||||||||||||||||||||||||||||||||||||||||||||||||||||||||||||||||||||||||||||||||||||||||||||||||||||||||||||||||||||||||