U.S. Department of Transportation
Federal Highway Administration
1200 New Jersey Avenue, SE
Washington, DC 20590
202-366-4000
Federal Highway Administration Research and Technology
Coordinating, Developing, and Delivering Highway Transportation Innovations
 |
| This techbrief is an archived publication and may contain dated technical, contact, and link information |
|
Publication Number: FHWA-HRT-09-046
Date: August 2009 |
|||||||||||||||||||||||||||||||||||||||||||||||||||||||||||||||||||||||||||||||||||||||||||||||||||||||||||||||||||||||||
Safety Evaluation of Improved Curve DelineationFHWA Contact: Roya Amjadi, PDF Version (211 KB)
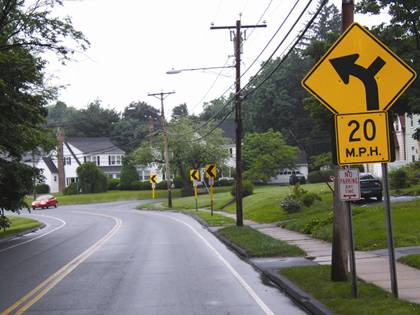
PDF files can be viewed with the Acrobat® Reader® ObjectiveThe Federal Highway Administration (FHWA) organized 26 States to participate in the FHWA Low Cost Safety Improvements Pooled Fund Study as part of its strategic highway safety plan support effort. The purpose of the pooled fund study is to estimate the safety effectiveness for several of the unproven low-cost safety strategies identified in the National Cooperative Highway Research Program (NCHRP) Report 500 Series. One of the strategies chosen to be evaluated for this study is improved curve delineation. This strategy is intended to reduce the frequency of curve-related crashes by providing more conspicuous signing and lane markings. The safety effectiveness of this strategy has not been thoroughly documented, and this study is an attempt to provide a crash-based evaluation through scientifically rigorous procedures. IntroductionStatistics from the Fatality Analysis Reporting System indicate that 42,642 people were killed in 38,588 fatal crashes on the U.S. highway system in 2006.(1) Approximately 27 percent of these fatal crashes occurred along horizontal curves.(1) These crashes occurred predominantly on two-lane rural highways that are often not part of the State system.(2) Approximately 70 percent of curve-related fatal crashes were single-vehicle crashes in which the vehicle left the roadway and struck a fixed object or overturned, and 11 percent of curve-related fatal crashes were head-on crashes. Thus, run-off-road and head-on crashes accounted for 81 percent of the fatal crashes at horizontal curves.(1) Also, the average accident rate for horizontal curves is about three times the average accident rate for highway tangents.(3) Hence, implementing strategies designed to improve the safety at horizontal curves will help achieve the overall goal of the American Association of State Highway and Transportation Officials (AASHTO) Strategic Highway Safety Plan. One such strategy with potential for improving horizontal curve safety is enhancing delineation along curves. According to the NCHRP Report 500 Series Volume 7, "A Guide for Reducing Collisions on Horizontal Curves," enhancing delineation along a curve is currently a tried but not proven strategy that can be implemented on most curves as well as problem curves.(2) Enhanced curve delineation can serve multiple purposes. First, it allows for drivers of vehicles to have better visibility when approaching curves by increasing visual cues. In addition, enhanced curve delineation can provide positive guidance while navigating through a curve. Improved delineation can also encourage drivers to decrease their speed into and through a curve, which can reduce the frequency of run-off-road and head-on crashes. Improved delineation can especially be helpful under low-light or nighttime conditions. Options for enhanced delineation include using better pavement markings such as higher durability, all-weather quality, and higher retroreflectivity. Other options include post-mounted delineators, chevrons, raised pavement markers, and wider edge lines.(2) An example of enhanced curve delineation is shown in figure 1.
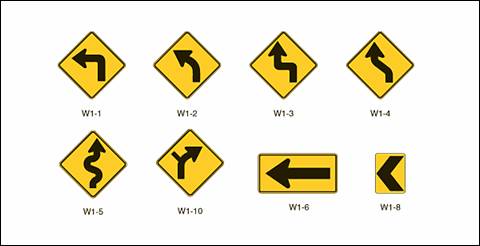
Figure 1. Photo. Example of a curve treated with enhanced delineations in Connecticut. Enhanced delineation is a potential treatment for curves that have some form of delineation or other safety treatment but continue to experience higher crash rates.(1) The installation or upgrade of any pavement marking should follow the guidelines in the Manual on Uniform Traffic Control Devices (MUTCD).(4) While the literature supports the use of improved curve delineation, this strategy cannot be considered a proven strategy because there are no truly valid estimates of effectiveness based on sound before-after crash-based studies in North America. More research is needed to substantiate the evidence for highway agencies implementing this strategy. The safety effectiveness of improved curve delineation is explored empirically in this study to provide better support to the States when selecting safety improvements at horizontal curves on two-lane rural roads. MethodologyData were collected from Connecticut and Washington. Both States have implemented delineation improvements for horizontal curves on two-lane rural roads. Study locations were selected from the two States based on the availability of installation data, including location and installation dates. Geometric, traffic, and crash data were obtained for a total before period sample of 188.8 kilometer-years (117.3 mile-years), including 73.7 kilometer-years (45.8 mile-years) from Connecticut and 115.1 kilometer-years (71.5 mile-years) from Washington. A total of 187.6 kilometer-years (116.6 mile-years) was obtained for the after period, including 34.8 kilometer-years (21.6 mile-years) from Connecticut and 152.9 kilometer-years (95.0 mile-years) from Washington. Kilometer-years are the number of kilometers where the strategy is applied multiplied by the number of years the strategy has been in place at each location. For example, if a strategy is applied along 9 km (5.6 mi) of roadway and is in place for 3 years along all 9 km (5.6 mi), there is a total of 27 kilometer-years (16.8 mile-years) available for the study. Geometric, traffic, and crash data were also obtained for reference curves with characteristics similar to the strategy sites in both States but without curve delineation improvements. During the data collection process, the project team identified a variation in curve delineation improvements between the two States. Specifically, Connecticut improved signing by upgrading to fluorescent yellow sheeting. This included installing new signs or replacing existing signs. The signs in question were either warning signs (e.g., curve ahead or suggested speed limit) and/or curve delineation signs (e.g., chevrons or horizontal arrows). Figure 2 shows the types of signs used in the treatment. Signs W1-1 through W1-5 and W1-10 were classified as warning signs in this study. Signs W1-6 and W1-8 were classified as curve delineation signs. Unlike Connecticut, the treatments in Washington only involved the installation of chevrons (W1-8 signs) on horizontal curves. This included both locations where there were previously no chevrons and locations where the number of chevrons was increased.
Figure 2. Chart. Sign types used in Connecticut horizontal curve treatments from MUTCD. Empirical Bayes (EB) methods were incorporated in a before-after analysis to determine the safety effectiveness of curve delineation improvements along two-lane rural roads. The EB methodology for observational before-after studies was used for the evaluation.(5) In order to account for site selection biases, the study analysis required the identification of reference sites. Reference sites were identified as curves that were similar to the treatment sites but did not receive the improved signing treatment. Safety performance functions (SPFs) were calibrated separately for use in the EB methodology using the reference sites for each State. Generalized linear modeling (GLM) was used to estimate the model coefficients using the software package SAS®.(6) A negative binomial error distribution was assumed for the GLM, which was consistent with the state of research in developing these models. SPFs were estimated for the following crash classifications:
The full report includes a detailed explanation of the methodology, including a description of how the estimate of percent reduction was calculated. ResultsTwo sets of results were calculated and are presented in the following sections. One set contains aggregate results for each State as well as for the two States combined. The other set of results is a disaggregate analysis, which grouped sites by various characteristics to evaluate the impact of these variables on the safety effectiveness. The disaggregate analysis focused on the following factors:
AADT and curve radius were available from both Washington and Connecticut. RHR and the number of signs were available only in Connecticut. Aggregate AnalysisThe aggregate results are shown in table 1 for Connecticut and Washington. Table 1. Results for Connecticut, Washington, and combined strategy sites.
Note: Bold denotes those safety effects that are significant at the 95-percent confidence level. The following points summarize the results for the individual State analyses:
Results from the aggregate analyses indicated general safety benefits for improved curve delineation. The disaggregate analysis is presented in the following section, indicating specific situations where the strategy may be more effective. Disaggregate AnalysisA disaggregate analysis was completed in an attempt to discern factors that may impact the safety effectiveness of delineation improvements for curves. The results of the disaggregate analysis are summarized below. Curve Radius In Connecticut, the treatments appeared to be more effective for sharper curves (radius less than 150 m (491.8 ft) or 0.15 km (0.093 mi)) compared to flatter curves (radius equal to or exceeding 150 m (491.8 ft) or 0.15 km (0.093 mi)). However, in Washington and for the two States combined, there were no clear trends regarding the differential effects of curve radius. RHR RHR was only available for Connecticut sites. The results indicated that the treatments were more effective at sites with more hazardous roadsides (RHR of 5 or 6) compared to less hazardous roadsides (RHR between 2 and 4) for total and lane departure crashes during dark conditions. Number of Signs in Advance of Curve The number of signs in advance of the curve was only examined for Connecticut. There was no clear trend in terms of differential safety effects. Number of Signs Within Curve The number of signs within the curve was only examined for Connecticut. The disaggregate analysis indicated that sites with more signs added or replaced (more than seven per curve) had a larger reduction in crashes compared to sites where fewer signs were added or replaced (less than or equal to seven per curve). AADT There were indications that the treatment was more effective for sites with higher AADT compared to sites with lower AADT in both Connecticut and Washington. Economic AnalysisThe purpose of the economic analysis was to evaluate the economic feasibility of delineation improvements for curves on two-lane rural roads. A combined economic analysis is provided, but separate analyses are also provided for each State due to the variation of the treatment. The annualized cost of the treatment was computed based on information provided by the Connecticut and Washington transportation departments. Connecticut provided costs based on the type of treatment ranging from $30 to $160 for a fluorescent yellow sign with a service life of 5 years. The unit cost varied depending on the size of the sign-smaller signs such as chevrons and advisory speed signs were less expensive than larger signs such as curve warning signs. Washington provided an estimate of $100 for chevrons. The lower and upper cost limits from Connecticut were used to provide a range of cost estimates, but the cost may vary for other States depending on the size of the signs and installation and maintenance practices. Based on information from the Office of Management and Budget, a discount rate of 2.4 percent was used to determine the annual cost of the strategy.(8) Although the number of signs per curve may have varied, it was assumed that 10 chevron signs were installed per curve. Assuming installation costs of $30 per sign, this equated to an annualized cost of $6.44 per sign and an annual treatment cost of $64 per curve. Assuming installation costs of $160 per sign, the annualized cost was $34 per sign and $343 per curve. Crash savings were computed based on the results for non-intersection lane departure crashes during dark conditions. The most recent FHWA mean comprehensive crash costs were used to estimate the cost for a lane departure crash based on 2001 dollar values.(7) The FHWA crash cost document does not directly report the cost for a lane departure crash, so it was estimated based on the cost of lane departure-related crashes and the percentage of these crashes. Lane departure-related crashes include head-on, sideswipe, single-vehicle rollover, and single-vehicle fixed object crashes. Based on Washington crash data, these crashes represented 2.6, 1.6, 25.9, and 69.9 percent, respectively. The mean comprehensive crash costs for these crash types were $60,451; $16,019; $147,629; and $67,353, respectively, assuming a speed limit less than 72.45 km/h (45 mi/h). A weighted average was computed by combining the crash costs with the percentage of each crash type, resulting in a cost of $87,143 per lane departure crash. The total crash reduction was calculated for each State by subtracting the actual crashes in the after period from the expected crashes in the after period had the treatment not been implemented. Crashes per site-year were calculated by dividing the total crash reduction by the number of site-years for each State. Site-years, which are computed similarly to kilometer-years, are the number of sites multiplied by the number of years of installation. The benefit (i.e., crash savings) is the product of the total crash reduction per site-year and the cost of a lane departure crash (i.e., $87,143). The benefit-cost ratios are presented in table 2. The lower and upper limits represent the assumed installation costs of $160 and $30 per sign, respectively. Table 2. Summary of economic analysis results.
Even with the conservative assumptions made, a very modest reduction in crashes is required to justify this strategy economically. The benefit-cost ratios far exceeded 2:1. While the cost of the strategy may have varied by State, it is likely that the annualized costs will not exceed the annual crash savings. Therefore, this strategy was justified economically. SummaryThe objective of this study was to evaluate the safety effectiveness of improved delineation on horizontal curves through signing improvements. The study examined the effects of this strategy on specific non-intersection crash types including total, injury and fatal, lane departure, total during dark, and lane departure during dark in a rigorous crash-based analysis. The evaluation was based on 89 sites in Connecticut and 139 sites in Washington, representing a total of 188.8 kilometer-years (117.3 mile-years) in the before period and 187.6 kilometer-years (116.6 mile-years) in the after period. The specific strategies varied between the two States, but both strategies involved curve delineation improvements. Connecticut improved signing by upgrading to fluorescent yellow sheeting for new sign and replacement sign installations. Signs W1-1 through W1-6, W1-8, and W1-10 were included in the upgrade. The treatments in Washington involved only the installation of chevrons (W1-8 signs) on horizontal curves. This included locations where there were previously no chevrons and locations where the number of chevrons was increased. From a practical standpoint, results presented in table 3 support the conclusion that curve delineation improvements have the potential to reduce target crashes. This conclusion is based on the combined analysis from Connecticut and Washington. Table 3 presents the recommended crash reduction factors and standard errors. Table 3. Summary of crash reduction factors.
The disaggregate analysis provided further insight into the circumstances where curve delineation improvements may have been more effective. In both States, the reductions appeared to be more prominent at locations with higher traffic volumes. Based on the limited data from Connecticut, the reductions in crashes were more prominent on sharper curves (curve radius less than 150 m (491.8 ft)) and in locations with more hazardous roadsides (RHR of 5 or higher) compared to locations with less hazardous roadsides (RHR of 4 or lower). In addition, curves where more signs were either added or replaced within the curve with a more retroreflective material experienced larger reductions in crashes. ConclusionThe general conclusion from this research is that delineation improvements for curves have the potential to reduce crashes and crash severity on two-lane rural roads. Based on the installations in Connecticut and Washington, the combined results indicate substantial and highly significant crash reductions-injury and fatal (18 percent), dark conditions (27.5 percent), and dark condition lane departure (25.4 percent). In Connecticut, the effectiveness was greater for curves where more signs were either added or replaced within the curve. An economic analysis revealed that improving curve delineation with signing improvements is a very cost-effective treatment with the benefit-cost ratio exceeding 8:1. Given the potential to reduce crashes, the use of curve delineation improvements is justified as a safety improvement, particularly at curves with more hazardous roadsides, higher traffic volumes, and smaller curve radii. References
|