U.S. Department of Transportation
Federal Highway Administration
1200 New Jersey Avenue, SE
Washington, DC 20590
202-366-4000
Federal Highway Administration Research and Technology
Coordinating, Developing, and Delivering Highway Transportation Innovations
 |
| This report is an archived publication and may contain dated technical, contact, and link information |
|
Publication Number: FHWA-HRT-10-025
Date: June 2010 |
||||||||||||||||||||||||||||||||||||||||||||||
Operating Characteristics of the Segway™ Human TransporterChapter 2. MethodologyIntroductionThis report investigates various operating characteristics of the SegwayTM HT. The research was conducted in two phases. Phase I evaluated the travel speed and stopping distance of experienced SegwayTM HT users under planned and unplanned stopping conditions, and phase II evaluated the approach speed and clearance distance of the SegwayTM HT around obstacles using novice and experienced riders. Phase IIn phase I, experienced SegwayTM HT riders performed a series of tasks while traveling forward on a straight sidewalk closed course for various distances. Riders were asked to ride as fast as they felt comfortable for each speed key. They were instructed to stop at various locations (planned stops) or in response to a signal indicating that they needed to make an immediate stop (unplanned stops). Experimental DesignThe experiment examined the interaction of speed and two types of stops-planned and unplanned stops. The study design is represented in table 3. Planned stops were precision stops that involved riding to a marked location and stopping as close to the marker as possible. Unplanned stops simulated emergency stops where participants were given a signal at a random time and had to stop as quickly as possible. Stops were grouped by type such that participants first made all of the 24 planned or 36 unplanned stops. Participants were randomly assigned to perform either planned or unplanned stops first. Within each stop condition, participants started in the black key, progressed to the yellow key, and then finished in the red key, which was the fastest. Table 3. Number of trials by experimental condition per participant.
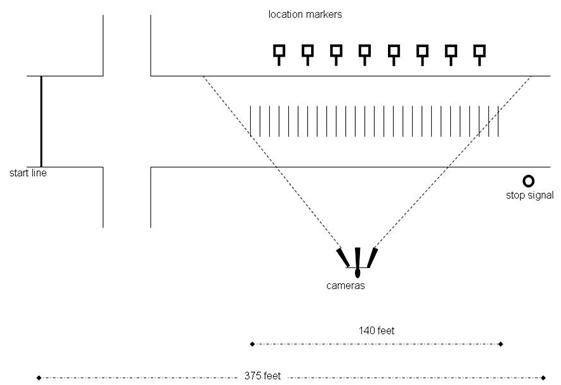
ParticipantsSeven experienced SegwayTM HT riders (one woman and six men) ranging from 30 to 64 years old (the mean age was 41.9 years) volunteered to participate in the experiment. Experienced riders were characterized as those who owned the device or had received training from SegwayTM LLC. They were all recruited through the Washington, DC, SegwayTM HT group.(10) The riders participated individually using their own personal devices and received payment of $30 per hour. Each experimental session lasted between 2 and 3 hours. Participants were asked to fill out a demographic questionnaire prior to beginning the experimental sessions (see appendix). According to their responses, participants had owned their SegwayTM HTs for 9 to 19 months (the mean was 13.1 months with a standard deviation (SD) of 3.1 months). They reported traveling with the SegwayTM HT between 2.5 and 50 mi (4.0 to 80.5 km) a week (the mean was 13.9 mi (22.4 km) with an SD of 16.2 mi (26.1 km)). However, six of the participants reported traveling 10 mi (16 km) or less per week. The reason for the disparity in mileage between participants is the different tasks for which they used the SegwayTM HT. Six reported using the SegwayTM HT for grocery shopping and errands, five reported using it for tourist purposes, and two reported using it for work or to commute. One of the business users reported a weekly travel of 50 mi (80.5 km). Equipment and EnvironmentThe safety equipment used in this study included helmets, reflective vests, knee pads, elbow pads, and gloves. Participants were also weighed to ensure that they were within the personal body weight range that SegwayTM HT recommends, which is between 100 and 250 lb (45.5 and 114 kg). All other materials, which included a demographic questionnaire, a set of task instructions, an environmental safety checklist, and a follow-up questionnaire, were presented to the participants (see appendix). The SegwayTM HT used by all of the participants was an i180 model, weighing approximately 83 lb (38 kg) with a maximum speed of 12.5 mi/h (20.1 km/h). This type of SegwayTM HT has a footprint of 19 inches (483 mm) in length by 25 inches (635 mm) in width, and it is steered by twisting the left hand grip. All data were collected at FHWA's Turner-Fairbank Highway Research Center (TFHRC) in McLean, VA. A section of sidewalk composed of concrete pavement approximately 375 ft (114 m) long and 10.2 ft (3.1 m) wide was used for field tests. Wide grass lots bordered the sidewalk on two sides. The sidewalk had a curb toward the northeastern driveway, and the sidewalk leveled into a parking lot on the southwest side. A short sidewalk intersected the main walkway, but it was not used in this part of the study. Figure 2 (not to scale) depicts the sidewalk course used in the experiment. The experimental and training sidewalks formed a closed course and were blocked to normal pedestrian traffic during testing.
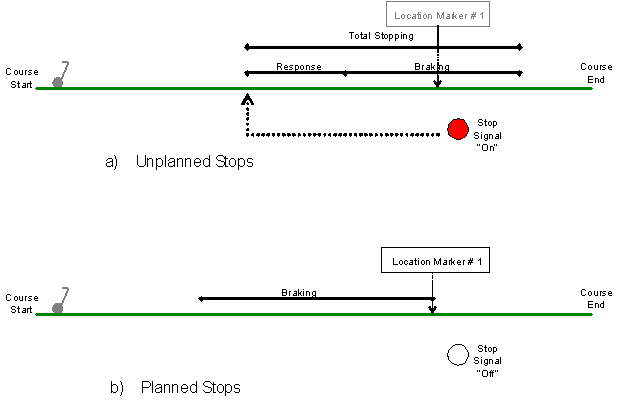
Figure 2. Illustration. Stopping distance course. Three cameras were mounted to a mast on the side of the course and elevated approximately 20 ft (6.1 m). These cameras captured approximately 140 ft (42.7 m) of the course. For each trial, participants traveled approximately 150 ft (45.8 m) before they entered camera view. Each session was video recorded. For the portion of the course within camera range, 1-ft (0.3-m) increments were marked on the sidewalk using durable black tape. Eight stop locations along the course were marked using signs with eight numbers in a random order 10 ft (3.1 m) apart from each other (see figure 2). The unplanned stops involved a signal light that consisted of a red halogen bulb mounted approximately 4 ft (1 m) above the ground at the end of the course. Researchers used a switch to turn the light on to indicate to participants to stop. The location of the planned stops and the timing of the signal for unplanned stops varied between 40 and 110 ft (12 and 33.6 m) from the start of the video recorded course. Two sets of these locations were randomly ordered and presented to participants who were randomly assigned to receive one or the other presentation order. ProcedureUpon arrival, each participant was greeted at the security desk and escorted to the participant preparation area. They read an informed consent form and had the opportunity to ask questions. Each participant was then weighed and given a demographic questionnaire to obtain information about rider characteristics and travel experience (see appendix). Finally, the researcher presented a session outline to the participants and described the experiment. The researcher and participant inspected the SegwayTM HT and the testing environment to identify any hazards. This inspection was guided by a checklist developed during pilot testing and with the assistance of a certified safety professional. This checklist included items such as examining the sidewalk for leaves, branches, and water (see appendix). Participants had to demonstrate that they could use the SegwayTM HT independently and that they could safely travel 300 ft (91.5 m) at each of the three speeds. The researchers evaluated the participants' proficiency by monitoring their stability while standing on, mounting, and dismounting the SegwayTM as well as their ability to smoothly accelerate, control the direction of travel, perform stops, and comply with safety procedures. Following a brief rest period, each participant performed a combined total of 60 unplanned and planned stop trials (see table 3), with 20 trials for each of the three speed keys. The participants began from the start line and rode forward on a straight course along the sidewalk. They were asked to ride as fast as they felt it was safe in each key. Planned StopsAt the beginning of each trial for the planned stops, participants were told to come to a complete stop at a particular location, which was marked alongside the sidewalk. Unplanned StopsFor unplanned stops, participants were told to safely stop as quickly as possible when the red signal light at the end of the course was displayed. General ProcedureAt the end of each trial, participants were asked to rate how comfortable and controlled the ride was. These data were not analyzed and are not presented in this report. After completing all trials, the participants and the researcher discussed the SegwayTM HT's characteristics and their use of the SegwayTM HT during the study. Then, each participant was debriefed and received a brief explanation of how the results of the study would be used to evaluate SegwayTM HT rider performance. Each participant was then paid $30 per hour for participating. Data AnalysisData collection included approximately 18 hours of video data showing participants riding and stopping along 140 ft (42.7 m) of the sidewalk course. The data were reduced by visual inspection and coding by the researchers. Below is a description of the variables that were measured. Note that stopping time and distance were measured in slightly different ways for planned and unplanned stops. Unplanned stops, which involved a signal simulating an emergency braking situation, contained a response component. They were measured in response time and distance as well as in braking time and distance. These trials were measured from the signal activation to the completion of braking (see figure 3, which is not to scale). Planned stops at a specified location marker were measured from initiation to completion of braking. Specifically, they were measured in braking time and distance (see figure 3).
Figure 3. Illustration. Unplanned and planned stops. Variables AnalyzedTravel SpeedTravel speed was measured as the average speed traveled over the first 30 ft (9.2 m) of the course that was in camera range. To determine this, speed was measured over three 10-ft (3.1-m) increments and averaged. Speed was determined by counting the number of video frames per 1-ft (0.305-m) increments traveled to calculate the duration (15 frames/s). Participants traveled for approximately 150 ft (45.6 m) before entering camera range, allowing them to reach their desired travel speed. At the end of the experiment, 416 of a possible 420 trials were completed with adequate data. Of the 416 completed trials, 240 of them (57 percent) were based on measurement across all 30 ft (9.2 m). Because some course markers were not visible due to camera angle and/or glare, some measurements were based on a smaller distance. A total of 103 out of 416 trials (25 percent) were based on speed across 20 ft (6.1 m), and 73 out of 416 trials (18 percent) were based on speed across less than 20 ft (6.1 m). Response TimeResponse time was measured as the time between the activation of the red signal light and the observation that the participant initiated a stop. Stop initiation was a subjective judgment made by the experimenter, observing whether the participant had made a motion or a postural change to slow the device. Such judgments were possible because riders stopped the device by leaning backwards. Prior to coding the data, the researchers were trained on the observed rider behaviors that indicate the initiation of a stop. Response DistanceResponse distance was the distance traveled by the participants during the time between the activation of the signal light and the observation that the participants initiated a stop. Braking TimeBraking time was the time after initiation of a stop that it took for participants to come to a complete stop as observed by the experimenters. A complete stop was indicated by a cessation of forward motion. The researchers were trained on the observed rider posture that indicated a completed stop. Braking DistanceBraking distance was the distance traveled by the participants during the time between the observed initiation and the completion of a stop. AccelerationAcceleration profiles were determined through observing participants' "return trip." Following each stopping trial, participants had to turn around and return to the start line. Researchers recorded speed and travel time over approximately 100 ft (30.5 m) of this return trip (speed was measured over 10-ft (3.1-m) increments) to determine the acceleration profile of participants. Phase IIPhase II of the experiment investigated navigation around obstacles. Previous research provided only basic performance information such as rider speed and stopping behavior in controlled environments where no sidewalk obstacles were present. Real sidewalk conditions can be complex. They include a variety of travel modes (pedestrians, wheelchairs, bicyclists, skaters, etc.) and static objects (light posts, trash cans, benches, trees, etc.) often compressed into a small area and sometimes requiring rapid and tight navigation maneuvers. In phase II, experienced and novice SegwayTM riders rode on a closed sidewalk course with obstacles to provide information on rider behavior related to approach speed and clearance distance in the presence of obstacles. Experimental DesignPhase II examined the speed and passing behavior of novice and experienced riders on two different sections of sidewalk. The study design is represented in table 4. The first sidewalk section was wide and involved riding past pedestrians and inanimate objects. The second sidewalk section was narrow and involved riding past inanimate objects only. Trials were grouped by sidewalk and obstacle type. Participants started each trial from a random starting point and used the yellow speed key during the entire experiment because the novice participants were not trained in the highest speed key (red). Table 4. Number of trials performed by each participant.
Note: N/A indicates that the condition was not run. ParticipantsThe research participants consisted of 10 novice and 10 experienced SegwayTM HT riders. To be classified as experienced, participants had to have used a SegwayTM HT for a minimum of 6 months and had to have ridden a SegwayTM HT a minimum of once per week during that period. To qualify as a novice rider, the participants had to have had no SegwayTM HT experience or to have ridden a SegwayTM HT for less than 10 minutes. All participants met the following criteria:
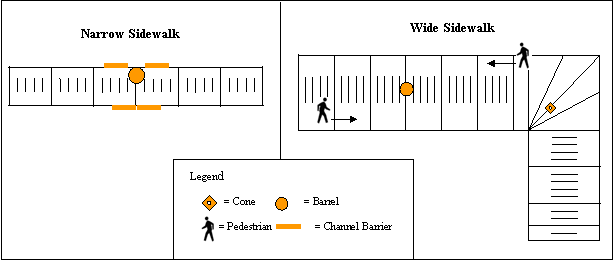
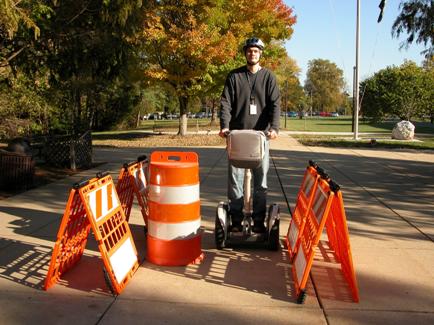
Potential participants were administered a prescreening questionnaire to ensure their eligibility for participation. Participants were paid $30 per hour. Experienced riders completed the experiment in about 2 hours, and the novice participants took about 3 hours to complete the experiment because of the extra training required for them to become accustomed to riding the SegwayTM HT. The novice participants consisted of six men and four women who ranged from 22 to 77 years old (the mean age was 46.9 years). Of the seven experienced riders from phase I, four returned to participate in phase II. The experienced participants consisted of all men and ranged from 35 to 68 years old (the mean age was 52.2 years). There were no experienced female SegwayTM HT riders available to select as participants. Equipment and EnvironmentFHWA provided the SegwayTM HT used in phase II. The SegwayTM HT (i180 model) was equipped with a downward-facing camera mounted on the front of the control shaft. A digital media recorder was placed in an onboard travel pack that was attached to the handle bar to record the video of the downward-facing camera. Animate obstacles consisted of staged pedestrians (experimenters wearing orange safety vests) who walked along one side of the sidewalk. Inanimate obstacles included standard rubber or plastic devices employed for temporary traffic control. These consisted of a traffic cone, a barrel, and channel barriers. The cone had a diameter at the base of 10.8 inches (274.3 mm) and a height of 17 inches (431 mm). The barrel had a diameter of 22 inches (559 mm) and a height of 39.9 inches (1,013.5 mm). Each barrier section had a height of 36.1 inches (916.9 mm) and a length of 34.1 inches (866.1 mm). Four such barrier sections were employed-two on each side of the sidewalk. All of these traffic control devices were orange, and the obstacles were employed on different portions of the sidewalk under various conditions. Obstacles were used separately under most conditions with the exception of two. The barrel and cone were combined in one condition on the wide sidewalk, and the barrier and barrel were combined in another condition on the narrow sidewalk. Figure 4 shows a diagram of all of the obstacles on the narrow and wide sections of the experimental sidewalk (not to scale).
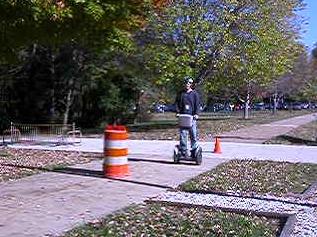
Figure 4. Illustration. Narrow and wide sections of the experimental sidewalk. As in phase I, the experimental course in phase II consisted of portions of concrete sidewalk on the grounds of FHWA's TFHRC. The wide section of experimental sidewalk was 10.2 ft (3.1 m) wide and consisted of two parts in an L-shaped configuration. The initial part of this section was 32.3 ft (9.9 m) long, and the subsequent perpendicular part was about 15 ft (4.6 m) long. The narrow section of experimental sidewalk was also 10.2 ft (3.1 m) wide, but it was restricted by white tape to 4.4 ft (1.3 m) wide. This width was selected because it fell between the minimum sidewalk widths recommended by the Americans with Disabilities Act Accessibility Guidelines for Buildings and Facilities (ADAAG) and the American Association of State Highway and Transportation Officials (AASHTO).(11,12) AASHTO recommends a 4-ft (1.2-m) minimum clear sidewalk width.(12) However, AASHTO also recommends that sidewalks less than 5 ft (1.5 m) should have passing space of at least 5 ft (1.5 m) at reasonable intervals.(13) ADAAG states that 4 ft (1.2 m) is the minimum width for a wheelchair and one ambulatory person to pass each other.(11) For this narrow sidewalk section, participants were instructed not to ride outside the white tape demarcation. This narrow section was about 30 ft (9.1 m) long. Both the wide and the narrow sections were marked with transverse strips of black tape for measuring speed by means of the downward-facing camera mounted on the SegwayTM HT. The major transverse markings were 5 ft (1.5 m) apart, and they had a distance scale painted on them for measuring lateral distance by means of the same camera. Tests were conducted on a dry concrete sidewalk in the absence of any rain, snow, or ice. The experiment took place in November 2005, with an average ambient temperature of about 58 °F (14 °C). The experimental and training sidewalks represented a closed course and were blocked to normal pedestrian traffic during testing. ProcedureBefore data collection began, participants read a brief study overview explaining the purpose of the experiment, read and signed an informed consent form, and were weighed (see appendix). Participants also watched a safety video on the proper use of the SegwayTM HT. Upon completion of this video, participants were outfitted with protective gear including a reflective vest, helmet, knee pads, elbow pads, and gloves. Novice participants received additional training for about 30-45 minutes to learn how to ride the SegwayTM HT as well as basic operations such as how to start, stop, ride forward, move backward, turn, avoid objects, and ride forward at various speeds (black and yellow speed keys). The training was devised from materials provided by the manufacturer and by tour companies who regularly train large numbers of SegwayTM HT riders. Part of this training was conducted on the same sections of sidewalk that were used in the experimental trials. The researchers used a standard procedure and checklist to confirm that novice participants were all trained to the same criteria prior to beginning their experimental trials (see appendix). During the experiment, participants always operated the SegwayTM HT in the yellow speed key, allowing a maximum speed of 8 mi/h (12.8 km/h). Before each session of trials, an environmental safety checklist was used to check the course and clear any objects or debris which might have affected SegwayTM HT operation (see appendix). Participants were instructed to proceed forward along the first part of the L-configuration sidewalk, make a right turn onto the second part of the L-configuration, proceed forward, make a U-turn, retrace their route back to the beginning, and stop. Such a drive constituted one wide sidewalk path trial under one condition. There were three different starting positions along the lateral dimension of the sidewalk so that the participants sometimes approached the first obstacle from a somewhat different angle on the first portion of each drive. Figure 5 shows one of the conditions on the wide section of the experimental sidewalk (without tape).
Figure 5. Photo. Wide section of the experimental sidewalk (without tape). Each participant started at each of these lateral positions once for each of the three trials, with the position being assigned in a random order for each experimental condition. Participants were asked to rate how comfortable and controlled the ride was at the end of each trial. These data were not analyzed and therefore are not presented in this report. The second, narrow section of the course was demarcated by white tape on a nearby stretch of sidewalk. Participants were instructed to proceed forward, stay within the bounds of the white tape markings, exit the narrow section, make a U-turn, retrace their route back to the beginning, and stop. The drive constituted one narrow path trial under one condition. Each participant completed three such trials under each experimental condition. There were three different starting positions along the lateral dimension of the sidewalk so the participants sometimes approached the first obstacle from a somewhat different angle on the first portion of each drive. Figure 6 shows one of the conditions on the narrow section of the experimental sidewalk (without tape).
Figure 6. Photo. Narrow section of the experimental sidewalk (without tape). Conditions were defined by the presence or absence of an obstacle on the sidewalk. The eight conditions for the phase II experiment were as follows:
Since three trials were completed for each condition, each participant made 24 experimental drives; however, the barrel and cone were treated as two conditions and were analyzed separately. Therefore, the total number of condition trials was 27. Upon completion of all the trials on the course, participants removed their protective gear and returned indoors. They then viewed several prerecorded videos involving the SegwayTM HT on a sidewalk and were asked to rate the scenes based on several criteria. These data were not analyzed and therefore are not included in this report. Participants were then debriefed, offered an opportunity to ask questions, paid for their participation, and released. Data AnalysisVideo files from the downward-facing camera on the SegwayTM HT were analyzed to compute the approach speed and clearance distance relative to different obstacles on the sidewalk. For straight sections of sidewalk, two measurement locations were selected for each type of obstacle: (1) the transverse black tape marking directly under the center of the obstacle and (2) the transverse black tape marking 5 ft (1.5 m) before that marking. For curved sections of sidewalk, the marking before the obstacle was at a varying distance depending on the radius of the travel path. Measurements were taken from the video files of lateral position and time of passage at each of these markings. The markings under the center of the obstacle were used to compute lateral passing distance (from the obstacle edge), and both markings were used to compute speed when approaching the obstacle. In the case of extended obstacles (walking pedestrians and longitudinal barriers), the transverse black tape marking on the sidewalk where the center of the barrel was normally placed (barrel absent) was selected as the longitudinal reference measurement location. This location represented the approximate longitudinal center of the particular test section of the straight sidewalk (wide or narrow). This location was also used to determine the baseline lateral position in the sidewalk when there were no obstacles present. In the case of the wide sidewalk section with the L-configuration, the transverse black tape marking on the sidewalk where the center of the cone was normally placed (cone absent) was selected as the longitudinal reference measurement location for the baseline condition. For the wide sidewalk condition trials, only the outbound passage of each obstacle was measured after the participants had left the starting position for that trial and before they had completed the U-turn to return back to the starting position. The wider sidewalk offered more freedom for lateral movement, and only the first passage started in a controlled manner and was less influenced by immediately preceding driving behavior. For the narrow sidewalk condition, both the first passage and the return passage were measured for each obstacle since there was less space, and clearance differences were smaller. For all obstacles, clearance distances were computed from the nearest edge of the obstacle to the nearest edge (wheel) of the SegwayTM HT. For moving obstacles (walking pedestrians), the clearance distance was computed from the estimated inside shoulder edge of the passing pedestrian to the nearest wheel of the SegwayTM HT. The travel speeds of the pedestrian and the SegwayTM HT were not synchronized at the single point of measurement. Thus, at the instant of measurement, sometimes the pedestrian was somewhat ahead of the SegwayTM, somewhat behind the SegwayTM HT, or directly adjacent to the SegwayTM HT. Consequently, for the pedestrian conditions on the wide sidewalk, passing clearance distance had to be estimated from a separately measured average inside shoulder position of 33.5 inches (850.9 mm) from the edge of the sidewalk. The pedestrian was either walking in the opposite or same direction as the moving SegwayTM HT. |
||||||||||||||||||||||||||||||||||||||||||||||