Rural Public Transportation Technologies: User Needs and Applications FR1-798
Figure 9
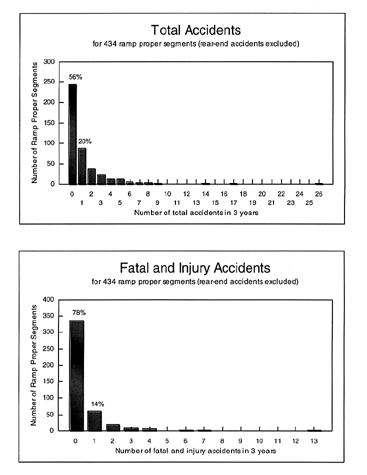
The top chart shows the number of total accidents in 3 years for 434 ramp proper segments (rear-end excluded).
The bottom chart shows the number of fatal and injury accidents in 3 years for 434 ramp proper segments (rear-end excluded).
Conversion: 1 mi = 1.61 km
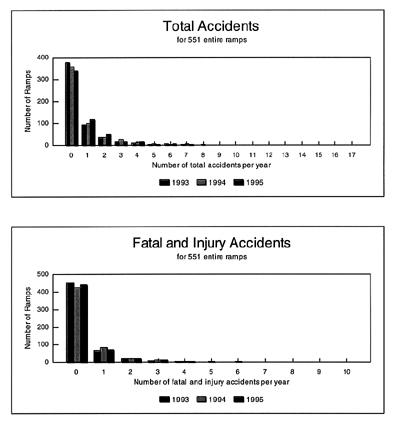
Figure 10
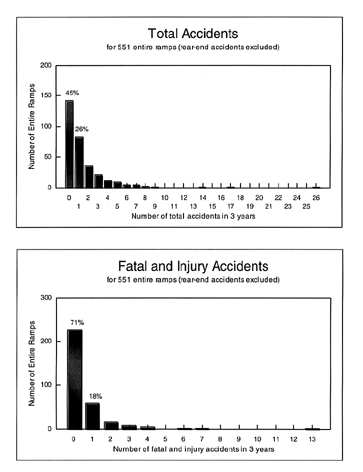
The top figure shows the total number of accidents in 3 years for 551 entire ramps (rear-end accidents excluded).
The bottom figure shows the number of fatal and injury accidents in 3 years for 551 entire ramps (rear-end accidents excluded).
Figure 11
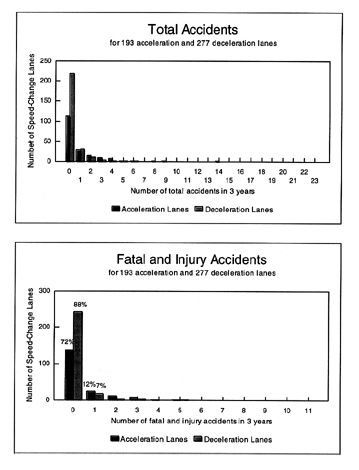
The top chart shows the number of total accidents in 3 years for 193 acceleration and 277 deceleration lanes.
The bottom chart shows the number of fatal and injury accidents in 3 years for 193 acceleration and 277 deceleration lanes.
Figure 12
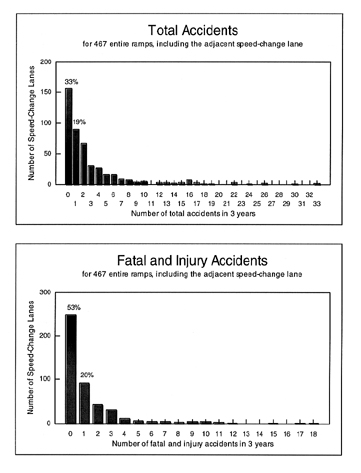
The top chart shows the number of total accidents in 3 years for 467 entire ramps, including the adjacent speed-change lane.
The top chart shows the number of fatal and injury accidents in 3 years for 467 entire ramps, including the adjacent speed-change lane.
Figure 13
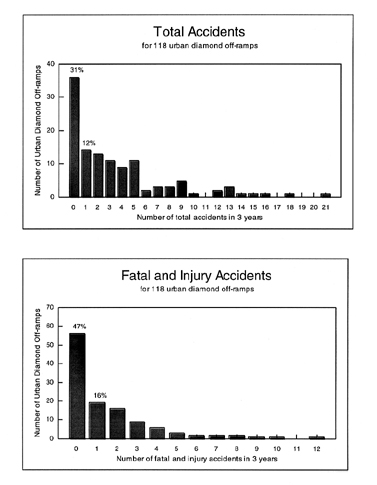
The top chart shows the number of total accidents in 3 years for 118 urban diamond off-ramps.
The top chart shows the number of fatal and injury accidents in 3 years for 118 urban diamond off-ramps.
Figure 14
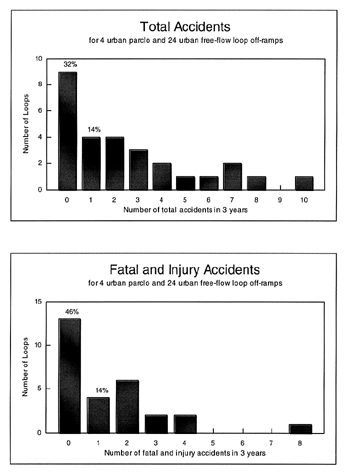
The top chart shows the number of total accidents in 3 years for 4 urban parcle and 24 urban free-flow loop off-ramps.
The top chart shows the number of fatal and injury accidents in 3 years for 4 urban parcle and 24 urban free-flow loop off-ramps.
Figure 15
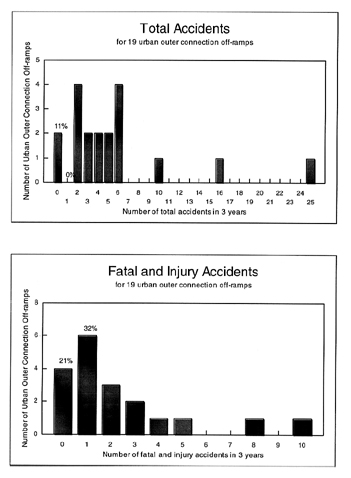
The top chart shows the number of total accidents in 3 years for 19 urban outer connection off-ramps.
The top chart shows the number of fatal and injury accidents in 3 years for 19 urban outer connection off-ramps.
Figure 16
The top chart shows the number of total accidents in 3 years for 551 entire ramps.
The top chart shows the number of fatal and injury accidents in 3 years for 551 entire ramps.
Figure 17
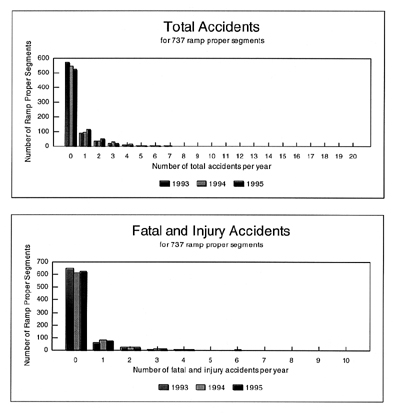
The top chart shows the number of total accidents in 3 years for 737 ramp proper segments.
The top chart shows the number of fatal and injury accidents in 3 years for 737 ramp proper segments.
Previous | Table of Contents | Top
|


