U.S. Department of Transportation
Federal Highway Administration
1200 New Jersey Avenue, SE
Washington, DC 20590
202-366-4000
Federal Highway Administration Research and Technology
Coordinating, Developing, and Delivering Highway Transportation Innovations
 |
| This report is an archived publication and may contain dated technical, contact, and link information |
|
Publication Number: FHWA-RD-97-106
|
|||||||||||||||||||||||||||||||||||||||||||||||||||||||||||||||||||||||||||||||||||||||||||||||||||||||||||||||||||||||||||||||||||||||||||||||||||||||||||||||||||||||||||||||||||||||||||||||||||||||||||||||||||||||||||||||||||||||||||||||||||||||||||||||||||||||||||||||||||||||||||||||||||||||||||||||||||||||||||||||||||||||||||||||||||||||||||||||||||||||||||||||||||||||||||||||||||||||||||||||||||||||||||||||||||||||||||||||||||||||||||||||||||||||||||||||||||||||||||||||||||||||||||||||||||||||||||||||||||||||||||||||||||||||||||||||||||||||||||||||||||||||||||||||||||||||||||||||||||||||||||||||||||||||||||||||||||||||||||||||||||||||||||||||||||||||||||||||||||||||||||||||||||||||||||||||||||||||||||||||||||||||||||||||||||||||||||||||||||||||||||||||||||||||||||||||||||||||||||||||||||||||||||||||||||||||||||||||||||||||||||||||||||||||||||||||||||||||||||||||||||||||||||||||||||||||||||||||||||||||||||||||||||||||||||||||||||||||||||||||||||||||||||||||||||||||||||||||||||||||
Rural Public Transportation Technologies: User Needs and Applications FR1-7985. STATISTICAL MODELINGThis section describes the statistical modeling of interchange ramp and speed-change lane accidents that was conducted during the research, based on the Washington data base. The discussion includes both the data preparation steps prior to the analysis and the analyses that were conducted for the various combinations of interchange elements. Data PreparationThe Washington data base, whose selection was described in section 3 of this report, contains information on geometric design features at more than 2,000 ramps located on the State highway system in Washington. Total accident frequencies on these ramps for the 3-year period from 1993 to 1995 were: 4,256 accidents in 1993; 4,548 accidents in 1994; and 4,902 accidents in 1995, for a total of 13,706 accidents over the 3-year period. Not all of these ramps and their associated accident experience could be used in statistical analyses because, as explained in section 3, traffic volume data are available for only a portion of the ramps. A preliminary assessment was made of the types of interchange elements that were in sufficient numbers and had sufficient data available for statistical modeling of accidents to be conducted. The selection of combinations of interchange elements, accident types, and geometric and traffic parameters is discussed in the following sections. Types and Combinations of Interchange ElementsThe Washington data base includes 2,046 ramps that are subdivided into 7,618 ramp segments. Of the 2,046 ramps, 1,405 ramps (68.7 percent) are located on Interstate freeways, and 641 ramps (31.3 percent) are located on non-Interstate freeways and arterials. The distribution of ramps by type of facility (Interstate/non-Interstate), ramp type (off- ramp/on-ramp, C/D road), and area type (rural/urban) is shown in table 9. Table 9. Number of Ramps by Facility Type, Ramp Type, and Area Type
A decision was made during the assembly of the data base to limit the manual data reduction from interchange diagrams, described in section 4, to the 1,405 ramps on the Interstate system. Table 10 shows the distribution of these 1,405 Interstate ramps by ramp configuration, area type, and ramp type. The first six categories of ramp configuration represent approximately 71 percent of the total number of ramps, and all analyses and statistical modeling focused on these six ramp configurations. Due to the small number of direct and semi-direct connection ramps, these two categories were pooled in all of the analyses presented in this report. When necessary in the statistical modeling because of limited sample sizes, the data for parclo loops and free-flow loops were pooled as well. The availability of volume data was a major factor in the selection of ramps for analysis. The available ramp AADT data are all based on 1993 counts. A review of the traffic volume data showed that ramp AADT was only available for approximately 54 percent of rural ramps and 72 percent of urban ramps. In addition, since many urban ramps merge or diverge from other ramps, the available traffic volume data may not apply to all parts of all ramps. Only those ramps for which traffic volume data were available and for which that traffic volume data applied to the entire length of the ramp were included in the analysis. The Washington freeway system includes a limited number of ramps that enter or exit from the left side of the mainline freeway lanes. Research has shown that left-side ramps often have higher accident experience than right-side ramps, and most interchanges are designed today with only right-side ramps. To prevent this design feature from becoming an uncontrolled factor in the analysis, a decision was made to exclude the few left-side ramps from all analyses. The final selection of ramps for inclusion in statistical modeling was based on the following criteria. The ramp had to:
A total of 551 ramps met all of these criteria. The characteristics of these 551 ramps are summarized in table 11. Table 10. Number of Interstate Ramps by Ramp Configuration, Area Type, and Ramp Type
Table 11. Number of Entire Ramps by Ramp Configuration, Area Type, and Ramp Type
Statistical modeling was also performed for speed-change lanes. It was found that there was a total of 588 conventional deceleration lanes and 571 conventional acceleration lanes on the Interstate system in Washington. These counts do not include speed-change lanes at ramps where mainline freeway lanes are added or dropped and do not include speed-change lanes that are part of mainline freeway weaving areas connecting two ramps. As in the case of ramps, speed-change lanes were selected for analysis only if cross-section data for the speed-change lane were complete, traffic volume data were available for the adjacent ramp, and the speed-change lane was located on the right side of the freeway. A total of 277 deceleration lanes and 193 acceleration lanes met these criteria. As explained in section 4, the Washington data base was originally structured as data records for relatively short homogeneous sections of ramps. During the data preparation, this data base was restructured to classify each segment type and to join those segments with identical (or nearly identical) cross-section geometrics. Only limited geometric data could be considered in analyses of the 551 ramps summarized above in table 11 because it is common for the cross-section geometrics of a ramp to change along its length. For example, it is not uncommon for lanes to be added or dropped on a ramp or for the lane and shoulder widths to change. In order to consider the effects on accidents of those cross-section geometric variables, it was necessary to analyze individual ramp segments rather than the ramp as a whole. The analyses focused on segments of the "ramp proper," which excluded from consideration speed-change lanes and merge, diverge, or weaving areas on the ramp. A total of 737 ramp proper segments met the criteria for inclusion in the analysis. This is larger than the number of ramps considered (551) because some ramps may have included more than one ramp proper segment that met the criteria for inclusion in the analyses. Table 12 summarizes the characteristics of the 737 ramp proper segments selected for analysis. Table 12. Number of Ramp Proper Segments by Ramp Configuration, Area Type, and Ramp Type
A careful distinction in terminology is needed because both ramps as a whole and ramp segments with homogeneous cross sections have been analyzed. Throughout this report, the term "entire ramps" refers to the analysis of all or any subset of the 551 ramps for which the ramp as a whole was considered, and the term "ramp proper segment" refers to the analysis of all or any subset of the 737 ramp segments that have homogeneous cross sections. Based on the selection criteria presented above and the availability of sufficient sample sizes in the Washington data base, statistical modeling of accidents was performed for the following combinations of interchange elements:
Safety Measures of Effectiveness (Dependent Variables)The available accident data base included all accidents that occurred on each ramp and speed-change lane. Accident mileposts along the ramp and speed-change lane allowed each accident to be assigned to a particular ramp segment with particular geometric features. The analyses performed in this research focused on total accidents, including both single- and multiple-vehicle accidents. The conceptual plan developed for the FHWA Interactive Highway Safety Design Model (IHSDM) recommended that only multiple-vehicle accidents be addressed in statistical models and that the frequency of single-vehicle run-off-road accidents be predicted using an encroachment-based technique rather than a statistical model.(24) However, the statistical models in this report are based on accident frequencies including both single- and multiple-vehicle accidents. The modeling efforts in the research addressed both total accidents (for all accident severity levels combined) and fatal and injury accidents. Property-damage-only (PDO) accidents were not analyzed separately because of concerns about incompleteness of accident reporting. It might have been desirable to evaluate PDO tow-away accidents (accidents in which one or more of the involved vehicles was towed from the scene) or fatal-plus-injury-plus-tow-away accidents, but, unfortunately, the available accident data for Washington do not explicitly identify tow-away accidents. In summary, the two dependent variables most extensively used in the modeling effort were:
In most cases, each analysis was performed for both dependent variables. However, in a few cases where the available sample size of fatal and injury accidents was limited, models were developed for total accidents only. One preliminary analysis effort toward better understanding the nature of ramp and speed-change lane accidents was to develop an accident typology (i.e., to examine the distribution of accident types and circumstances). Appendixes B and C present the results of this effort. Appendix B presents accident severity distributions by ramp segment type; appendix C presents accident type distributions by ramp segment type. The results presented in these appendixes are discussed in greater detail in the next section on accident frequency distributions. During the review of the interchange diagrams described in section 4, it was recognized that there was no explicit method to identify ramp-related accidents that occurred at crossroad ramp terminals. Ramp mileposting was then used to identify accidents that occurred at:
The accidents so identified occurred within the curb-line limits of the ramp terminal. These classifications were used in the development of appendix C. However, no direct method could be found to identify accidents that occurred on the ramp proper, away from the crossroad ramp terminal, but that were related to the operation of the crossroad ramp terminal. It was noted in the review of the data in appendix C that a substantial proportion of the accidents on off-ramps were rear-end accidents. It was postulated that many of the accidents might be related to collisions at the rear of a queue backed up from the crossroad ramp terminal. If so, it would be potentially misleading to attribute these accidents to the geometrics of the ramp or ramp proper segment on which they occurred, rather than to the ramp terminal itself. To investigate this issue, a sample of 100 rear-end accidents on ramps was selected, and the hard-copy police accident reports for those accidents were obtained and reviewed. Only 5 of these 100 accidents involved rear-end collisions that were not related to the operation of the crossroad ramp terminal. Therefore, to avoid confounding analysis results for ramps with accidents related to the ramp terminal rather than to the ramp itself, it was decided to perform selected analyses, excluding all rear-end accidents from the dependent variable. Selection of Geometric and Traffic Parameters of Interest (Independent Variables)For each of the interchange elements mentioned above, a preliminary selection of geometric and traffic variables as candidate independent variables for the statistical modeling activities was made from among the variables included in the existing Washington data base (see table 5) and the additional variables obtained from the interchange diagrams (see table 7), based on engineering knowledge and statistical criteria. The new variables shown in table 8 were added at a later stage in the analysis when they became available. A few of the candidate independent variables were quantitative variables measured on a continuous scale (e.g., AADT, lane width, or shoulder width); however, most of the candidate independent variables were categorical (i.e., having a finite number of discrete levels). Appendix A identifies whether each candidate variable was continuous or categorical in nature and also identifies the levels for each categorical variable. To determine which of the candidate independent variables were suitable for use in the statistical modeling activities, frequency tables were generated for each candidate variable. When the available sample size for any given level of any particular variable was too small, one of the following courses of action was taken: (1) the observations (i.e., ramps, ramp segments, or speed-change lanes) at that level were pooled with an adjacent level (where this made engineering sense) or (2) the observations at that level were deleted. After all levels of all categorical variables were reviewed, the process was repeated to ensure that all the sample sizes were now sufficient for data analysis. Any further minor changes found to be necessary were then made. If, for a particular categorical independent variable, all but a small number of the observations fell in a single category, then that variable had to be excluded from the modeling effort, because no effect can be determined unless a substantial number of observations fall in each level. Ramp AADT data were included in all statistical models. For selected analyses, the AADT for the mainline freeway section adjacent to the ramp or speed-change lane was considered for inclusion in the models as well. Previous | Table of Contents | Next | Top
Accident Rates and Frequency DistributionsOf the 1,405 Interstate freeway ramps in the Washington data base, 690 were off-ramps and 687 were on-ramps (see table 9). After excluding all left-side ramps and those ramps without available traffic volume data, a total of 356 off-ramps and 287 on-ramps remained in the data base, for a total of 643 entire ramps. Subsequent analyses focused only on ramp configurations that were present in sufficient numbers for a proper analysis to be conducted. There were five such ramp configurations:
Of the 643 ramps discussed above, 551 ramps (86 percent) had 1 of these 5 ramp configurations. For each ramp configuration, an average accident rate was computed based on the number of accidents in the 3-year period, the estimated AADT, and the length of each ramp. The 3-year accident frequencies and accident rates corresponding to these 643 ramps are shown in tables 13 and 14 for total and fatal and injury accidents, respectively. The tables identify, by means of a footnote, those accident rates that should be interpreted cautiously because they are based on fewer than 10 accidents. Tables 13 and 14 show patterns in accident rates that are similar to those from the literature shown in table 3. The data show that off-ramps generally have higher accident rates than on-ramps, and diamond ramps (which are relatively straight) have lower accident rates than loop ramps (which are curved). There appears to be an exception for urban, free-flow loop ramps, generally found in cloverleaf interchanges, which had lower accident rates than diamond ramps for both off-ramps and on-ramps. The 3-year accidents were further examined at each (homogeneous) ramp segment type for eight selected ramp configurations:
Previous | Table of Contents | Next | Top
Table 13. Total Accident Frequencies and Rates for Entire Ramps by Ramp Configuration, Area Type, and Ramp Type (1993-1995)
Conversion 1 mi = 1.61 km
Table 14. Fatal and injury Accident Frequency and Rates for Entire Ramps by Ramp Configuration, Area Type, and Ramp Type (1993-1995)
Conversion 1 mi = 1.61 km
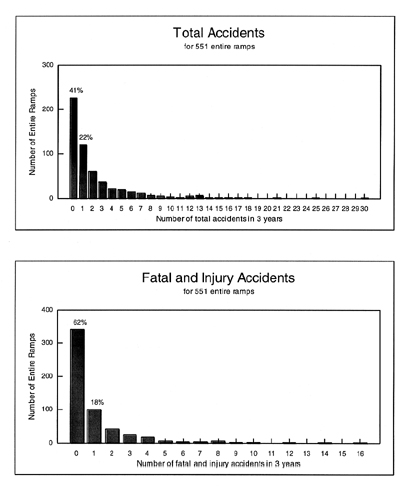
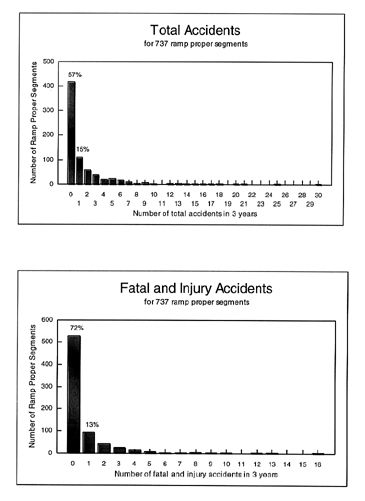
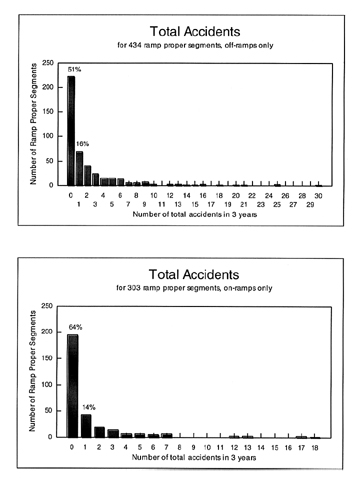
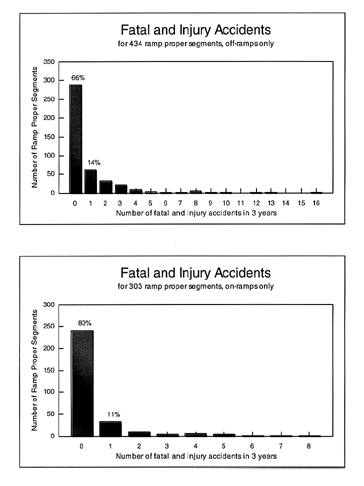
Appendix B presents accident severity distributions (fatal, injury, and property-damage- only accidents) by ramp segment type for these selected ramp configurations. Appendix C presents accident-type distributions (single-vehicle noncollision, single-vehicle collision, and multiple-vehicle accidents) by ramp segment type for these same ramp configurations. Prior to beginning the statistical modeling activities, the general shape of each accident frequency distribution (total and fatal and injury) was assessed for entire ramps and for ramp proper segments. This was done visually by plotting the data for the 3-year totals and by calculating basic statistics. Total and fatal and injury accident frequencies are plotted in figures 5 and 6 for entire ramps and for ramp proper segments, respectively. Figures 7 and 8 further juxtapose accident frequencies at ramp proper segments between off-ramps and on-ramps. The plots shown in figures 5 through 8 highlight the shapes of accident frequencies. With a large number of ramps or ramp proper segments with no or very low accident experience, these distributions tend to follow a Poisson distribution. Similar frequency distribution plots are shown in figures 9 through 15 in appendix D for the following interchange elements:
In addition, 1-year accident frequencies are presented in figures 16 and 17 in appendix D for the 551 entire ramps and the 737 ramp proper segments, respectively, studied in this report, comparing the 3 years of data for 1993 through 1995.
Figure 8. Fatal and Injury Accident Frequency Distributions for Ramp Proper Segments: Off-Ramps vs. On-Ramps Previous | Table of Contents | Next | Top
Loglinear Regression Models Several candidate analysis methods were investigated for application to the accident frequencies in the various combinations of interchange elements considered in this study. The analysis approach was driven by both the actual distribution of the accident frequencies and by recommendations and evolving practices in the field of accident data analysis (see section 2). The frequency distributions of total and fatal and injury accidents in the 3-year study period are shown in figures 5 through 8 above and in appendix D. A recurrent challenge in accident analysis of highway elements is that most sites experience very few accidents. The percentages of interchange elements with zero or one accident in the 3-year period are:
For most types of interchange elements, most sites experienced no more than one accident over the 3-year period. This is true especially for fatal and injury accidents. The large number of sites with zero or one accident over the 3-year study period, combined with the highly skewed distributions of accident frequencies (see figures 5 through 8 and appendix D), made it difficult to fit a statistical distribution model to the data. Modeling accidents to the small data sets for urban parclo and free-flow loop off-ramps and to urban outer connection off-ramps was particularly difficult given the erratic shape of their distributions as shown in appendix D. Loglinear regression models were applied to the accident data in this study. They included Poisson and negative binomial regression models. Although Poisson regression models were applied in preliminary analyses of the data, it was found that all models were improved by applying the negative binomial models, and only their results are shown in this report. Statistical background on both the Poisson and negative binomial models is provided next. Consider a set of n interchange elements from a given category (e.g., ramp proper segments, entire ramps). Associated with each element i is a set of q parameters (Xi1, Xi2, ..., Xiq) describing the geometric design, traffic volume, and other related characteristics of that element. Let the number of accidents occurring at the ith element during a 3-year period be denoted by Yi, where i=1, ..., n. Next, denote by yi the actual observation of yi during the 3-year period, i.e., yi = 0, 1, 2, ... and i=1, ..., n. The objective of a statistical model is to provide a relationship between a function of the expected number of accidents, E(Yi)=æi, at the ith element and the q parameters, Xi1, Xi2, ..., Xiq. This relationship can be formulated through a general linear model of the form: Function(mi) = b1Xi1 + ... +bqXiq (2) where the regression coefficients, b0, b1, b2, ... bq, are to be estimated from the data. The estimation procedure used to obtain the regression coefficients is dependent on the assumption made about the distribution of the Yi. Note: Throughout this report, all logarithms are natural logarithms and are denoted by log in all equations. In the present study, two loglinear models were considered for application to the accident frequencies at interchange elements the Poisson and the negative binomial models. Their general forms are described below. Poisson Regression ModelWhen the average number of accidents at a ramp is small, the assumption of a lognormal distribution [i.e., the assumption that log(Yi) follows a normal distribution] is not valid. The Poisson model then becomes a natural choice as it models the occurrence of rare discrete events well. The relationship between the expected number of accidents occurring at the ith ramp and the q ramp parameters, Xi1, Xi2, ..., Xiq, is assumed to be of the form: q log(mi) = b0 + å bjXij (3) j=1 The assumption is made that the number of accidents, Yi, follows a Poisson distribution with mean m. That is, the probability that a ramp defined by a known set of predictor variables, Xi1, Xi2, ..., Xiq, experiences yi accidents can be expressed as: P(Yi = yi;mi) = miyie-mi / yi! (4) where yi! denotes the factorial of yi Note that the Poisson distribution has only one parameter, namely its mean, , with the limitation that the variance, s2, equals the mean of the distribution. Under the assumption of a Poisson distribution, the regression coefficients, b0, b1, b2, ... bq, are estimated by the maximum likelihood method. The asymptotic normality of maximum likelihood estimates is used to obtain tests of significance of the parameters and goodness-of-fit measures for the models. In the case of a Poisson distribution, the model coefficients are estimated by the maximum likelihood method. The likelihood function is the product of the terms in equation (3) over all n interchange elements in the category of elements of interest. This function is viewed as a function of the parameters mi and, through them, the parameters bi. The parameters are estimated by maximizing the likelihood, or more usually, by maximizing the logarithm of the likelihood (denoted by log likelihood). Equivalently, the estimation can be done by minimizing the negative of the log likelihood. The log likelihood is given by the equation: n log(L) = å [yilog(mi) - mi - log(yi!)] (5) i=1 The maximum value possible for the likelihood for a given data set occurs if the model fits the data exactly. This occurs if mi is replaced by yi in equation (2). The difference between the log-likelihood functions for two models is a measure of how much one model improves the fit over the other. A special case of this was defined by Nelder and Wedderburn as the deviance.(25) Specifically, they defined the deviance as minus twice the log of the ratio of the likelihood for a model to the maximum likelihood. For the Poisson distribution, the deviance takes the form given in equation (6): n n D = 2[ å yiln(yi/mi) - å (yi - mi)] (6) i=1 i=1 where the second term is identically zero in the usual case that the model includes a constant or intercept term. The deviance so defined is measured from that of the saturated model and so terms involving constants, the data alone, or a scale factor alone are omitted. For a sample of n independent observations, the deviance for a model with p degrees of freedom (that is, p parameters estimated, including the mean or constant) has residual (n p) degrees of freedom. When the residual degrees of freedom of the current model are approximately equal to the deviance, it is unlikely that further fitting of systematic components is worthwhile. Since the deviance is effectively -2 times the log of the likelihood ratio, it has an asymptotic distribution that is chi-squared with degrees of freedom equal to n p, where n is the number of interchange elements and p is the number of parameters estimated. This result can be used to construct a goodness-of-fit test for the model. In addition, by forming the ratio of the deviance to its residual degrees of freedom, an estimate of the scale constant can be found. For the Poisson distribution, this should theoretically be equal to one. Values substantially in excess of one reflect overdispersion of the data. Negative Binomial Regression ModelAs mentioned above, a limitation of the Poisson distribution is that the mean equals the variance of the distribution. Previous work in the field of accident research has shown that this is not always the case. Suppose a Poisson model is used for modeling accidents and the variance (or dispersion) of the data exceeds the estimated mean of the accident data distribution. The data are then said to be overdispersed, and the underlying assumption of the variance being equal to the mean for the Poisson distribution is violated. The negative binomial, which is a discrete distribution, provides an alternative model to deal with overdispersion in count data such as accident frequencies. Unlike the Poisson distribution, the negative binomial distribution has two parameters. As for the Poisson model above, the relationship between the expected number of accidents occurring at the ith element and the q parameters, Xi1, Xi2, ..., Xiq, is still taken to be: Function(mi) = b0 + b1Xi1 + b2Xi2 + ... + bqXiq (7) However, the assumption is now made that the number of accidents, Yi, follows a negative binomial distribution with parameters a and k (with 0 £ a £ 1 and k ³ 0). That is, the probability that a ramp defined by a known set of predictor variables, Xi1, Xi2, ..., Xiq, experiences Yi = yi accidents can be expressed as: (yi + k - 1)! ayi Pr(Yi = yi; a,k) = ------------------- ------------------- ; yi = 0,1,2..... (8) yi!( k - 1)! (1 + a)yi+k where yi! denotes the factorial of yi. The mean and variance of the negative binomial distribution of accident counts can then be expressed in terms of the parameters a and k as follows: mean = E(Y) = mi = ka, and (9) variance = Var(Y) = ka + ka2 = mi + mi2/k (10) The term mi can be referred to as the Poisson variance function and mi2/k as the extra component arising from combining the Poisson distribution with a gamma distribution for the mean to obtain the negative binomial distribution. The parameter k is not known a priori, but can be estimated so that the mean deviance becomes unity or the Pearson chi- square statistic equals its expectation (i.e., equals its degrees of freedom).(26) As for the Poisson model, the model regression coefficients, b0, b1, b2, ... bq, are estimated by the method of maximum likelihood. The asymptotic normality of maximum likelihood estimates is used to obtain tests of significance of the parameters and goodness-of-fit measures for the models. The estimation of the model parameters can be done by minimizing the negative of the log likelihood. For the negative binomial distribution, the log likelihood is given by the equation: n log(L) = å yilog[a/(1 + a)] - nk log (a + a) + function of yi,k) (11) i=1 Substituting a = mi/k into the term log[a/(1+a)] of equation (11), gives the function log (mi / ( mi + k )) = b0 + b1Xi1 + b2Xi2 + ... + bqXiq (12) The parameters a and k of the negative binomial distribution can thus be indirectly estimated using a generalized linear model and, by means of equations (7) and (12), the model regression coefficients, b0, b1, b2, ... bq, are obtained. SAS provides a procedure PROC GENMOD (a generalized linear model procedure) that can be used to estimate the regression coefficients by implementing equations (8) and (12).(27) Treatment of Traffic Volume Variables in Loglinear Regression ModelsIn all models in this study, the natural logarithm of the AADT was used. The AADT applies to the interchange elements (e.g., ramp proper segment, entire ramp) considered in the models. In the special case of modeling accidents at the combination of a ramp and its adjacent speed-change lane, the mainline freeway AADT was also included in the models, again in the logarithmic form. This parallels the approach taken by other researchers where accident counts rather than accident rates are modeled. On the log-scale, the ratio of accident counts over AADT becomes the difference between log(accident counts) and log(AADT). The difference here is that it is assumed that the coefficient of log(AADT) is not equal to one, but rather is a coefficient to be estimated through analysis. Thus, in the Poisson and negative binomial models described above, X1 generally represents log(AADTramp). The multiplicative model relating the expected accident counts and independent variables can thus be rewritten as: function(mi) = exp(b0)(AADTramp)b1 exp(b2Xi2)· ... · exp(bqXiq) (13) Previous | Table of Contents | Next | Top
Accident Modeling ResultsThe following sections present the modeling results separately for each of the seven selected interchange elements or combinations of elements:
All of the models presented below are based on data for only the five ramp configurations shown in tables 13 and 14. Some analyses were limited to only one or more of these five ramp configurations. Other ramp configurations, such as buttonhook ramps and slip ramps to parallel frontage roads, were not considered in the modeling because the available sample sizes of ramps and accidents were too limited. Ramp proper Segments (Including All Accidents)An analysis of ramp proper segments was conducted first, because only a segment- based analysis can include many of the key cross-section geometric variables of interest. These variables cannot be included in the analysis of entire ramps, which is presented later, because the cross-section geometrics often vary over the length of the ramp. The first step in the analysis of ramp proper segments was to select candidate independent variables for that particular group of interchange elements. Both engineering judgment and sample size requirements for the levels of each candidate variable were involved in the decision of whether a particular variable was included in the modeling effort. In addition to a number of variables chosen for consideration as main effects, the interaction between ramp type (off/on) and ramp configuration was considered in the modeling. For two categorical variables, the levels were pooled across those categories with only small numbers of ramp segments. These were:
Table 15 identifies the independent variables and the interaction selected for modeling accident frequencies at the 737 ramp proper segments. The independent variables considered were:
The dependent variables are 3-year accident frequencies by severity level for accidents of all types. This table also provides descriptive statistics for three types of variables: (1) total and fatal and injury accident frequencies in the 3-year study period (i.e., the dependent variables for the modeling effort); (2) all continuous independent variables considered; and (3) all categorical independent variables considered. Minimum, mean, median, and maximum values are given for the first two types of variables. Three-year totals are given for all accident frequencies, and the total length of ramp proper segments included in the models is given as well. For all categorical variables and for the interaction term, the percent of ramp proper segments within each level is given. Next, using all the continuous and categorical variables and interaction term shown in table 15, a negative binomial (NB) regression model was fit separately to the data for total and fatal and injury accidents. These models are called full models because all of the candidate independent variables are included. Table 15. Descriptive Statistics for Ramp Proper Segments
Conversion: 1 mi = 1.61 km, 1 ft = 0.305 m. The NB regression analyses were performed using the GENMOD procedure with the NB distribution and the appropriate deviance functions and variance adjustment factor, k, of the SAS statistical software package.(26,27) This procedure fits generalized linear models as defined by Nelder and Wedderburn and uses the maximum likelihood procedure to estimate the values of the regression coefficients. The GENMOD procedure can be customized for many distributions, including the NB distribution used here. The significance of each regression coefficient was examined. Generally, the analysis results for the full model found some independent variables to be statistically significant at the 10-percent significance level and other variables not to be statistically significant. To obtain the best estimates of the regression coefficients for the independent variables that are statistically significant and the best estimate of the goodness of fit of the model as a whole, the NB regression model was fit again, including only those independent variables that were found to be statistically significant in the full model (i.e., the independent variables and/or interaction that were found not to be statistically significant were dropped). This model is called the reduced model. The choice of a 10-percent significance level (or a 90-percent confidence level) reflects a moderately restrictive approach in the selection of independent variables that might significantly contribute to the variability in accidents. Many previous accident research efforts have used the more restrictive 5-percent significance level, which would generally include fewer independent variables in the predictive models. Thus, the choice of a 10-percent significance level retained some variables that would not have been statistically significant at the 5-percent level. Since this step in the effort to identify statistically significant variables serves primarily as a screening step, this approach was considered appropriate. The text of the report identifies those independent variables that were found to have significance levels between 10 percent and 20 percent. This significance level, à, is shown for each such variable. In selected cases in which it was considered appropriate, such variables were included in models presented in this report; however, the contractors generally tried to avoid including independent variables with significance levels above 10 percent. Throughout the report, the following format was adopted in presenting the modeling results. The list of all the independent variables, including interactions, considered in the full models is shown in the descriptive statistics table in each section of the report. The subsequent model diagnostics table in each section of the report presents model diagnostics for both the full and reduced models. In particular, the model diagnostic table identifies the number of parameters (i.e., independent variables) retained in the reduced models as well as identifying any interaction effects included in the reduced models. The specific variables and interactions remaining in the reduced model are shown in the regression results tables for total and fatal and injury accidents, respectively. Table 16 shows various model diagnostics for the full and reduced NB regression models. The model diagnostics, which are shown separately in table 16 for each type of accident considered, include both basic statistics and goodness-of-fit criteria. Table 16. Model Diagnostics for Total and Fatal and Injury Accidents on Ramp Proper Segments
a) Includes the ramp type by ramp configuration interaction. b) Does not include interation term. c) Includes 1 degree of freedom for the intercipt and 4 degrees of freedom for interation. d) A goodness-of-fit parameter based on the Freeman-Tukey variance stabilizing transformation of variables. The following model statistics are shown:
Two goodness-of-fit measures, the mean deviance and the Pearson chi-square ratio (the Pearson chi-square value divided by its degrees of freedom), were used jointly to assess the fit of each model. The use of these criteria to evaluate the goodness-of-fit of these models is also discussed in Miaou.(29) In all NB regression models developed in this report, the variance adjustment factor, k, was selected to achieve an NB model for which the data show neither overdispersion nor underdispersion, as measured by the mean deviance (e.g., close to one). In addition, if the Pearson chi-square ratio is between 0.8 and 1.2, this is generally an indication that the model can be assumed to be appropriate in modeling the data. Table 16 shows that the Pearson chi-square ratio (full model) is approximately 1.15 for total accidents and 1.62 for fatal and injury accidents. Two additional goodness-of-fit criteria are provided by R2 and R2FT. These values range between approximately 15 percent and 16 percent for total and fatal and injury accidents. The reduced model statistics for the NB reduced regression model are shown in the last column of table 16. Of the nine original independent variables considered, only four and the interaction term remain statistically significant in the reduced NB model for total accidents. Of the same set of nine variables, only six and the interaction term remain statistically significant in the final model for fatal and injury accidents. The Pearson chi- square ratios equal approximately 1.14 for total accidents, a value within the acceptable range of 0.8 to 1.2, showing that the choice of the NB model appears appropriate for total accidents. The Pearson chi-square ratio remains unchanged at 1.62 for fatal and injury accidents, a value well outside the acceptable range, showing that the NB model does not provide an adequate fit to the data. The two additional measures of goodness of fit, R2 and R2ft, range between 13 percent and 15 percent for either type of accident, indicating that these reduced NB models explain only a small fraction of the variance in accident frequencies. Of the five independent variables considered in the full, but not reduced, NB model for total accidents, only two variables right shoulder width (a=0.14) and ramp configuration (a=0.15) were not significant at the 10-percent significance level, but would have been significant at the 20-percent level. Note that although ramp configuration is not a statistically significant variable on its own merit, the interaction term ramp type by ramp configuration is significant. In the model for fatal and injury accidents, none of the variables that were not statistically significant at the 10-percent significance level would have been significant at the 20-percent level. Tables 17 and 18 summarize the regression results for the reduced NB model for total accidents and fatal and injury accidents, respectively. Each table identifies the:
Table 17. Negative Binomial Regression Results for Total Accidents on Ramp Proper Segments
NOTE: This analysis is based on the set of 737 ramp proper segments for which summary are shown in table 19. Conversion: 1 mi = 1.61 km. a) All variables significant at the 90% conidence level or higher. b) Chi-square lielihood ratio statistic for testing the significance of the effect of the variable, with 1 degree of freedom for continuous variables and (p-1) degrees of freedom for categorical variables with p levels. c) Direction of effect: I = Inverse of expected direction. d) Relative effect of unit change in the variable on the expected number of accidents, equals exp(coefficient). e) 90% lower and upper confidence limites of the estimated coefficient. Table 18. Negative Binomial Regression Results Fatal and Injury Accidents on Ramp Proper Segments
NOTE: This analysis is based on the set of 737 ramp proper segments for which summary are shown in table 19. a) All variables significant at the 90% conidence level or higher. b) Chi-square lielihood ratio statistic for testing the significance of the effect of the variable, with 1 degree of freedom for continuous variables and (p-1) degrees of freedom for categorical variables with p levels. c) Direction of effect: I = Inverse of expected direction. d) Relative effect of unit change in the variable on the expected number of accidents, equals exp(coefficient). e) 90% lower and upper confidence limites of the estimated coefficient.
To predict the average accident frequency at ramp proper segments, the regression coefficients, b0, b1, b2, ... bq, are replaced with the estimated values found in the table, and the variables, X1, X2, ..., Xq, are replaced with their appropriate values or levels. For example, the expected 3-year total accident frequency can be estimated using the model presented in table 17 as: Y = e-9.81 (X1)0.93 exp(5.76X2) exp(0.78X3) exp(0.77X4) exp(0.56X5) exp(0.66X6) exp(1.09X7) exp(0.72X8) (14) exp(0.29X9) exp(-0.05X10) where: Y = expected number of total accidents in a 3-year period at ramp segments X1 = AADT of the ramp segment (veh/day) X2 = length of the ramp segment (mi) X3 = 1 if the ramp segment is on an off-ramp; 0 otherwise X4 = 1 if the ramp segment has 1 lane; 0 otherwise X5 = 1 if the ramp segment is on a diamond off-ramp; 0 otherwise X6 = 1 if the ramp segment is on a loop off-ramp; 0 otherwise X7 = 1 if the ramp segment is on an outer connection off-ramp; 0 otherwise X8 = 1 if the ramp segment is on a diamond on-ramp; 0 otherwise X9 = 1 if the ramp segment is on a loop on-ramp; 0 otherwise X10 = 1 if the ramp segment is on an outer connection on-ramp; 0 otherwise Note that when the level of a categorical variable is 0, the multiplicative term in equation (14) becomes e0 = 1, and it is therefore omitted from the model. The relative effect of each variable (all other variables being held constant) can be calculated by simply taking the exponent of the corresponding coefficient. For example, the relative effect of the difference in accident frequency between ramp segments on off- ramps and ramp segments on on-ramps is exp(0.78) = 2.18. In other words, off-ramps tend to have more accidents than on-ramps by a factor of 2.18 or by 118 percent. The relative effect of the ramp AADT variable is more difficult to interpret since the relative effect of 2.54 means that an increase of one unit in the natural logarithm of the AADT would increase accidents by 154 percent. The results of the NB regression modeling shown in tables 17 and 18 indicate that ramp AADT has a far stronger relationship to accident frequency than any other variable. For the total accident model in table 17, the other statistically significant variables, in descending order of their relationship to accident frequency, are segment length, ramp type, number of lanes, and the interaction of ramp type and ramp configuration. The effects of all of these variables are in the direction that would be expected based on existing knowledge about interchange safety. The segment length variable in the model, which is statistically significant, represents primarily an exposure effect. In other words, this variable would be expected to be statistically significant because longer segments would be expected to have more accidents. The statistical significance of the ramp AADT variable is expected because the literature has consistently shown traffic volumes to be the strongest predictor of accidents. The ramp AADT variable, in part, represents exposure because, as the traffic volume on the ramp increases, there are more opportunities for accidents to occur. However, the traffic volume is also a surrogate for congestion and, thus, accident frequencies may increase as the possibility of congestion increases. The ramp type and number of lanes variables are statistically significant, indicating that ramp segments of off-ramps have more accidents than comparable ramp segments of on-ramps and that ramp segments on single-lane ramps have more accidents than ramp segments on multilane ramps. The model in table 17 includes the significant main effect of the ramp type variable and the interaction of ramp type by ramp configuration without including the main effect of ramp configuration. This indicates that there is an overall ramp-type effect, regardless of ramp configuration, while there is no overall ramp configuration effect. The significance of the interaction between ramp type and ramp configuration indicates that each combination of ramp type and ramp configuration has a unique effect on accident frequency that cannot be adequately explained by separate ramp type and ramp configuration effects. This means that the difference in safety performance between on- and off-ramps depends on the ramp configuration (i.e., diamond, loop, outer connection, or direct or semi-direct connection). In other words, for example, the difference in safety performance between diamond on-ramps and diamond off-ramps is not the same as that between loop off-ramps and loop on-ramps. Thus, each of the eight possible combinations of the two ramp types and the four ramp configurations requires its own term in the overall predictive equation of accident frequency [e.g., equation (14)]. The interaction effect shows an influence on accident frequency over and above the effect of ramp type alone, which is also statistically significant, as shown in table 17. The coefficients shown in table 17 can be used to quantify these effects as illustrated in equation (14). The model for fatal and injury accidents shown in table 18 is similar to the model for total accidents in table 17 in that many of the same independent variables are statistically significant. One difference is that the main effects of both ramp type and ramp configuration, as well as their interaction, are statistically significant. In addition, the effect of right shoulder width is also statistically significant, except that the direction of this effect is opposite to that expected since it implies that there are more accidents on ramps with wider shoulders. Inverse effects of this kind are only too common in accident modeling and may indicate that, in this situation, shoulder width serves as a surrogate for some other variable for which data are not available. This apparently inverse effect is disappointing because determining the effects on accidents of geometric variables like shoulder width was one of the primary objectives of the research. Previous | Table of Contents | Next | Top
Ramp Proper Segments, Off-Ramps Only (Excluding Rear-End Accident)As explained earlier in this section, it was found that most of the rear-end accidents on off-ramps were related to the operation of the cross-road ramp terminal and not to the geometrics of the ramp proper. Therefore, a decision was made to model accidents on off- ramps using a dependent variable that excluded rear-end accidents and other accidents related to the cross-road ramp terminal. It was hoped that this approach could increase the explanatory power of the models, because the extraneous influence of the cross-road ramp terminals on the safety performance of the ramp would be excluded. Of the 737 ramp segments used in the development of the previous model, a total of 434 segments (59 percent) were located on off-ramps. The 3-year average number of total accidents dropped from 2.04 to 1.14 accidents per ramp after excluding the rear-end accidents. The 3-year average number of fatal and injury accidents dropped from 0.90 to 0.41 accidents per ramp after excluding the rear-end accidents. Similarly, the 3-year total accident frequency dropped from 884 to 494 total accidents and from 390 to 178 fatal and injury accidents. The approach to modeling of total and fatal and injury accidents on ramp proper segments, excluding rear-end accidents, was identical to that for all accidents on ramp proper segments discussed above. The distribution of these accidents is shown in figure 9 in appendix D. The selection of independent variables was done in a similar fashion to that described earlier. Table 19 identifies the variables selected for modeling accidents on ramp segments. The independent variables considered were:
Since only off-ramps are included in this analysis, consideration of the interaction between ramp type and ramp configuration was unnecessary. As before, parclo loops and free-flow loops were pooled into a single category. As shown in table 19, eight independent variables, both continuous and categorical, were considered in the full NB model. Of these eight variables, five were found to have a statistically significant effect on accidents (bothtotal and fatal and injury) at the 10-percent significance level. A reduced NB model was then rerun using only the five statistically significant variables. Table 19. Model Diagnosics for Total and Fatal and Injury Accidents for Ramp Proper Segments of Off-Ramps (Rear-End Accidents Excluded
Conversion: 1 mi = 1.61 km, 1 ft = 0.305 m. The second column in table 20 shows the NB model statistics for the full model. The Pearson chi-square statistic of 1.28 is just outside the acceptable range for total accidents, and with a value of 1.72, far exceeds the acceptable upper limit of 1.2 for fatal and injury accidents. As was the case in the previous analysis of ramp proper segments, this shows that the NB model provides a reasonable choice for total accidents, but not for fatal and injury accidents. The two goodness-of-fit criteria, R2 and R2ft, are relatively low, with values of approximately 17 percent and 20 percent for R2 and approximately 16 percent and 11 percent for R2ft. The third column in table 20 shows the NB model statistics for the reduced model, using only the five statistically significant variables. The Pearson chi-square statistics changed slightly from the full model, with values of 1.22 and 1.73 for total and fatal and injury accidents, respectively. Again, this shows that the NB model provides a reasonable choice for total accidents, but not for fatal and injury accidents. The two goodness-of-fit criteria, R2 and R2ft, are again relatively low with values of approximately 18 percent for R2 and approximately 16 percent and 10 percent for R2ft. Excluding rear-end accidents from the analyses resulted in a slight improvement in three of the four goodness-of-fit values from the earlier models for ramp segments, as seen when comparing table 20 with table 16. Of the three independent variables considered in the full, but not reduced, NB model for total accidents, only one variable right shoulder width (a=0.16) was not significant at the 10-percent level, but would have been at the 20-percent level. Of the three independent variables considered in the full, but not reduced, NB model for fatal and injury accidents, none of the variables that were not significant at the 10-percent level would have been significant at the 20-percent level. Tables 21 and 22 summarize the regression results for the reduced NB model for total accidents and fatal and injury accidents, respectively, at off-ramps and excluding all rear- end accidents. The tables show that the effects on accident frequency of ramp AADT, number of lanes, ramp configuration, ramp segment length, and average lane width are all statistically significant. Furthermore, these effects are all in the expected direction, including the effect of a key geometric variable average lane width. None of the models for ramp segments presented in tables 17, 18, 21, and 22 include more than one of the key cross-section dimensional variables and, in the one case when a shoulder width variable was statistically significant, its effect was in the opposite direction to that expected. Thus, it does not appear that predictive models can provide an adequate representation of the effects of the lane and shoulder widths on ramps. Table 20. Model Diagnostics for Total and Fatal and Injury Accidents for Ramp Proper Segments of Off-Ramps (Rear-End Accidents Excluded)
a) Includes 1 degree of greedom for the intercept. Table 21. Negative Binomial Regression Results for Total Accidents for Ramp Proper Segments on Off-Ramps (Rear-End Accidents Excluded)
NOTE: This analysis is based on the set of off-ramp proper segments for which summary are shown in table 19. Conversion: 1 mi = 1.61 km, 1 ft = 0.305 m. a) All variables signifcant at the 90% conidence level or higher. b) Chi-square lielihood ratio statistic for testing the significance of the effect of the variable, with 1 degree of freedom for continuous variables and (p-1) degrees of freedom for categorical variables with p levels. c) Direction of effect: i = Inverse of expected direction. d) Relative effect of unit change in the variable on the expected number of accidents, equals exp(coefficient). e) 90% lower and upper confidence limites of the estimated coefficient. Table 22. Negative Binomial regression Results for Fatal and Injury Accidents for Ramp Proper Segments on Off-Ramps (Rear-End Accidents Excluded)
NOTE: This analysis is based on the set of 737 ramp proper segments for which summary are shown in table 19. Conversion: 1 mi = 1.61 km, 1 ft = 0.305 m. a) All variables signifcant at the 90% conidence level or higher. b) Chi-square lielihood ratio statistic for testing the significance of the effect of the variable, with 1 degree of freedom for continuous variables and (p-1) degrees of freedom for categorical variables with p levels. c) Direction of effect: i = Inverse of expected direction. d) Relative effect of unit change in the variable on the expected number of accidents, equals exp(coefficient). e) 90% lower and upper confidence limites of the estimated coefficient.
Entire Ramps (Including All Accidents)Accidents occurring on entire ramps (ramps as a whole rather than just specific segments) were analyzed in a manner similar to those occurring on ramp proper segments. However, when the ramp as a whole was considered, the segment-specific cross-section geometric variables (such as number of lanes, average lane width, and shoulder width) had to be excluded from the analysis. This analysis included 551 ramps with a total length of approximately 146 km (91 mi). A total of 1,227 accidents of all severity levels and 533 fatal and injury accidents occurred within the 3-year period on the 551 ramps. Accident frequency distributions for the entire ramps are shown in figure 5 (presented earlier). Approximately 63 percent of the ramps considered experienced either zero or one accident in the 3-year study period. Approximately 80 percent of these ramps experienced either zero or one fatal and injury accident in the same period. The selection of independent variables was done in a similar fashion to that described earlier for ramp segments. The independent variables considered were:
Table 23 presents descriptive statistics for these variables. As shown in table 24, five independent variables, both continuous and categorical, and one interaction were considered in the full NB regression models. Of these factors, one ramp length (a=0.95 for total accidents; a=0.86 for fatal and injury accidents) was found not to be statistically significant at the 10-percent level. In addition, the interaction of ramp type by ramp configuration was not significant either (a=0.51 for total accidents; a=0.33 for fatal and injury accidents). A reduced NB was then rerun using only the four statistically significant variables. The second column in table 24 shows the NB model statistics for the full model. The Pearson chi-square statistic of 0.99 is within the acceptable range for total accidents; however, the value of 1.46 exceeds the acceptable upper limit of 1.2 for fatal and injury accidents. As was the case for ramp proper segments, this shows that the NB model provides a reasonable choice for total accidents, but not for fatal and injury accidents. The two goodness-of-fit criteria, R2 and R2ft, are relatively low, with values of approximately 22 percent and 20 percent for R2 and approximately 23 percent and 20 percent for R2ft. Table 23. Descriptive Statistics for Entire Ramps
Conversion: 1 mi = 1.61 km.
Table 24. Model Diagnostics for Total and Fatal and Injury Accidents on Entire Ramps
a) Does not include interaction term. b) Includes 1 degree of freedom for the intercept and 4 degrees of freedome for the interaction term (full model only). The third column in table 24 shows the NB model statistics for the reduced model, using only the four statistically significant variables. The Pearson chi-square statistics changed slightly from the full model, with values of 0.98 and 1.35 for total and fatal and injury accidents, respectively. Again, this shows that the NB model provides a reasonable choice for total accidents, but not for fatal and injury accidents. The two goodness-of-fit criteria, R2 and R2ft, are again relatively low, with values of approximately 21 percent and 19 percent for R2 and approximately 22 percent and 19 percent for R2ft. These values are slightly higher than those for the models using ramp segments (per table 16). Tables 25 and 26 summarize the regression results for the reduced NB model for total accidents and fatal and injury accidents, respectively. Both tables show the same four independent variables as statistically significant ramp AADT, ramp configuration, ramp type, and area type and indicate that in both models, these factors have the same relative order for the strength of their relationship to accident frequency. As is consistently the case, ramp AADT has the strongest relationship to accidents. Ramp configuration and ramp type are about equally strong in their relationship to accidents and area type is much weaker. The relative effects show that parclo loop ramps have the highest accident experience, followed by cloverleaf outer connection ramps, diamond ramps, free-flow loop ramps, and direct and semi-direct connection ramps. Off-ramps were found to experience more accidents than on-ramps, and urban ramps experience more accidents than rural ramps. Previous | Table of Contents | Next | Top
Entire Ramps, Off-Ramps Only (Excluding Rear-End Accidents)An analysis of the data for entire ramps was conducted that focused on the data for off- ramps only, with rear-end accidents and other accidents related to the cross-road ramp terminals excluded (as was the case for ramp proper segments). The analysis focused on off-ramps because it is most likely that rear-end accidents on off-ramps are related to the cross-road ramp terminals. The purpose of excluding these accidents was to reduce the influence of the cross-road ramp terminals and focus the analyses on accidents that are potentially related to the geometrics of the ramps themselves. Of the 551 entire ramps for which data were available, a total of 319 (58 percent) were off-ramps. The 3-year average number of total accidents dropped from 2.43 to 1.42 accidents per ramp after excluding the rear-end accidents. The 3-year average number of fatal and injury accidents dropped from 1.09 to 0.53 accidents per ramp after excluding the rear-end accidents. Similarly, the 3-year total accident frequency dropped from 775 to 453 total accidents and from 348 to 168 fatal and injury accidents. The statistical approach to the analysis of total and fatal and injury accidents at off-ramps after excluding rear-end accidents was identical to that for the previous analyses discussed above. The distribution of these accidents is shown in figure 10 in appendix D. Table 25. Negative Binomial Regression Results for Total Accidents on Entire Ramps
NOTE: This analysis is based on the set of 551 entire ramps for which summary statistics are shown in table 23. a) All variables signifcant at the 90% conidence level or higher. b) Chi-square likelihood ratio statistic for testing the significance of the effect of the variable, with 1 degree of freedom for continuous variables and (p-1) degrees of freedom for categorical variables with p levels. c) Direction of effect: i = Inverse of expected direction. d) Relative effect of unit change in the variable on the expected number of accidents, equals exp(coefficient). e) 90% lower and upper confidence limites of the estimated coefficient. Table 26. Negative Binomial Regression Results for Fatal and Injury Accidents on Entire Ramps
NOTE: This analysis is based on the set of 551 entire ramps for which summary statistics are shown in table 23. a) All variables signifcant at the 90% conidence level or higher. b) Chi-square likelihood ratio statistic for testing the significance of the effect of the variable, with 1 degree of freedom for continuous variables and (p-1) degrees of freedom for categorical variables with p levels. c) Direction of effect: i = Inverse of expected direction. d) Relative effect of unit change in the variable on the expected number of accidents, equals exp(coefficient). e) 90% lower and upper confidence limites of the estimated coefficient. The selection of independent variables was done in a similar fashion to that described in the earlier analyses in this section. Table 27 identifies the variables selected for modeling accidents on entire ramps. The independent variables include:
Since only off-ramps are included in this analysis, consideration of the interaction between ramp type and ramp configuration is unnecessary. As shown in table 27, four independent variables, both continuous and categorical, were considered in the full NB models. Of these four independent variables, two were found to have a statistically significant effect on accidents (both total and fatal and injury) at the 10-percent significance level. A reduced NB model was then rerun using only the two statistically significant variables. The second column in table 28 shows the NB model statistics for the full model. The Pearson chi-square statistic of 0.97 is well within the acceptable range for total accidents; however, the value of 1.34 for the Pearson chi-square statistic for fatal and injury accidents slightly exceeds the acceptable upper limit of 1.2. This shows that the NB model provides a reasonable choice for total accidents only. The two goodness-of-fit criteria, R2 and R2ft, are relatively low, with values of approximately 17 percent and 16 percent for R2 and approximately 14 percent and 10 percent for R2ft , for total and fatal and injury accidents, respectively. The third column in table 28 shows the NB model statistics for the reduced model, using only the two statistically significant variables. The Pearson chi-square statistics changed only slightly from the full model, with values of 0.96 and 1.38 for total and fatal and injury accidents, respectively. Again, this shows that the NB model provides a reasonable choice for total accidents only. The two goodness-of-fit criteria, R2 and R2ft, remained unchanged from the full models. When the analysis is limited to off-ramps only and rear-end accidents are excluded, the resulting model fits the data slightly less well than the comparable model for all ramps (compare tables 24 and 28). The models presented here also fit the data slightly less well than the comparable model for ramp segments (compare tables 20 and 28). The two independent variables considered in the full, but not reduced, NB model for total or fatal and injury accidents that were not significant at the 10-percent level, would not have been significant at the 20-percent level either. Table 29 summarizes the regression results for the reduced NB model for both total accidents and fatal and injury accidents, excluding rear-end accidents. Both models in table 29 show only two statistically significant variables ramp AADT and ramp configuration. As is typically the case, ramp AADT has a much stronger relationship to accidents than does ramp configuration. Table 27. Descriptive Statistics for Entire Off-ramps (Rear-End Accidents Excluded)
Conversion: 1 mi = 1.61 km. Table 28. Model Diagnostics for Total and Fatal and Injury Accidents on Entire Off-Ramps (Rear-End Accidents Excluded)
Includes 1 degree of freedom for the intercept. Table 29. Negative Binomial Regression Results for Total and Fatal and Injury Accidents on Entire Off-Ramps (Rear-End Accidents Excluded)
NOTE: This analysis is based on the set of 319 entire ramps for which summary statistics are shown in table 27. a) All variables signifcant at the 90% conidence level or higher. b) Chi-square likelihood ratio statistic for testing the significance of the effect of the variable, with 1 degree of freedom for continuous variables and (p-1) degrees of freedom for categorical variables with p levels. c) Direction of effect: i = Inverse of expected direction. d) Relative effect of unit change in the variable on the expected number of accidents, equals exp(coefficient). e) 90% lower and upper confidence limites of the estimated coefficient. Previous | Table of Contents | Next | Top
Speed-Change LaneModeling of the accident experience of speed-change lanes independent of the modeling of accidents on the ramps they adjoin was attempted for two reasons. First, the geometric elements that appear to be important in the safety performance of speed-change lanes are different than those that are important in the safety performance of ramps. The length of a speed-change lane is a critical safety-related design parameter, particularly for acceleration lanes, while the length of a ramp may be more a function of terrain and site conditions. Second, speed-change lanes and ramps were modeled separately in the well- known Interstate System Accident Research (ISAR) study performed by FHWA in the late 1960s, so there was precedent for separate treatment of speed-change lanes.(5,13) This approach was also recommended by Harwood et al. in the original conceptual plan for the FHWA Interactive Highway Safety Design Model (IHSDM).(24) The initial review of the Washington data base identified 276 acceleration lanes and 192 deceleration lanes as suitable for analysis and as having complete data. Only conventional acceleration and deceleration lanes were considered; speed-change lanes associated with a mainline freeway lane drop, a mainline lane addition, or a mainline weaving area were excluded from the analysis. Separate models were developed for acceleration and deceleration lanes because these two types of speed-change lanes operate very differently and their safety performance would be expected to differ. Speed-change lanes for left-side ramps were excluded from the analysis. As in the case of ramp proper segments, available geometric parameters for speed-change lanes, including number of lanes, average lane width, and right shoulder width, were considered in the analyses. Table 30 presents descriptive statistics for the variables selected for modeling accidents; acceleration and deceleration lanes are considered separately. The independent variables include:
It was found that all acceleration and deceleration lanes in the available sample had only a single traffic lane, so the number of lanes variable was not included in the models. In addition, since all acceleration lanes are located on on-ramps and all deceleration lanes are located on off-ramps, ramp type was not relevant in modeling accidents. A total of seven independent variables, both continuous and categorical, were considered in the full NB models for the two types of speed-change lanes when modeling total accidents. Of these seven independent variables considered in modeling acceleration and deceleration lanes, only four were found to have a statistically significant effect on total accidents at the 10-percent significance level for acceleration lanes and three were found to be significant for deceleration lanes. A reduced NB model was then rerun in each case using only the statistically significant variables. Table 30. Description Statistics for Speed-Change Lanes
NOTE: All acceleration and deceleration lanes have only one lane. Conversion: 1 mi = 1.61 km, 1 ft = 0.305. The top portion of table 31 summarizes the model diagnostics for accidents at both types of speed-change lanes. The second and fourth columns in this table show the NB model statistics for the full model, for acceleration and deceleration lanes, respectively. The third and fifth columns show the NB model statistics for the reduced model, for acceleration and deceleration lanes, respectively. Table 31. Model Diagnostics for Total and Fatal and Injury Accidents in Speed-Change Lanes
a) Includes one degree of freedom for the intercept The Pearson chi-square statistics of 1.35 and 1.36 for the full and reduced models, respectively, for total accidents on acceleration lanes are outside the acceptable range (0.8 to 1.2). The two goodness-of-fit criteria, R2 and R2ft, are high in comparison to previous models, with values of approximately 33 percent (full model) and 36 percent (reduced model) for R2 and approximately 40 percent (full model) and 38 percent (reduced model) for R2ft, for total accidents in deceleration lanes. Although these values are relatively high, the high values for the Pearson chi-square statistics show a poor fit of these models to the data. The Pearson chi-square statistics of 3.11 (full model) and 2.81 (reduced model) for total accidents on deceleration lanes far exceed the upper limit of the acceptable range (0.8 to 1.2). Also, the low values of R2 (15 percent) and R2ft (16 percent) for the reduced model add to the fact that these models do not provide an adequate fit for total accidents in deceleration lanes. In the modeling of fatal and injury accidents in speed-change lanes, only diamond ramps (the most predominant ramp configuration) could be considered, due to modeling difficulties that arose when including all five ramp configurations. Of the six independent variables considered in the full model for acceleration lanes, only three were found to be statistically significant at the 10-percent level. No adequate model could be fit to fatal and injury accidents in deceleration lanes, and thus no statistics are shown for this category. As with the modeling of total accidents in acceleration lanes, the Pearson chi-square statistics of 1.39 (full model) and 1.35 (reduced model) for fatal and injury accidents in acceleration lanes exceed the upper limit of the acceptable range (0.8 to 1.2). Again, the two goodness-of-fit criteria, R2 and R2ft, are high in comparison to previous models, with values of approximately 35 percent (full model) and 34 percent (reduced model) for R2, and approximately 35 percent (full model) and 34 percent (reduced model) for R2ft. In combination, these statistics support the fact that modeling of both total and fatal and injury accidents at either type of speed-change lane is difficult. Of the three independent variables considered in the full, but not reduced, model for total accidents in acceleration lanes, none that was not statistically significant at the 10-percent level would have been significant at the 20-percent level. Of the four independent variables considered in the full, but not reduced, model for total accidents in deceleration lanes, two variables mainline freeway AADT (a=0.13) and deceleration lane length (a=0.13) that were not statistically significant at the 10-percent level would have been significant at the 20-percent level. Of the three independent variables considered in the full, but not reduced, model for fatal and injury accidents in the acceleration lanes of diamond ramps, none that was not statistically significant at the 10-percent level would have been significant at the 20-percent level. Tables 32 and 33 summarize the regression results for the reduced NB models for total accidents and fatal and injury accidents, respectively, in speed-change lanes. All of the models presented in the tables include a key variable that would be expected to influence the safety performance of speed-change lanes ramp AADT. The acceleration lane models also include two other key variables related to safety performance mainline freeway AADT and acceleration lane length. It is natural that higher volume speed-change lanes should have more accidents. The effect of acceleration lane length is more complicated. Longer acceleration lanes would be expected to have more accidents due to increased exposure. However, longer acceleration lanes also represent more generous designs that would be expected to operate more safely. Based on the results shown in tables 32 and 33, the exposure aspect of acceleration lane length appears to outweigh the design aspect, because the models indicate that the accident frequency increases with increasing acceleration lane length. The width of the speed-change lane was not statistically significant in any of the models. In any case, the goodness-of-fit measures indicate that the models of speed-change lanes, by themselves, do not provide an adequate fit to the data. Table 32. Negative Binomial Regression Results for Total Accidents in Speed-Change Lanes
NOTE: This analysis is based on the set of 192 acceleration lanes and 276 deceleration lanes for which summary statistics are shown in table 30. Conversion: 1 mi = 1.61 km, 1 ft = 0.305 m. a) All variables significant at the 90% confidence level or higher. b) Chi-aquare likelihood ratio statistic for testing the significance of the effect of the variable, with 1 degree of freedom for continuous variables and (p-1) degrees of freedom for categorical variables with p levels. c) Direction of effect: I=Inverse of expected direction. d) Relative effect of unit change in the variable on the expected number of accidents, equals exp (coefficient). e) 90% lower and upper confidence limits of the estimated coefficient. Table 33. Negative Binomial Regression Results for Fatal and Injury Accidents in Acceleration Lanes (Diamond On-Ramps Only)
NOTE: This analysis is based on the set of 148 acceration lanes for which summary statistics are shown in table 30. No comparable model could be developed for deceleration lanes. Conversion: 1 mi = 1.61 km. a) All vehicles significant at the 90% confidence level or higher. b) Chi-square likelihood ratio statistic for testing the significance of the effect of the variable, with 1 degree of freedom for continuous variables. c) Direction of effect: I=Inverse of expected direction. d) Relative effect of unit change in the variable on the expected number of accidents, equals exp(coefficient). e) 90% lower and upper confidence limits of the estimated coefficient. Entire Ramps and Adjacent Speed-Change Lanes CombinedIn the preceding analyses in this report, accidents on ramps and speed-change lanes were modeled separately with the thought that accident predictions from the separate models could be added together to determine the combined safety performance of a ramp and its adjacent speed-change lane. The following modeling effort was devoted to developing a single model to predict accident experience for ramps and their adjacent speed-change lanes. The accidents occurring on both the entire ramp and those occurring in the adjacent speed-change lane were thus considered in the modeling. The effort used the combined data for the 551 entire ramps, 276 deceleration lanes, and 192 acceleration lanes that have been described in previous modeling efforts. A total of 467 ramps were available that met the selection criteria discussed earlier and had data available for both the ramp and its adjacent speed-change lane. These ramps with their adjacent speed-change lanes had a total length of approximately 388 km (241 mi), including approximately 253 km (157 mi) of total ramp length and approximately 135 km (84 mi) of total speed-change lane length. The average 3-year accident frequency was 3.11 accidents per ramp for total accidents and 1.38 accidents per ramp for fatal and injury accidents. Three-year accident frequency totals were 1,452 for total and 644 for fatal and injury accidents. The selection of independent variables was done in a similar fashion to the other modeling efforts described earlier. Table 34 identifies the variables selected for modeling accidents for combined ramps and speed-change lanes. The independent variables include:
As in previous analyses, the interaction between ramp type and ramp configuration was included in the combined ramp and speed-change lane modeling effort. In addition to independent variables considered in previous analyses, two new variables obtained from existing records were also introduced into this analysis. These were the general grade of the ramp (upgrade/downgrade) and the AADT of the mainline freeway section adjacent to the speed-change lane. The mainline freeway AADT used in modeling is the one-way AADT for the direction of travel in which the ramp and speed-change lane are located. The procedures used to obtain the variables are described in section 4 of this report. In this analysis, the interaction between ramp type and ramp grade was also considered. As shown in table 34, eight independent variables, both continuous and categorical, plus the two interactions, were considered in the full NB model. Of these eight independent variables, three were found to have a statistically significant effect on total accidents and five had a statistically significant effect on fatal and injury accidents at the 10-percent significance level. A reduced NB model was then rerun using only the statistically significant variables. In both cases, the ramp type by ramp configuration and the ramp type by ramp grade interactions were not statistically significant. The second column in table 35 shows the NB model statistics for the full model. The Pearson chi-square statistic of 0.95 for total accidents is well within the acceptable range; the Pearson chi-square statistic of 1.19 for fatal and injury accidents is at the upper limit of the acceptable range. These results show that the NB model provides a reasonable choice for both types of accidents. The two goodness-of-fit criteria, R2 and R2ft, are high in comparison to previous models, with values of approximately 38 percent and 37 percent for R2 and approximately 44 percent and 39 percent for R2ft for total and fatal and injury accidents, respectively. Table 34. Descriptive Statistics for Entire Ramps, Including the Adjacent Speed-Change Lane
Conversion: 1 mi = 1.61 km. Table 35. Model Diagnostics for Total and Fatal and Injury Accidents on Entire Ramps, Including the Adjacent Speed-Change Lane
a) Includes interaction between ramp type and ramp configuration and between ramp type and ramp grade. b) Model does not include interactions. c) Does not include interaction terms in full models. d) Includes 1 degree of freedom for intercept, 4 degrees of freedom for ramp type by ramp configuration interaction, and 1 degree of freedom for ramp type by ramp grade interaction for full models; includes 1 degree of freedom for intercept for reduced models. The third column in table 35 shows the NB model statistics for the reduced model, including only the statistically significant variables. The Pearson chi-square statistics changed only slightly from the full model, with values of 0.94 and 1.11 for total and fatal and injury accidents, respectively. Again, this shows that the NB model provides a reasonable choice for both types of accidents. The two goodness-of-fit criteria, R2 and R2ft, remain relatively high as compared to other models, with values of approximately 37 percent and 36 percent for R2 and approximately 42 percent and 37 percent for R2ft for total and fatal and injury accidents, respectively. These goodness-of-fit measures are far superior to any of those found for the models of ramp segments and entire ramps presented earlier. The reduced model for total accidents at the 10-percent significance level was obtained in a stepwise fashion, starting with the full model, which included eight variables and two interactions. In a first iteration, mainline freeway AADT (a=0.18), ramp grade (à=0.40), and the two interactions [ramp type by ramp configuration (a=0.66) and ramp type by ramp grade (a=0.98)] were excluded from the full model; the remaining six variables were all statistically significant at the 10-percent significance level in the full model. The result of this first iteration showed that of the six variables considered, one ramp length (a=0.11) was no longer significant at the 10-percent significance level, but was significant at the 20-percent significance level. A second iteration was performed in which ramp length was excluded from the model. As a result of this analysis, it was found that ramp type (a=0.14) and length of speed-change lane (a=0.39) were no longer statistically significant. A third and final iteration was then performed with the three remaining variables ramp AADT, area type, and ramp configuration all of which now remained statistically significant at the 10-percent significance level. The reduced model for fatal and injury accidents at the 10-percent significance level was obtained in a similar fashion. From the full model with eight independent variables and two interactions, three independent variables area type (a=0.25), ramp grade (a=0.32), and ramp configuration (a=0.55) and two interactions ramp type by ramp configuration (a=0.62) and ramp type by ramp grade (a=0.70) were found not to be statistically significant at the 10-percent significance level. These variables and interactions were excluded in the first iteration to obtain a reduced model. As a result, the variable area type (a=0.17) was no longer significant at the 10-percent significance level, but was significant at the 20-percent significance level. A second and final iteration for the reduced model was performed without the area-type variable; thus, the model included five variables. Tables 36 and 37 summarize the regression results for the reduced NB model for total accidents and fatal and injury accidents, respectively, at the 10-percent significance level. Table 36 shows the reduced model for total accidents with three statistically significant variables ramp AADT, area type, and ramp configuration. Similarly, table 37 shows a model for fatal and injury accidents with five statistically significant variables ramp AADT, length of speed-change lane, ramp length, ramp type, and mainline freeway AADT. Neither the ramp grade nor the two interactions considered were statistically significant. In general, caution should be exercised in including variables that are not statistically significant at the 10-percent significance level in a predictive model because of the increased risk that they may appear to be statistically significant due to chance alone. In this case, however, because the variables in question appeared to be important to the objectives of the research and because they were statistically significant at the 20-percent significance level, it appeared to be desirable to include additional variables to the model. Therefore, a decision was reached to revise the models shown in tables 36 and 37 to include all variables that were statistically significant at the 20-percent significance level or better. Table 36. Negative Binomial Regression Results for Total Accidents on Entire Ramps, Including the Adjacent Speed-Change Lane (Reduced Model at 10-Percent Significance Level)
NOTE: This analysis is based on the set of 467 entire ramps for which summary statistics are shown in table 34. a) All variables signifcant at the 90% conidence level or higher. b) Chi-square likelihood ratio statistic for testing the significance of the effect of the variable, with 1 degree of freedom for continuous variables and (p-1) degrees of freedom for categorical variables with p levels. c) Direction of effect: i = Inverse of expected direction. d) Relative effect of unit change in the variable on the expected number of accidents, equals exp(coefficient). e) 90% lower and upper confidence limites of the estimated coefficient. Table 37. Negative Binomial Regression Results for Fatal and Injury Accidents on Entire Ramps, Including the
NOTE: This analysis is based on the set of 467 entire ramps for which summary statistics are shown in table 34. a) All variables signifcant at the 90% conidence level or higher. b) Chi-square likelihood ratio statistic for testing the significance of the effect of the variable, with 1 degree of freedom for continuous variables and (p-1) degrees of freedom for categorical variables with p levels. c) Direction of effect: i = Inverse of expected direction. d) Relative effect of unit change in the variable on the expected number of accidents, equals exp(coefficient). e) 90% lower and upper confidence limites of the estimated coefficient. This appeared to have the potential to create models for both total accidents and fatal and injury accidents that incorporate the same set of seven independent variables:
The reduced models, including all variables significant at the 20-percent level, are presented in tables 38 and 39 for total and fatal and injury accidents, respectively. The model diagnostics for the models shown in tables 38 and 39 are presented in the fourth column of table 35 (with the heading, Reduced Model at 20-Percent Significance Level). The models in tables 38 and 39 contain the same set of independent variables except that ramp configuration, which was statistically significant in the model for total accidents in table 38, was not significant in the model for fatal and injury accidents in table 39. The use of these models to predict accident frequencies is discussed below. To predict the average accident frequency for a ramp including the adjacent speed-change lane, the regression coefficients b0, b1, b2,... bq are replaced in equation (13) by the estimated values of the coefficients found in tables 38 and 39, and the variables X1, X2, ..., Xq are replaced by their appropriate values or levels. For example, the expected 3-year total accident frequency can be estimated using the model presented in table 38 as: Y = e-7.27 (X1)0.78 (X2)0.13 exp(0.45X3) exp(0.78X4) exp(-0.02X5) exp(0.69X6) exp(-0.37X7) exp(0.37X8) exp(-2.59X9) exp(1.62X10) where Y = expected number of total accidents in a 3-year period on entire ramp plus adjacent speed-change lane X1 = ramp AADT (veh/day) X2 = mainline freeway AADT for the direction of travel in which the ramp is located (veh/day) X3 = 1 if the ramp is a diamond ramp; 0 otherwise X4 = 1 if the ramp is a parclo loop ramp; 0 otherwise X5 = 1 if the ramp is a free-flow loop ramp; 0 otherwise X6 = 1 if the ramp is an outer connection ramp; 0 otherwise X7 = 1 if the area type is rural; 0 otherwise X8 = 1 if the ramp is an off-ramp; 0 otherwise X9 = speed-change lane length (mi) X10 = ramp length (mi) Note that when the level of a categorical variable is 0, the multiplicative term in equation (15) becomes e0 = 1, and is, therefore, omitted from the model. Table 38. Negative Binomial Regression Results for Total Accidents on Entire Ramps, Including the Adjacent Speed-Change Lane (Reduced Model at 20-Percent Significance Level)
NOTE: This analysis is based on the set of 467 entire ramps for which summary statistics are shown in table 34. a) All variables signifcant at the 90% conidence level or higher. b) Chi-square likelihood ratio statistic for testing the significance of the effect of the variable, with 1 degree of freedom for continuous variables and (p-1) degrees of freedom for categorical variables with p levels. c) Direction of effect: i = Inverse of expected direction. d) Relative effect of unit change in the variable on the expected number of accidents, equals exp(coefficient). e) 90% lower and upper confidence limites of the estimated coefficient. Table 39. Negative Binomial Regression Results for Fatal and Injury Accidents on Entire Ramps, Including the Adjacent Speed-Change Lane (Reduced Model at 20-Percent Significance Level)
NOTE: This analysis is based on the set of 467 entire ramps for which summary statistics are shown in table 34. a) All variables signifcant at the 90% conidence level or higher. b) Chi-square likelihood ratio statistic for testing the significance of the effect of the variable, with 1 degree of freedom for continuous variables and (p-1) degrees of freedom for categorical variables with p levels. c) Direction of effect: i = Inverse of expected direction. d) Relative effect of unit change in the variable on the expected number of accidents, equals exp(coefficient). e) 90% lower and upper confidence limites of the estimated coefficient. Similarly, the expected 3-year fatal and injury accident frequency for a ramp, including the adjacent speed-change lane, can be estimated using the model presented in table 40 as: Y = e-9.67 (X1)0.87 (X2)0.23 exp(2.85X3) exp(-4.42X4) exp(0.48X5) exp(-0.26X6) where Y = expected number of fatal and injury accidents in a 3-year period on entire ramp, including adjacent speed-change lane X1 = ramp AADT (veh/day) X2 = mainline freeway AADT for the direction of travel in which the ramp is located (veh/day) X3 = ramp length (mi) X4 = speed-change lane length (mi) X5 = 1 if ramp is an off-ramp; 0 otherwise X6 = 1 if the area type is rural; 0 otherwise Numerical examples of the application of these models are presented later in this section. Previous | Table of Contents | Next | Top
Selected Urban Off-RampsA final set of models of selected ramp configurations was developed for urban off- ramps. The purpose of these analyses was twofold. First, this approach enabled the investigation of whether better models could be developed if modeling were focused on a single ramp type and configuration rather than across ramp types and configurations. Focusing on a single ramp type and configuration reduces the number of ramps and accidents in the available sample, but may increase the ability of models to predict accident experience. Urban off-ramps were selected for this modeling effort because they generally experience more accidents than any other combination of area type and ramp type. Second, this modeling effort was conducted to test the relationship to accidents of three alternative measures for characterizing the horizontal alignment of ramps (see section 4). Only a limited effort could be devoted to data collection for determining these measures, so it was decided to focus on a sample of approximately 200 urban off-ramps. The data selected for this modeling effort included:
The data sets used for these four ramp configurations were those for entire ramps (i.e., these analyses used subsets of the data for 551 entire ramps whose analysis was described earlier). Models were developed for these four data sets and for a data set combining the parclo and free-flow loop off-ramps. However, because of the limited sample sizes in most of these groups, usable models were obtained only for the diamond off-ramps. The distributions of total and fatal and injury accidents for the urban diamond off-ramps are shown in figure 13 in appendix D. Similar accident distributions for urban loop and outer connection off-ramps are shown in figures 14 and 15, respectively, in appendix D. Urban Diamond Off-Ramps The selection of independent variables for the analysis of urban diamond off-ramps was done in a similar manner to that described for the previous modeling efforts. Table 40 identifies the variables selected for modeling accidents on urban diamond off-ramps. Two additional geometric features were considered in these models the general grade of the ramp (upgrade/downgrade) and the horizontal alignment measures defined in section 4 (see table 8). A total of 115 urban diamond off-ramps, with both grade and curvature information, were available. Since three alternative measures of horizontal alignment the minimum radius of any curve on the ramp and two variations of the horizontal alignment index representing the curviness of the ramp were defined in section 4, each analysis was repeated three times, once for each horizontal alignment measure. This approach allowed the relationship to accidents of the three alternative horizontal alignment measures to be compared. Of the 115 urban diamond off-ramps, 42.6 percent experienced zero or one total accident, while 64.3 percent experienced zero or one fatal and injury accident during the 3-year study period. Both Poisson regression and NB regression models were fit to these data. A total of 12 models were fit to these data for all combinations of:
For all of these models, the regression results were very poor as measured by either the mean deviance, the Pearson chi-square, or the goodness-of-fit criteria (R2 and R2ft). Table 41 summarizes the Poisson and NB full regression model results (separately for total and fatal and injury accidents) using one of the three measures of horizontal alignment. As shown in table 39, four independent variables, both continuous and categorical, were considered in all the full models. The deviance (a measure of overdispersion) is large for all Poisson models, with a value of approximately 15 for total accidents and approximately 5 for fatal and injury accidents. The two goodness-of-fit criteria, R2 and R2ft, are low, with values of approximately 10 to 11 percent for R2 and approximately 4 to 5 percent for R2ft. Table 40. Descriptive Statistics for Urban Diamond Off-Ramps
Conversion: 1 mi = 1.61 km. a) Refer to table 8 and accompanying text for definitions. Table 41. Model Diagnostics for Total and Fatal and Injury Accidents on Urban Diamond Off-Ramps
a) Reger to table 8 and accompanying text for definitions. b) Includes one degree of freedom for the intercept. c) Not applicable. The k factor does not apply to Poisson models. d) Not calculated. Statistic could not be esitmated (negative value found). An attempt was made to fit an NB regression model to each of the above sets of data. Using the variance adjustment factors (k) shown in table 39, the overdispersion of the data found in the Poisson models could be reduced. However, in all of the NB models for total accidents, the Pearson chi-square, with values of approximately 0.65, remained well below the lower limit of the acceptable range (0.8 to 1.2). Thus, neither the Poisson nor the NB models provide a good fit to these data. The Pearson chi-square values for fatal and injury accidents are approximately 0.84, just inside the acceptable range. The two goodness-of-fit criteria, R2 and R2ft, could not be calculated for total accidents because the estimated values were negative in all cases. For fatal and injury accidents, these goodness-of-fit criteria had values generally below 6 percent. Based on these poor regression results, it was decided not to pursue the reduced model of either type (i.e., exclude all variables that are not statistically significant in the full models). To summarize the above results, table 42 lists those variables that were statistically significant at the 10-percent level in each of the above 12 models. As shown in table 42, none of the models includes grade. In all the Poisson models, horizontal alignment (in whatever form it was used) was statistically significant at the 10-percent significance level, while none of the NB models retained horizontal alignment in either form. All Poisson models for total accidents included ramp length, while none of the Poisson models for fatal and injury accidents did so. Finally, when modeling fatal and injury accidents using the NB model, only traffic volume (log of AADT) remained statistically significant at the 10-percent level. Although the horizontal alignment variables were statistically significant in the Poisson models (as shown in table 42), these models did not fit the data well because of overdispersion. One of the effects of overdispersion is to underestimate the variance of the model coefficients. As a result, some variables may be found to be statistically significant when, in fact, they are not. Since the horizontal alignment variables were not statistically significant in the NB models, it seems that their apparent significance in the Poisson models may have been due to overdispersion. Other Urban Off-Ramp Configurations The results obtained from the analysis of urban diamond off-ramps presented above were disappointing because the models did not fit the data well and because no reliable safety effects could be found for the horizontal alignment variables. Because of the strong interest in quantifying the effect of horizontal alignment on safety, if possible, a decision was made to repeat the analyses presented in tables 40 through 42 using all 165 of the 4 types of urban off-ramps listed above, rather than just the 115 urban diamond off-ramps. This analysis was conducted omitting ramp configuration as an independent variable in the hope that the horizontal alignment variable might serve to distinguish between diamond ramps, which are generally straight, and loop and outer connection off-ramps, which are generally curved. However, the results of this analysis were similar to those reported above for urban diamond off-ramps in that the models did not fit the data well and none of the horizontal alignment variables were statistically significant. These efforts suggest that it is difficult to model accident frequency for specific ramp types, particularly when the available sample size is limited. Table 42. Summary of Statistically Significant Variables in Modeling Accidents on Urban Diamond Off-Ramps
a) Refer to table 8 and accompanying text for definitions.
Discussion of ResultsThe statistical modeling results presented in this section suggest that the best models of the safety performance of interchange ramps and speed-change lanes can be obtained by combining the accident experience of ramps and their adjacent speed-change lanes into a single model. The models presented in tables 38 and 39 for total accidents and fatal and injury accidents, respectively, fit the available data better than other models developed during the research, based on the values of the goodness-of-fit criteria (R2, R2ft) the scaled deviance, and the Pearson chi-square. These models include the effects of several key variables that are known from previous research to affect the safety performance of ramps and speed-change lanes. These models are also presented in equations (15) and (16). The ramp and speed-change lane characteristics, whose relationship to accident frequency was documented in the research, were:
These seven independent variables are all statistically significant at the 20-percent significance level in the model for total accidents in table 38, and all of these independent variables, except ramp configuration, are significant in the model for fatal and injury accidents in table 39. The models in tables 38 and 39 provide useful accident frequency predictions that show how safely ramps typically operate and that illustrate some of the important variations in safety performance among types of ramps. Table 43 presents expected values of annual accident frequency for rural off-ramps with various ramp lengths, speed-change lane lengths, ramp configurations, and various levels of ramp and mainline freeway AADT. The values of ramp length used in the table are typical of the individual ramp configurations, and the values of ramp and mainline freeway AADT were selected to cover a typical range. The expected values shown in the table range from 0.06 to 0.35 total accidents per ramp per year and from 0.02 to 0.24 fatal and injury accidents per ramp per year. All of these expected values of accident frequency include accidents on both the ramp and the adjacent speed-change lane. Table 43. Expected Accident Experience for Rural Off-Ramps
Conversion: 1 mi = 1.61 km a) Based on the model presented in table 38 and equation (15). The 3-year model prediction is divided by 3 to obtain accidents per ramp per year. b) Based on the model presented in table 39 and equation (15). The 3-year model prediction is divided by 3 to obtain accidents per ramp per year. Tables 44 through 46 present analogous data for rural on-ramps, urban off-ramps, and urban on-ramps, respectively. The highest expected accident frequencies are those for urban off-ramps, which range from 0.27 to 1.46 total accidents per ramp per year. It should be noted that tables 43 through 46 are based on statistical models that contain some variables that were statistically significant at the 20-percent significance level, but were not statistically significant at the 10-percent significance level. The use of such effects was necessary in order to include the effect of as many of the variables of interest as possible, but, in general, the use of effects that are not statistically significant at the 10-percent significance level is not preferred. The lack of a ramp configuration effect in the model for fatal and injury accidents has the effect of producing higher predicted frequencies of fatal and injury accidents on direct and semi-direct connection ramps than appears appropriate. Direct and semi-direct connection ramps have the highest accident frequencies in the fatal and injury accident model, but have accident frequencies that are lower, relative to other ramp configurations, in the total accident model. Table 44. Expected Accident Experience for Rural On-Ramps
Conversion: 1 mi = 1.61 km a) Based on the model presented in table 38 and equation (15). The 3-year model prediction is divided by 3 to obtain accidents per ramp per year. b) Based on the model presented in table 39 and equation (15). The 3-year model prediction is divided by 3 to obtain accidents per ramp per year. Table 45. Expected Accident Experience for Urban Off-Ramps
Conversion: 1 mi = 1.61 km a) Based on the model presented in table 38 and equation (15). The 3-year model prediction is divided by 3 to obtain accidents per ramp per year. b) Based on the model presented in table 39 and equation (15). The 3-year model prediction is divided by 3 to obtain accidents per ramp per year. Table 46. Expected Accident Experience for Urban On-Ramps
Conversion: 1 mi = 1.61 km a) Based on the model presented in table 38 and equation (15). The 3-year model prediction is divided by 3 to obtain accidents per ramp per year. b) Based on the model presented in table 39 and equation (15). The 3-year model prediction is divided by 3 to obtain accidents per ramp per year. It should be understood that the accident frequencies presented in tables 43 through 46 are expected or average values. In fact, accident frequencies can vary widely, even between similar ramps. As shown in figures 5 through 8 and in appendix D, many ramps have no accidents in a 3-year period, while a few ramps experience large numbers of accidents. The models presented here, which focus on expected values, are not intended to predict which specific ramps will have extremely high accident frequencies. Indeed, from the point of view of this statistical modeling effort, such concentrations of accidents appear to be random; in other words, they are not explained by the independent variables considered in this research. Although the models used here for illustrative purposes are the best among the models developed for this report, it should be noted that their predictive power is directly related to their goodness-of-fit values. As seen in the last column of table 35, the Pearson chi-square statistics are 1.11 and 0.95 for total and fatal and injury accidents, respectively. These values are within the acceptable range of 0.8 to 1.2, indicating that the NB model provides an acceptable fit to the data. The additional two goodness-of-fit criteria, R2 and R2ft, have values of 37 percent and 42 percent, respectively, for total accidents. Similarly, the R2 and R2ft values are 34 percent and 36 percent, respectively, for fatal and injury accidents. In other words, approximately 58 to 64 percent of the variability in accident frequency is not explained by these specific models. Previous | Table of Contents | Next | Top |
|||||||||||||||||||||||||||||||||||||||||||||||||||||||||||||||||||||||||||||||||||||||||||||||||||||||||||||||||||||||||||||||||||||||||||||||||||||||||||||||||||||||||||||||||||||||||||||||||||||||||||||||||||||||||||||||||||||||||||||||||||||||||||||||||||||||||||||||||||||||||||||||||||||||||||||||||||||||||||||||||||||||||||||||||||||||||||||||||||||||||||||||||||||||||||||||||||||||||||||||||||||||||||||||||||||||||||||||||||||||||||||||||||||||||||||||||||||||||||||||||||||||||||||||||||||||||||||||||||||||||||||||||||||||||||||||||||||||||||||||||||||||||||||||||||||||||||||||||||||||||||||||||||||||||||||||||||||||||||||||||||||||||||||||||||||||||||||||||||||||||||||||||||||||||||||||||||||||||||||||||||||||||||||||||||||||||||||||||||||||||||||||||||||||||||||||||||||||||||||||||||||||||||||||||||||||||||||||||||||||||||||||||||||||||||||||||||||||||||||||||||||||||||||||||||||||||||||||||||||||||||||||||||||||||||||||||||||||||||||||||||||||||||||||||||||||||||||||||||||||