U.S. Department of Transportation
Federal Highway Administration
1200 New Jersey Avenue, SE
Washington, DC 20590
202-366-4000
Federal Highway Administration Research and Technology
Coordinating, Developing, and Delivering Highway Transportation Innovations
 |
| This report is an archived publication and may contain dated technical, contact, and link information |
|
Publication Number: FHWA-RD-98-133
Date: October 1998 |
|||
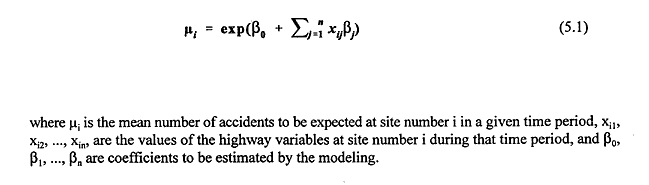
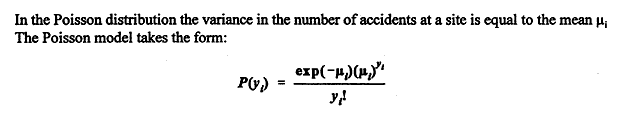
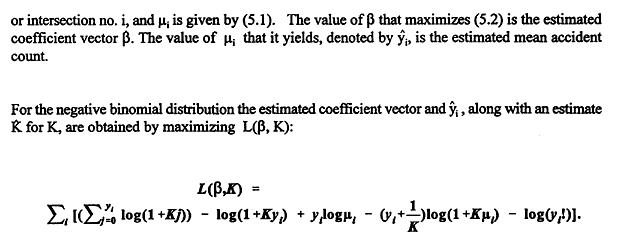
Accident Models for Two-Lane Rural Roads: Segment and Intersections5. ModelingPoisson and Negative Binomial Modeling Techniques The Poisson and Negative Binomial Models Poisson and negative binomial models, with parameters a generalized linear function of covariates, are by now a well-accepted method of modeling discrete rare events such as roadway accidents. See Miaou and Lum (1993). It is assumed that accidents occurring on a particular roadway or at a particular intersection are independent of one another and that a certain mean number of accidents per unit time is characteristic of the given site and of other sites with the same properties. The mean itself is assumed to depend on highway variables. Since the mean must be greater than zero, it is taken to have a generalized linear form given by:
where P(
The coefficients
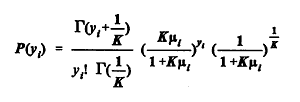
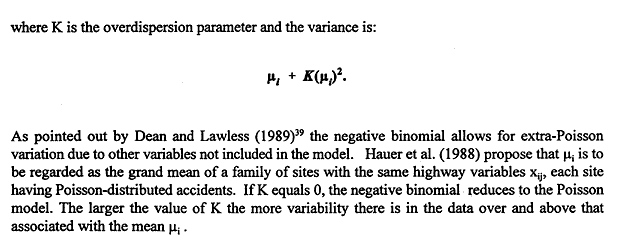
Here
For convenience the same letters will often be used for both the parameters and their estimated values, i.e., hats ^ will be omitted. Model Evaluation - Overdispersion A decision about whether the Poisson form is appropriate can be based on one of several statistics. As noted in SAS Technical Report P-243 the deviance of a model m is:
where Lf is the log-likelihood (5.2) that would be achieved if the model gave a perfect fit ( A value of the deviance greatly in excess of n - p suggests that the model is overdispersed due to missing variables and/or non-Poisson form. Thus when deviance divided by degrees of freedom
is significantly larger than 1, overdispersion is indicated. Likewise, the Pearson chi-square statistic, defined by
is an approximately chi-squared random variable with mean n - p for a valid Poisson model. If
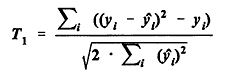
is significantly larger than 1, overdispersion is also indicated. On the assumption that the basic form of the model is correct, Dean and Lawless (1989) recommend yet another statistic T1 to test the hypothesis that the model is a Poisson model against the alternative that it is overdispersed. When the null hypothesis K = 0 is true and the number of observations is large, the statistic
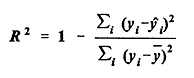
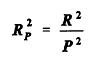
is approximately a standard normal random variable. If T1 is large positive, the hypothesis K = 0 is rejected, the data are considered to be overdispersed, and a negative binomial model with K positive is an alternative candidate model. Model Evaluation - Goodness of Fit In addition to a plausible basis for the underlying distributional assumptions, three important tests for an acceptable model are the following: · The estimated regression coefficient for each covariate should be statistically significant, i.e., one should be able to reject the null hypothesis that the coefficient is zero; · Engineering and intuitive judgments should be able to confirm the validity and practicality of the sign and rough magnitude of each estimated coefficient; and · Goodness-of-fit measures and statistics, such as R-squared (the coefficient of determination), the deviance, and the Pearson chi-square, should indicate that the variables do have explanatory and predictive power. The modeling of the data in this study was done using SAS and LIMDEP software. Along with approximate maximum likelihood estimates for the regression coefficients, these software packages yield estimates of the standard error for each coefficient. From these, P-values can be computed for the null hypothesis that the true value of some regression coefficient is zero. The z-score of the estimated coefficient is the estimated coefficient minus zero, divided by the estimated standard error. The P-value is the probability that a normal random variable has an absolute value larger than the z-score obtained. If the P-value is small, we have good evidence that the corresponding variable is significant, that the difference between the coefficient estimate and zero arises not from chance but from a systematic effect. Goodness-of-fit measures associated with Poisson-type models have been introduced and reviewed by Fridstrøm et al. (1995) and Miaou (1996). The R-squared goodness-of-fit measures, used to estimate the percentage of variation explained by a regression model, are somewhat controversial. Different R-squared measures may yield substantially different answers, or even answers larger than 1, particularly for models that are not linear. See the article of Kvalseth (1985). Until recently, R-squared measures appropriate for Poisson or negative binomial models had not been established. Fridstrøm et al. (1995) developed several alternative goodness-of-fit methodologies for generalized Poisson regression models. Four of these approaches are used here to evaluate goodness-of-fit. The first approach is based on the ordinary R-squared, or coefficient of determination, used in linear regression models:
where yi = observed accident count for highway segment or intersection no. i
i = estimated mean accident count for observation no. i The numerator in the second term (of 5.4) is the variation not explained by the model. In a perfectly specified and estimated Poisson model (variance equal to mean), the most that can be explained of the given data is expected to be P2, where
The variable The three measures introduced so far are strongly oriented toward Poisson models. Indeed because they do not explicitly include an overdispersion parameter they seem inappropriate for negative binomial models. But a fourth approach is tailored to the negative binomial. The fourth approach, the Log-Likelihood R-squared, is based on the deviance Dm of the model. Fridstrøm et al. propose the following measures:
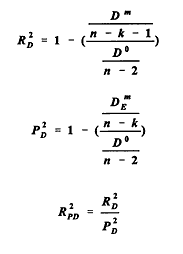
equations (5.13, 5.14, 5.15 respectively) Here D0 is the deviance of a model with only two parameters, the constant term (intercept) and the overdispersion parameter; k is the number of parameters of the model m under consideration (not including the overdispersion parameter in the model); and DEm is the expected value of the deviance in the case when a Poisson model with the same means yi as the model m is the correct one. Roughly speaking, RD2 indicates how much explanatory power results from adding the highway characteristics and R2PD represents this as a fraction of the highest possible expected explanatory power of any model with the same means as m. For negative binomial and Poisson models Fridstrøm et al. regard R2PD and R2PFT with favor. They express reservations about R2P and RPW2 the first of these, being unnormalized, will make observations with large predicted means more influential, while the second tends to exaggerate the estimation errors associated with small predicted means. Yet another measure of goodness-of-fit, this one advocated by Miaou (1996), is based explicitly on the overdispersion parameter.
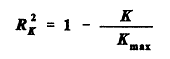
Here K is the overdispersion parameter estimated in the model, and Kmax is the overdispersion parameter estimated in the negative binomial model discussed above, namely, the model with only a constant term and an overdispersion parameter. Based on simulations Miaou concluded that this measure shows promise. It is simple to calculate, it yields a value between 0 and 1, it has the proportionate increase property (Miaou proposes as a criterion that independent variables of equal importance, when added to a model, increase the value of the measure by the same absolute amount regardless of the order in which they are added), and it is independent of the choice of intercept term in the model.
|


 (5.3)
(5.3)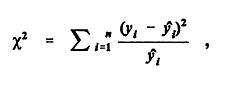

 (5.4)
(5.4)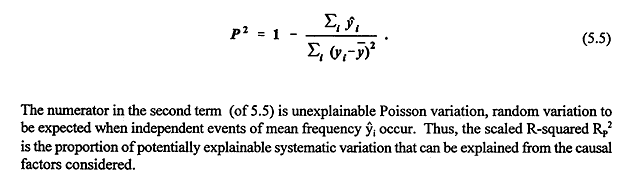
 (5.6)
(5.6)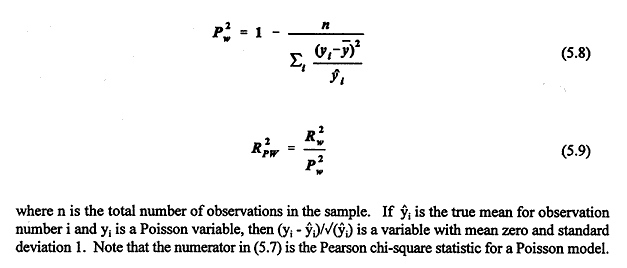
 (5.16)