U.S. Department of Transportation
Federal Highway Administration
1200 New Jersey Avenue, SE
Washington, DC 20590
202-366-4000
Federal Highway Administration Research and Technology
Coordinating, Developing, and Delivering Highway Transportation Innovations
 |
| This report is an archived publication and may contain dated technical, contact, and link information |
|
Publication Number: FHWA-RD-01-103
Date: May 2001 |
Highway Design Handbook for Older Drivers and PedestriansII. INTERCHANGES (GRADE SEPERATION)
The following discussion presents the rationale and supporting evidence for Handbook recommendations pertaining to these four design elements (A-D):
A. Design Element: Exit Signing and Exit Ramp Gore Delineation
Table 30. Cross-references of related entries for exit signing and exit ramp gore delineation.
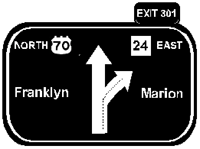
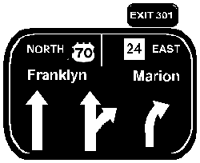
A motorist's ability to use highway information from signing and delineation is governed by information acquisition, or how well the source can be seen. It is also governed by information processing, or the speed and accuracy with which the message content can be understood. When either of these key aspects of driver performance is compromised, the result is delayed decision making, erratic behavior, and maneuver errors. Taylor and McGee (1973) investigated driver behavior at exit gore areas to determine the causes and characteristics of erratic maneuvers. Interviews were also conducted with many drivers whose actions at the gore area were indicative of route choice difficulties. Analyses of the patterns of erratic maneuvers (cross gore markings, cross gore area, stop in gore, back up, sudden slowing, lane change, swerve, stop on shoulder) and on-site driver interviews were used to determine causative factors of these maneuvers. The most frequent erratic maneuver was crossing the gore marking, which had a 69 percent relative frequency of occurrence for drivers exiting, and a 61 percent relative frequency of occurrence for drivers traveling through the interchange. Most of the motorists who made erratic maneuvers (77 percent) were unfamiliar with the route on which they were traveling. Interviews with exiting motorists who made erratic maneuvers indicated that more than half of the drivers were not adequately prepared for the exit. These drivers indicated that the signs lacked needed information or that the information was misleading. Interviews with drivers who made erratic maneuvers and continued through, indicated that approximately one-half had difficulty identifying their direction. Approximately 35 percent stated the signing was not clear, 21 percent responded that they could not clearly distinguish the location of the exit ramp, and 34 percent thought the road markings were inadequate. The following discussion of exit signing issues focuses on the legibility of text, the understandability of diagrammatic guide signs, and the placement of devices to provide needed message redundancy while avoiding information overload. Prior to the Millennium edition of the MUTCD, legibility standards assumed that a 25-mm (1-in) tall letter was legible at 15.2 m (50 ft), which roughly corresponds to a visual acuity of 20/25; as documented in the Transportation Research Board's Special Report 218 (1988), this "legibility index" value of 50 ft/in exceeds the visual ability of 30 to 40 percent of drivers who are 65 to74 years of age, even under favorable contrast conditions. The MUTCD (2000) section 2A.14 provides guidance for determining sign letter heights which indicates that sign letter heights should be determined based on 25 mm (1 inch) of letter height per 12 m (40 ft) of legibility distance. A 0.48 m/mm (40 ft/in) standard for signs can accommodate the majority of older drivers if contrast ratios (between the legend and background) are greater than 5:1 (slightly higher for guide signs) and luminance is greater than 10 cd/m2 (candelas per square meter) for partially reflectorized signs. However, a more conservative standard corresponding to 20/40 vision ( i.e., a legibility index of 0.36 m/mm [30 ft/in]) would accommodate a greater proportion of seniors under a wider range of viewing conditions. Nighttime legibility requirements were addressed by Staplin, Lococo, and Sim (1990), who conducted a laboratory simulation using 28 young/middle-aged subjects (ages 19-49) and 30 older subjects (ages 65-80) to measure age-related differences in drivers' ability to read unique word combinations (of four letters) on green-and-white guide signs. As expected, older drivers required significantly larger letter sizes to read the (unfamiliar) words than younger drivers. Translating the 6-m (20-ft) subject-to-stimulus distance in the laboratory to a requirement of 183 m (600 ft) to read a freeway sign, the data showed that older subjects would require a letter height of 600 mm (24 in), corresponding to an acuity of 20/46. This corresponds to a legibility index of 0.3 m/mm (25 ft/in), for positive contrast (lighter characters on darker background) highway guide signs. In a review of State practices, McGee (1991) reported that Oregon reduced the size of letters on their freeway signs from 333 mm (13.33 in) uppercase and 250 mm (10 in) lowercase to 200 mm (8 in) and 150 mm (6 in), respectively. They received numerous complaints that the signs were difficult to read at highway speeds and they therefore returned the letter sizes to their original heights (George, 1987). By contrast, North Carolina, in consideration of older driver needs, increased the Interstate shield size from 900 to 1200 mm (36 in to 48 in), the uppercase letter size from 400 mm (16 in) to 500 mm (20 in), and the lowercase letter size from 300 mm (12 in) to 375 mm (15 in) on guide signs at freeway-to-freeway interchanges (McGee, 1991). No evaluation was planned to determine the effectiveness of this countermeasure. Garvey, Pietrucha, and Meeker (1997, 1998) conducted daytime and nighttime controlled field studies with older drivers, to compare word legibility and word recognition distances obtained with the Standard Series E(M) font, and a new font with the proprietary name ClearviewTM, which was designed to reduce the effects of a phenomenon referred to as "irradiation," "halation," or "overglow." This phenomenon occurs when bright bold strokes bleed into a character's open spaces under headlight illumination, causing the lettering to appear blurry, rendering the text illegible. The study details are presented on page 126 in Chapter I, Design Element J (Street-Name Signing). Two versions of this experimental font were employed: one version matched Series E(M) in letter width and height, but because of its smaller intercharacter spacing, it resulted in a smaller word area (referred to in thisHandbook as Clear 100); and one version contained letters that were increased in size to 112 percent of the standard font, so that the words created with the experimental font (referred to in this Handbook as Clear 112) were the same size as the standard font words. The signs were erected with a lateral offset of 3.7 m (12 ft) from the center of the observation vehicle (or 1.8 m [6 ft]) outside of the right edge line, and were raised to a height of 1.8 m (6 ft) above the ground. Study results indicated that during the day, the Series E(M) fonts and both of the experimental fonts produced approximately equal reading distances. At night, using low-beam headlights and bright signing materials (see p. 126), the Clear 112 font (occupying as much sign space as the standard font) produced significantly longer legibility distances (22 percent longer) and recognition distances (16 percent increase) than the Series E(M) font. With highway-size signs on 88 km/h (55 mi/h) roadways, this increased legibility could add up to two full seconds, or an additional 49 m (160 ft) to the interval in which drivers must read and respond to a sign. Hawkins, Picha, Wooldridge, Green, and Brinkmeyer (1999) conducted a study of the legibility of three sign alphabets with lowercase letters: the standard U.S.DOT/FHWA Series E(M); Transport Medium (the alphabet used in Great Britain for overhead guide signs with positive contrast); and ClearviewTM (see above). The British Transport letters were designed in the 1950's to eliminate irradiation when viewed at nighttime using headlights (Hawkins et al.,1999), and consequently a narrower stroke width is used for positive contrast signs (white legends on a blue or green background) than is used for negative contrast signs (black legends on white, yellow, or orange backgrounds). Also, the letters are designed to fit on tiles, which are placed side-by-side to create words, eliminating the need to measure distances between words as is done in the U.S. Hawkins et al. indicate that the ClearviewTM font retains the visual proportions of the standard FHWA alphabets, but it also incorporates desirable attributes from foreign and domestic typefaces, particularly British Transport Medium. However, the ClearviewTM letter is typically wider than the same letter in Transport Medium. Hawkins et al. (1999) employed 54 individuals to participate in the controlled field study as follows: 7 "young" drivers, age 35 or younger; 18 "young-old" drivers, ages 55 to 64; and 29 "old-old" drivers age 65 and older. Word legibility and word recognition data were recorded as an experimenter drove three subjects at a time toward the test signs, during daytime and nighttime. Each test sign was created using three, six-letter words arranged vertically on the sign, all in the same font, using high intensity white letters on green high intensity sheeting. Signs measured 3.66 by 2.74 m (12 by 9 ft) and were either ground mounted or mounted overhead. The ground-mounted signs were erected at a height of 2.1 m (7 ft) from the ground to the bottom of the sign, and were placed 9.2 m (30 ft) from the right edge of the travel lane. The overhead signs were erected 6.1 m (20 ft) above the traveled lane. Each word used a 406-mm (16-in) initial uppercase letter, followed by 5 lowercase letters. The lowercase letter size varied somewhat according to the alphabet type, but was generally 75 percent of the uppercase letter size (305 mm [12 in]). Results indicated that the ClearviewTM font was more legible at both the mean and 85th percentile levels than the Series E(M) font for signs placed overhead, both under daytime and nighttime conditions. The 85th percentile daytime legibility index for the young-old drivers was 0.48 m/mm (40 ft/in), and for the old-old drivers it was 0.36 m/mm (30 ft/in) for the Series E(M) font. The extent of the improvement was in the range of two percent, however, some driver groups experienced improvements in legibility distance for the ClearviewTM font that were over nine percent greater than those experienced with the Series E(M) font. Hawkins et al. state that the improvement was greatest for drivers with poor vision (worse than 20/40). For the ground-mounted signs, ClearviewTM was less legible under daytime conditions than Series E(M), and only slightly (less than 2 percent) more legible at night. The Transport Medium font did not show improvements in legibility distance over the Series E(M) font. In terms of recognition distance, for the overhead signs, the ClearviewTM font produced larger recognition distances than the Series E(M) font, in both daytime and nighttime conditions, except for the drivers with minimum (20/40) vision at night. The extent of the improvement in recognition distance was up to 8.7 percent--considerably higher than the improvements found in legibility distance, and translates to an increase in recognition distance of up to 15 m (50 ft). For ground-mounted signs, ClearviewTM produced a small improvement at night among worst-case drivers, but showed no improvement under daytime conditions. The 85th percentile recognition distance for drivers age 65 and older for ground-mounted signs at night with ClearviewTM font was 8.6 percent greater than that obtained with the Series E(M) font. Under a few conditions (85th percentile daytime distance for ground-mounted signs for all subjects, and for those age 65+), the Transport Medium font produced recognition distances that were, on average 3 percent greater than those obtained with the E(M) font. At nighttime, the 85th percentile recognition distance for drivers age 65 and older was 12.2 percent higher for Transport Medium font on the ground-mounted signs than for the Series E(M)font. The authors note that the recognition data showed significant variability from one condition to the next, and caution readers to take care in applying the results. Overall, Hawkins et al. (1999), state that the results of their study indicate that the ClearviewTM font was more effective than the Series E(M) font in the overhead position, in both daytime and at night, with the greatest improvement achieved for the worst-case drivers. They further indicate that while the ClearviewTM font may be more appropriate than the E(M) font for overhead signs, ground-mounted signs should continue to use only the Series E(M) alphabet. Hawkins et al. suggest using different design parameters for overhead and ground-mounted signs to account for the differences in performance characteristics of each. They also note that the ClearviewTM font is an evolving font, and that there are differences in the font used in the Garvey et al. (1997) study and in the current research. In Knoblauch, Nitzburg, and Seifert's (1997) focus group discussions with older drivers, participants indicated that they prefer overhead signs to those mounted on the side of the road, stating a need for redundant (overhead) signs to provide advance notice of upcoming exits, including the distances to each, and indicating whether the exit is on the right or left side of the highway. This report, coupled with findings that the ClearviewTM font provides greater recognition and legibility distance over the standard Series E(M) font when used on overhead signs under both daytime and nighttime conditions, identifies highway destination signs (D1-D3) placed over the highway and fabricated using the ClearviewTM font as the preferred practice to accommodate older drivers. However, until the font undergoes the rule-making process and is approved for use on highway signs, no recommendation can be made in this Handbook regarding the use of ClearviewTM. Moving from a consideration of legibility issues to the broader question of how well a motorist can actually use highway sign information, reading time and ease of recall for sign messages deserve attention. Reading time is the time it actually takes a driver to read a sign message, contrasted with exposure time or available viewing time, which is the length of time a driver is within the legibility distance of the message. As drivers travel, they must look away from the highway to read signs posted overhead or at the side of the road, and then back to the roadway. During each glance, the maximum amount of text that can be read is three to four familiar words or abbreviations. A motorist's rapid understanding and integration of message components in memory will greatly assist his/her recall of the message while deciding upon a response. Two errors in message presentation must be avoided: (1) providing too much information in too short a time and (2) providing ambiguous information that leaves either the intent of the message or the desired driver response uncertain. Mace, Hostetter, and Seguin (1967) conducted laboratory, controlled field, and observational field studies to evaluate how information presentation time (the amount of time that a sign is readable to a driver) and information lead distance (the distance from an exit that the advance sign is placed) affect exiting behavior at freeway interchanges. They found that 403 m (0.25 mi) is inadequate for information lead distance and, because there were few differences in driver exiting behavior with information lead distances of 805 m (0.5 mi) and 1,610 m (1.0 mi), that 805 m (0.5 mi) is optimal. In addition, a viewing time of 5 s was adequate for signs containing one to four pieces of information. Lunenfeld (1993) noted that a driver's short-term memory span is between 0.5 and 2 min, and that drivers may forget advance interchange information messages if the time span between the advance notification and the exit ramp exceeds the memory limit. He advocates the use of repetition for interchange information treatments (multiple/successive signs), which will also aid in situations where a sign is blocked by foliage or trucks. The effect of diagrammatic signing on driver performance at freeway interchanges was studied by numerous researchers in the early 1970's. Bergen (1970) found that graphic guide signs permitted significantly better route guidance performance than conventional signs on certain interchanges, such as collector-distributor with lane drop and multiple split ramps. In pilot studies conducted in New Jersey, Roberts (1972) found that diagrammatic signs that included lane lines were more effective (resulted in a significant reduction in erratic maneuvers) than conventional signs at the interchange of I-287 and U.S. 22, a complex interchange with both left- and right-side exits. Flener (1972) commented on the difficulty in evaluating the effectiveness of traffic control devices in reducing erratic maneuvers at exit gore areas using before and after designs, due to the "novelty effect." Although Roberts (1972) noted that the change could be attributed to the greater attention-getting value of novel signs, it was demonstrated that diagrammatic guide signs provide advance information that is readable at a farther distance than that provided by conventional sign text, as well as information about the number of lanes available for any one movement. Roberts, Reilly, and Jagannath (1974) studied the effectiveness of diagrammatic versus conventional guide signs in a field study at 10 sites. The results were mixed. Several sites showed a reduction in stopping, backing, or weaving erratic maneuvers after installation of the diagrammatic signs. Some sites showed a reduction in stopping and backing maneuvers but an increase in weaving maneuvers (or vice versa). Still other sites showed no change as a function of sign type. Stopping and backing erratic maneuvers were reduced, however, at 9 of the 10 sites. Taylor and McGee (1973) noted that the main advantage of diagrammatic signing lies in the ability to provide information regarding the interchange layout prior to the exit area. Sign format, however, remains an issue. Conflicting evidence on the effectiveness of diagrammatic signs was reported by Gordon (1972), who found that conventional signs produced fewer lane-placement errors and errors on exit lanes and were more quickly responded to than experimental diagrammatic signs tested at six interchanges in a laboratory study. At the same time, an analysis of particular diagrammatic designs showed that when a diagrammatic sign provided a single arrow or a forked arrow, reaction time was faster and there were fewer errors compared with the conventional sign. Zajkowski and Nees (1976) studied subject response time and correctness of lane choice as a function of sign type, in the laboratory. They found that response times were consistently longer for diagrammatic signs than for conventional signs; however, the difference may have been attributable to an increase in information on diagrammatic signs. There were more correct lane-choice responses for conventional signs, and subjects reported more confidence in their lane-choice decisions and a preference for conventional signs. Mast, Chernisky, and Hooper (1972) found that some drivers may require more time to read and interpret information on diagrammatic signs in comparison with conventional signs, and driver information interpretation time may increase as the graphic component of the sign becomes more complex. Older drivers participating in focus group discussions have indicated that they prefer large, lighted overhead signs with arrows that indicate the lanes for specific destinations, especially if they are approaching a fork in the road (Knoblauch, Nitzburg, and Seifert, 1997). These older drivers stated that the arrows on the overhead signs do not always point to the correct lane, causing drivers to change lanes needlessly; they also stated a desire to see signs that indicate when two travel lanes bear to the same destination. Brackett, Huchingson, Trout, and Womack (1992) conducted a survey of 662 drivers in 3 age groups (younger than age 25, ages 25-54, and 55 and older) comparing alternative methods of providing lane assignment information on freeway guide signs. The findings of several comparisons in the research are reported, although no analyses using age as an independent variable were performed. First, when two common routes were displayed side by side on an exit guide sign, approximately one-half of the drivers believed that the destinations referred to different routes to be accessed by different lanes (i.e., drivers spatially cluster information with each arrow, assuming that information located on the left side of a sign is associated with an arrow also on the left side, and information on the right side is associated with EXIT ONLY or EXIT ONLY with an arrow). When destinations were arrayed one below another, 85 percent of the drivers understood that they were a common route. Second, white downward arrows used in a side-by-side format with an EXIT ONLY (E11-1) panel to indicate that two lanes could exit, were misunderstood by 80 percent of the subjects. Third, 56 percent of drivers misinterpreted the phrase NEXT RIGHT on conventional signs as an indication of a mandatory exit, and 30 percent misinterpreted the phrase NEXT LEFT in the same manner, when these signs were placed over the right and left lanes, respectively. Fourth, when conventional MUTCD diagrammatic signs were compared with modified diagrammatic signs that provided separate arrows for each lane, the modified diagrammatic signs resulted in a 13 to 17 percent greater understanding of when a lane must exit and when an adjacent lane may exit or continue through (two-lane exit with optional lane). When the number of arrow shafts exceeded the number of lanes (for example, when there is an auxiliary exit lane downstream of the overhead sign), less than 30 percent of the respondents understood that there would be an added exit lane downstream on the right. With one arrow per lane, comprehension increased by 28 percent over when there were more arrows than lanes (optional use or added lanes). Figure 18 displays: (a) an example of a conventional diagrammatic sign (from the MUTCD figure 2E-7) and (b) a modified diagrammatic for this exit situation.
The following discussion of exit ramp gore delineation focuses on studies conducted to determine which treatments are necessary to ensure rapid and accurate detection of the gore location and ramp heading, particularly under nighttime or reduced visibility conditions. Taylor and McGee (1973) reported that the location of the gore is usually perceived easily during daylight hours, because a driver can rely on a direct view of the geometry, as well as signing and delineation. However, this task becomes considerably more difficult during darkness, because the driver can no longer rely on a direct view of the geometry, and exit gore signing may be misleading because of the inconsistency in the distance at which it is placed from the nose of the gore area from location to location. At night, delineation is probably the most beneficial information source to the exiting motorist, because it outlines and therefore pinpoints the location of the gore. Taylor and McGee (1973) measured the effects of the presence of gore area delineation on driver performance at night, to determine which of various delineation devices (pavement markings, post delineators, raised pavement markers [RPM's], and a combination of treatments) were most effective. Measures of effectiveness included the point of entry into the deceleration lane, the exiting speed, and any erratic maneuvers. Two right-hand exits, one with a parallel-lane type of deceleration lane and one with a direct-taper type, were selected as test sites. Specifically, the treatment conditions were: (1) post delineator treatment--yellow post delineators placed along the ramp edge of the gore area, plus white delineators positioned along the through side; (2) RPM treatment--yellow RPM's placed on the ramp side of the gore (paint) markings, plus white RPM's on the through side; and (3) combination treatment--the post delineator treatment and the RPM treatment installed in combination. The baseline condition for this study was moderately worn painted diagonal gore markings and edgelines, with no other delineation devices. All three delineation treatments produced earlier points of entry into the deceleration lane than under the baseline condition. The RPM's were more effective than the post delineators and produced earlier exiting points. The earliest exiting points were found with the combination of RPM's and post delineators. Gore area delineation reduced the frequency of erratic maneuvers at night at both sites. The RPM technique and combination treatment produced significantly lower exiting speeds than did the use of post delineators at one site, and all three treatments produced lower exiting speeds compared with the baseline condition. The work by Taylor and McGee (1973) also included a comprehensive review of several case studies. As a result of their state-of-the-art summary, coupled with the results of their field observations in the study outlined above, a set of recommendations was developed for pavement marking delineation, post delineators, and RPM's; these recommendations, which have since been widely implemented, are described below. For pavement marking delineation:
Other researchers have also evaluated the effects of RPM's at exit gore locations. RPM's have been shown to reduce erratic maneuvers through (painted) gores at exits and bifurcations. Hostetter, Crowley, Dauber, and Seguin (1989) conducted a controlled field study using 15 subjects ages 18 to 60+, to determine the effect of lighting, weather, and improved delineation on driver performance. Data were obtained on two exits in dry and wet weather under full lighting with baseline delineation (see diagram in Recommendation IIA[4a]). The baseline system is similar to the delineation used at many of the partially lighted interchanges cataloged by the study authors during site selection, and in the opinion of an expert panel convened during the research, constituted a minimum system for partially lighted interchanges. Data were then obtained under partial lighting, with baseline and three improved delineation systems. Upgrade 1 investigated by Hostetter et al. (1989) differed from the baseline in the use of RPM's along the left ramp stripe, and the substitution of fully retroreflective posts (1,150-mm [46-in] strip of 75-mm [3-in] wide sheeting) for partially retroreflective posts (450-mm [18-in] strip of 75-mm [3-in] wide sheeting) in the physical gore. Upgrade 2 differed from the baseline in the deployment of additional posts along the left ramp shoulder to create a spacing of 15 m (50 ft) rather than 30.5 m (100 ft) and in the installation of wide RPM's ("traffic diverters") on the gore strips to replace the 10-mm (4-in) RPM's placed adjacent to the gore stripes in the baseline system. Upgrade 3 replaced all baseline system partially retroreflective posts with fully retroreflective posts except in the gore, used RPM's along the left ramp stripe, and used beaded profiled tape containing a raised-diamond pattern for gore striping. The tape was used because it would project above a film of water during rain. The test sites were a half-diamond interchange and a full diamond which contained very little ramp curvature. The exit ramps were 4.3 m (14 ft) wide, with a single lane widening to two lanes near the intersection with the crossing roadways. Measures of effectiveness included ramp and spot/trap vehicle speeds, overall travel time, deceleration estimates, and lane placement, as well as selected types of erratic maneuvers and brake and high-beam headlight activations. Analysis of delineation effects on ramp and spot speeds, and on speed distributions showed few differences under dry conditions. Under rainy conditions, effects were stronger but were neither large enough nor consistent enough to recommend improved delineation over the baseline system. Although Upgrade 3 produced fewer edgeline encroachments under both dry and wet conditions, from the standpoint of operations, safety benefit, or cost-effectiveness, the upgrade did not demonstrate enough advantage to merit a recommendation for use on diamond interchanges with little ramp curvature. Lerner, Benel, Huey, and Steinberg (1997) conducted a series of laboratory and field studies to identify conspicuity and comprehensibility problems with current object markers across various hazardous situations, for young-middle/aged drivers (ages 20 to 40); young-old drivers (ages 65 to 69) and old-old drivers (age 70 and older). In addition, novel object markers and pavement markings were evaluated to determine whether they improved conspicuity or understanding over the current Types 1, 2, and 3 object markers. With regard to object markers used at gore areas, the MUTCD (section 3C.03) states that "In some cases, there may not be a physical object involved [that needs to be marked], but other roadside conditions such as narrow shoulder drop-offs, gores, small islands, and abrupt changes in the roadway alignment may make it undesirable for a driver to leave the roadway. Type 2 or Type 3 object markers may be used at such locations." In the laboratory experiment conducted by Lerner et al., 64 subjects viewed color photographic illustrations of an object marker situated within a roadway scene. Six stimuli were used to mark gore areas: (1) a Type-1 object marker; (2) a Type-3 object marker; (3) yellow cones; (4) green cones; (5) modified French gore signs (signs used in France, consisting of two, white isosceles triangles pointing left and right on a green background, were modified to show black triangles with a cut-out base pointing left and right on a yellow background); and (6) a novel treatment displaying double modified chevron arrows (directional arrows pointing left and right, derived from the chevron alignment sign, consisting of black arrows on a yellow background). The dependent measure was the correctness of response (e.g., the subject correctly identified the hazard or described the correct driving action). Percent-correct ratings for each marker presented in a gore situation across age were as follows: Type-1 (80%); Type-3 (75%); yellow cones (46.7%); green cones (73.3%); French gore markers (56.3%); and double modified chevrons (87.5%). For drivers over age 70, the percent correct ratings were as follows: Type-1 (83.3%), Type-3 (76.8), and double modified chevron (100%). One finding of interest that should be highlighted here, is the lack of understanding of directional information presented by a solitary Type-3 object marker. In a study conducted during the problem identification stage of this research, participants were correct 39 percent of the time about the direction the marker conveyed (i.e., drive in the direction of the downward pointing stripes). Next, the object markers were viewed on a test track by different groups of subjects in the same three age ranges to determine daytime and nighttime detection distances. Each trial began at 305 m (1,000 ft). An experimenter drove along a test track toward the object marker, with the subject seated in the passenger seat. When a subject was just able to discriminate some feature of the marking, the experimenter was told to stop, and this detection distance was recorded. The experimenter then continued to drive toward the marking, stopping every 15 m (50 ft), at which point the subject described the salient features of the marking. In addition to the markers described above, the following pavement markings were also evaluated: a double edgeline pavement marking, and diagonal hash mark pavement markings. The first finding of interest was that the threshold distances were significantly greater for the post-mounted marker types than for the pavement marking types. There were no main effects of age group or marker type for the pavement markings and no interactions between these variables. The mean nighttime detection distance for the hash marks was 68 m (224 ft) and for the double edge line 69 m (226 ft). By comparison, all of the subjects detected all of the other post-mounted markers at 305 m (1,000 ft) at night under low-beam headlight illumination. This finding underscores the importance of including post-mounted markings at gore areas, to supplement pavement markings applied in these areas. There was no age group effect or interaction between age group and post-mounted marker type for detection distance. In terms of nighttime symbol recognition distance, the Type-1 and Type-3 object markers had the highest mean recognition distances (240 m and 277 m [790 ft and 910 ft] respectively). While Type 3 was the single best performer, both had significantly higher mean symbol shape recognition distances than all other markers. Next in terms of nighttime symbol recognition distance were the Type-2 object marker, the double modified chevrons, and the French gore signs, which were not significantly different from each other. Significant main effects of age group and marker type were found but there was no significant interaction between the two. The only marker that resulted in a significant change in daytime detection distance was the small Type-2 marker, for which detection distance was significantly reduced for the age 70 and older group versus the young/middle-aged subjects. The mean detection distance of the Type-2 object marker was 280 m (919 ft) by the young-old drivers and 245 m (803 ft) by the old-old drivers, compared to 305 m (1,000 ft) for the young/middle-aged drivers. In fact, all of the subjects in the age 65 to 69 age group saw all other post-mounted markers at 305 m, and the drivers over age 70 saw all other post-mounted markers at distances ranging from 297 to 305 m (973 to 1,000 ft). The Type-2 marker also resulted in significantly shorter daytime color recognition distances than any other post-mounted marker type. Finally, a limited validation study conducted by Lerner et al. on actual roads in Calvert County, Maryland, compared the Type-1 object marker and the double modified chevron post mounted markers at a gore situation. The Type-1 object marker produced a correct response rate of 50 percent, compared to 82.4 percent for the two modified chevron design, across driver age groups. However, the double modified chevron marker was better understood than the Type-1 marker at a gore location, only during the daytime. Thus, based on the findings of the laboratory and controlled field studies conducted by Lerner et al. (1996), undelineated gores (i.e., without any object marker) were identified only 1.5 percent of the time by drivers age 75 and older, highlighting the importance of using object markers at such locations. Another finding of importance is that the Type-2 object marker is a poor choice for marking gore areas, particularly for older drivers. The novel double modified chevron marker may be the best candidate for marking gore locations; however, more research would be required to enable a recommendation to be made for its use, based on its poorer nighttime performance compared to the Type-1 marker. Currently, the MUTCD only allows for the use of a Type-2 or a Type-3 marker for objects adjacent to the roadway (such as a gore). Based on the poor performance demonstrated by the Type-2 marker in the Lerner et al. research, a recommendation to use the Type-3 marker at freeway gore locations is made in thisHandbook. It is also noted that, based on the comprehension data, a Type-1 marker may be a better candidate--for use as an experimental device--when other treatments have not proven successful. B. Design Element: Acceleration/Deceleration Lane Design Features
Table 31. Cross-references of related entries for acceleration/deceleration lane design features.
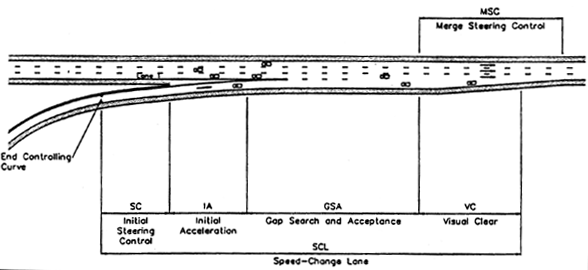
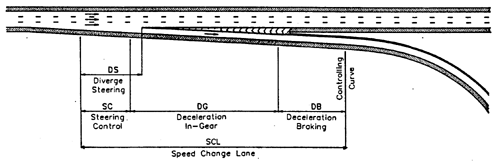
Studies dating back to the 1960's have addressed the effects of ramp design on driving performance; however, Koepke (1993) reported that the basic design criteria, and therefore design standards, used by governmental agencies to design exit and entrance ramp terminals have not changed in more than 30 years. Recommendations for selected design features for interchange ramps may be justified by both the changing characteristics of the driving population and the operating characteristics of the highway system. Age-related functional decreases in visual acuity, motion judgment, and information-processing capabilities cause increased difficulty for older drivers entering and exiting highways. At the same time, traffic density has increased dramatically, resulting in more complex decision-making and divided-attention requirements at these sites. In a survey of 664 drivers age 65 and older, one-half of those surveyed (49 percent) reported that the length of freeway entry lanes was a highway feature that was more important to them now compared with 10 years ago (Benekohal, Resende, Shim, Michaels, and Weeks, 1992). The difficulties older drivers are likely to experience on freeway ramps, particularly acceleration lanes, are a function of changes in gap judgment ability resulting from a diminished capability to accurately and reliably integrate speed and perceived distance information for moving targets; reduced neck/trunk flexibility; and age-related deficits in attention-sharing capabilities. First, the requirement to yield to approaching traffic on the mainline requires a merging driver to assess the adequacy of gaps in traffic by turning his/her head to look over the shoulder and/or by using the sideview mirrors. In a survey of 297 adults ranging in age from 22 to 92, which was conducted to gain a greater understanding of the visual difficulties they encounter while driving, the older participants reported greater difficulty judging both the speed of their vehicle and the speed of other vehicles, and expressed a concern over other vehicles "moving too quickly" (Kline, Kline, Fozard, Kosnik, Schieber, and Sekuler, 1992). It has been shown that older persons require up to twice the rate of movement to perceive that an object is approaching, and require significantly longer to perceive that a vehicle is moving closer at a constant speed, compared with younger individuals (Hills, 1975). Darzentas, McDowell, and Cooper (1980) used Hills' data in a simulation model to estimate conflict involvement for each class of subject as a function of main-road flow and speed. In the model, a conflict occurs when a poor gap acceptance decision is made by a driver, causing an oncoming vehicle to decelerate to avoid collision. The model indicated that older drivers were involved in more conflicts than younger drivers of the same gender, and male drivers were involved in more conflicts than females in the same age class at all flows. Other findings describing age differences in driver behavior on acceleration ramps are reported in a National Highway Traffic Safety Administration (NHTSA) study of driver age and mirror use. In this study, which measured the time required to make a "safe/unsafe" maneuver decision in a freeway lane-change situation, old-old drivers (age 75 and older) consistently required longer response times to make a lane-change decision than a group of drivers ages 65-74, who in turn demonstrated exaggerated response times compared with a younger control group (Staplin, Lococo, Sim, and Gish, 1996). This was a simulator study, using large screens showing dynamic videos of overtaking vehicles, in correct perspective, as the test stimuli; also, all drivers were forced to rely on their mirror information alone to make the maneuver decision in this research. The mean response time for a lane-change decision for the oldest (75 and older) driver group in this study, across a large number of trials in which the relative speed of the overtaking vehicle was varied between 16.1 and 40.25 km/h (10 and 25 mi/h) (i.e., faster than the subject's own vehicle was traveling when the video was shot), changed with changes in the target distance (separation of overtaking vehicle from driver). At close separation distances (30.5 to 61 m [100 to 200 ft]), where virtually all older drivers quickly decided that a lane-change maneuver was unsafe, decision latency averaged approximately 2.1 s. At a 61-m (200-ft) separation distance, some drivers were more willing to merge, and required longer to reach a maneuver decision, producing a mean latency of 2.5 s. At a 91.5-m (300-ft) separation distance and above (between the overtaking vehicle and the driver wishing to change lanes), maneuver decision latency reached an asymptote at 2.95 s, as increasing percentages of subjects accepted the available gap ahead of the overtaking vehicle. Findings from reviews of crash rates and ramp characteristics are also relevant. Lundy (1967) found that off-ramp crash rates were consistently higher than on-ramp crash rates. However, Oppenlander and Dawson (1970) reported that at urban interchanges, 68 percent of the interchange ramp crashes occurred at entrance ramps, while 32 percent occurred at exit ramps; for rural interchanges, these percentages were reversed. Similarly, Mullins and Keese (1961) reported that in urban areas, 82 percent of the interchange crashes occurred at on-ramps and 18 percent at exit ramps. Further, Lundy's (1967) study of 722 freeway ramps in California found that the crash rate was reduced for off-ramps when deceleration ramps were at least 274 m (900 ft) long (not including the length of the taper), for on-ramps when acceleration lanes were at least 244 m (800 ft) long, and for weaving sections that were at least 244 m (800 ft) long. Oppenlander and Dawson (1970) also concluded that safety was improved for on-ramps, off-ramps, and weaving areas 244 m (800 ft) in length or greater. Cirillo (1970) found that increasing the length of weaving areas reduced crash rates, and increasing the length of acceleration lanes reduced crash rates if merging vehicles constituted more than 6 percent of the mainline volume. Reduced crash rates from lengthening of deceleration lanes also appears to be related to the percentage of diverging traffic, with significant safety benefits beginning when 6 percent of the mainline traffic diverges (Cirillo, 1970). The most comprehensive work to develop guidelines for freeway speed-change lanes (SCL's) was conducted in NCHRP project 3-35 by Reilly, Pfefer, Michaels, Polus, and Schoen (1989), who collected data on the entry and exit processes by videotaping 35 sites in three States. An entrance model was developed, based on gap acceptance and acceleration characteristics of drivers as determined by the controlling geometry. An exit model was developed, based on the driver's behavioral response to design geometrics. The purpose of the research was to develop new criteria that would offer greater flexibility than the (then) current AASHTO (1984) guidelines, which "do not provide the designer with the ability to reflect important geometric and traffic conditions" (Reilly et al., 1989). In this research, it was reported that the AASHTO (1984) SCL design criteria were based on the acceleration and deceleration characteristics of early-model vehicles, with little regard to traffic flow characteristics or driver behavior. The design values produced by the NCHRP project entry model for SCL length were slightly lower at low freeway speeds and significantly higher at moderate to high freeway speeds when compared with the 1984 AASHTO values. The exit model values for length were significantly higher than 1984 AASHTO values for all freeway and ramp speeds. The findings of the study suggest that for certain traffic conditions, the current SCL design criteria do not provide sufficient length for proper execution of the merge or diverge process. This is of particular importance with regard to the age-related diminished capabilities documented above. In the consideration of acceleration lanes and entrance ramps, Michaels and Fazio (1989) reported on the model of freeway merging developed during the conduct of NCHRP project 3-35, to define SCL length. In this model, the merge process is composed of four sequential decision components, to which a fifth component is added: (1) a steering control zone (SC), which involves the steering and positioning of the vehicle along a path by steering from the controlling ramp curvature onto the SCL; (2) an initial acceleration zone (IA), in which the driver accelerates to reduce the speed differential between the ramp vehicle and the freeway vehicles to an acceptable level for completing the merge process; (3) a gap search and acceptance zone (GSA), during which the driver searches, evaluates, and accepts or rejects the available lags or gaps in the traffic stream; (4) a merge steering control zone (MSC), during which the driver enters the freeway and positions the vehicle in the nearest mainstream lane (Lane 1); and (5) a visual clear zone (VC), which provides a buffer between the driver and the end of the acceleration lane, where the driver can either merge onto the freeway in a forced maneuver or abort the merge and begin to decelerate at a reasonable rate. Associated with each of these components is a length; the total SCL length is the sum of the SC, IA, GSA, and VC components. The entry process is diagrammed in figure 19. Design values for entrance ramp acceleration lane lengths were developed as a part of NCHRP 3-35 based on driver behavior and traffic flow characteristics obtained from field studies and known human factors. The model assumes that a driver will adopt a significant non-zero speed differential at the beginning of the GSA so as to facilitate entry into the traffic stream. In this model, it is recommended that a value of 16.1 km/h (10 mi/h) be used for that speed differential. In this research, it was found that it is not only the speed differential between the ramp and freeway vehicles, but also the position of the vehicles relative to each other and the availability of a suitable gap in the freeway traffic, that determine when the merge will occur.
The time for the SC is considered to be a constant, which is approximately 1 to 1.5 times the entry velocity, as it was estimated that a 1-s steering transition from ramp to acceleration lane would be sufficient. Therefore, at an entry speed of 15 m/s (50 ft/s), a maximum of 23 m (75 ft) should provide for the entry steering maneuver. The length of the acceleration segment (IA) depends on the magnitude of acceleration that is acceptable to the driver. If the driver accelerates at 1.5 m/s2 (4.8 ft/s2) for only 2 s, he or she will have traveled 33.5 m (110 ft), which, when added to the steering control distance, means that the driver will have a clear view of oncoming traffic for a minimum of 49-56 m (160-185 ft). The appropriateness of these model assumptions for older drivers was not addressed in the NCHRP project, however. As emphasized in NCHRP 3-35, the GSA is a key component of the entry model; this is especially true for older drivers. This length includes the distance required to search for and accept a headway, and is determined by the distribution of headways in Lane 1 of the freeway, the gap acceptance characteristics of the driver of the ramp vehicle, the design vehicle (car or truck), and the volume on the ramp. A vehicle on the mainline approaching a driver on the freeway ramp appears larger to the merging driver the closer it becomes. The angular velocity is the rate of change in the angle between the approaching vehicle and the merging driver over time. The angular velocity threshold--a critical variable because of its impact on GSA length and overall acceleration lane length--is set at 0.002 rad/s in the entry model. This value is based on field measurements and ensures that 85 percent of observed drivers in model validation studies (age not reported) will accept a gap when the rate of approach of the mainline vehicle translates into an angular velocity consistent with this value. The GSA length requires the use of 16 equations, which are documented in the NCHRP 3-35 report. There are a number of problems in applying these formulations using an older design driver, however. While it has been reported that drivers accept shorter gaps in freeway traffic than assumed by the model (Koepke, 1993), critical gap size for this as for other maneuvers increases significantly with increasing driver age. In addition, whereas Michaels and Fazio (1989) cited observed behavior whereby drivers judge gaps in sequence, increasing the probability of finding one acceptable by accelerating between successive searches, there is ample anecdotal evidence of older drivers slowing and often stopping in acceleration lanes when their initial search does not reveal an acceptable gap to merge with traffic on the mainline (Transportation Research Board, 1988). Finally, noting the increased reliance on mirror information for gap judgments in this situation by (older) persons with reduced neck/torso mobility, the exaggerated maneuver decision latencies in the Staplin et al. (1996) research on mirror-based lane change judgments reported earlier bear on GSA (and therefore, acceleration lane) length requirements. The VC length is determined such that the pavement area at the end of the ramp taper provides the driver with sufficient distance to implement a forced merge or decelerate to a stop, to avoid running off the acceleration lane if he/she has not found an acceptable gap. In the model, if a driver on the acceleration lane is traveling at a speed of 21-24 m/s (70-80 ft/s), then as he/she approaches to within 61-76 m (200-250 ft) of the end of the lane or when the taper produces a lane width of less than 3 m (10 ft), the driver will begin to decelerate. Clearly, the delineation of the pavement width transition at the ramp terminus must be highly conspicuous, to accommodate older driver diminished visual capabilities. Another issue addressed by NCHRP 3-35 was acceleration lane geometry. Koepke (1993) reported that 34 of the 45 States responding to a survey conducted as a part of NCHRP 3-35 on SCL's use a parallel design for entrance ramps. Thirty of the agencies interviewed use a taper design for exit ramps and a parallel design for entrance ramps. The parallel design requires a reverse-curve maneuver when merging or diverging, but provides the driver with the ability to obtain a full view of following traffic using the side and rearview mirrors (Koepke, 1993). Although the taper design reduces the amount of driver steering control and fits the direct path preferred by most drivers on exit ramps, the taper design used on entrance ramps requires multitask performance, as the driver shifts between accelerating, searching for an acceptable gap, and steering along the lane. Reilly et al. (1989) pointed out that the taper design for entrance lanes poses an inherent difficulty for the driver and is associated with more frequent forced merges than the parallel design. Forced merges were defined as any merge that resulted in the braking of lagging vehicles in Lane 1, or relatively quick lane changes by lagging vehicles from Lane 1 to a lane to the left. The parallel design would thus appear to offer strong advantages in the accommodation of older driver diminished capabilities. In the consideration of deceleration lanes and exit ramps, Livneh, Polus, and Factor (1988) reported that studies analyzing traffic behavior on deceleration lanes have been few in number. They summarized Fukutome and Moskowitz's (1963) efforts to determine whether the length of the ramp tangent approaching the ramp curve had any effect on ramp speed. Fukutome and Moskowitz (1963) found that the length of the deceleration lane from the end of the taper should be at least 137 m (450 ft) when the ramp curve has a radius of 122 m (400 ft), and noted that shorter distances resulted in significantly lower speeds at the nose, which were reflected backward, causing interference to through traffic on the freeway. The results suggested that the shorter distances resulted in unnaturally high rates of deceleration, primarily affecting unfamiliar drivers who are more likely to have adjustment problems when unusual deceleration rates are applied. Fukutome and Moskowitz (1963) found that drivers prefer some moderate deceleration rate as opposed to an extremely low one afforded by a lengthy distance in which to accomplish the speed change. The design should allow the vehicle to enter the deceleration lane at a speed comparable to the speed of through traffic and decelerate in the deceleration area to the velocity required to negotiate the exit ramp properly. As in the case of acceleration lanes, the speed-change maneuver on deceleration lanes was segmented into components in NCHRP 3-35 (Reilly et al., 1989). These components include: (1) the diverge steering zone, LDS, which is the distance upstream from the exit gore at which a driver begins to diverge from the freeway; (2) the steering control zone, LSC, in which the driver steers and positions a vehicle from the freeway lane onto the deceleration lane; (3) the deceleration in-gear zone, LDG, in which the vehicle decelerates prior to braking; and (4) the deceleration while braking zone, LDB, in which braking occurs in order to reach a reduced speed dictated by the geometrics, terminus, or traffic conditions on the off-ramp. The total deceleration lane length, LSCL, is equal to LSC+ LDG+LDB. Figure 20 diagrams the exit process defined in the NCHRP research. The lengths of the four zones in the exit process were combined into two design elements: the LSCL, which is the total length required to complete the exit process, and the L DS, which defines the distance upstream from the nose of the exit wedge at which the beginning of the deceleration lane must be placed. Depending on the location of the speed-controlling point on the ramp, which could be controlling curvature or a queue of stopped vehicles, the driver will decelerate in-gear until the perceived rate of approach to this point dictates the need to brake. Therefore the total deceleration of the vehicle is a combined process between in-gear and braking. The length of the LDG zone is the most sensitive to variations in diverge speeds; the LSC and LDB zones vary little with diverge speed. The design criteria for deceleration lanes are presented in NCHRP 3-35 Speed-Change Lanes User Design Guidelines; these criteria can be used to determine the required lengths for a new design, to test the appropriateness of an existing design, or to retrofit older designs not used by designers today. A comparison of the values generated by the NCHRP exit model and current AASHTO values was presented by Reilly et al. (1989). For most freeway and ramp speeds, the model deceleration lane lengths are longer than the AASHTO values. The difference between the exit model and AASHTO values increases with increasing ramp speed. The NCHRP model was validated using data observed at 12 sites. An assumption in the development of the exit model was that the speed of an exiting vehicle during the diverge steering maneuver is constant, and therefore the speed of the vehicle during the diverge equals the freeway speed. Data collected at 12 exiting sites during this study confirmed that the reduction in speed was normally less than 3.2 km/h (2 mi/h), regardless of the initial speed. However, it was found that a significant percentage of drivers reduce their speed while still on the freeway, prior to the diverge maneuver, with the average speed of 83.7 km/h (52 mi/h) across all sites prior to the diverge maneuver. Next, a
critical element in the exit model is the angular velocity threshold, which determines LDS and LDB. As a driver approaches an exit, he/she first recognizes the taper diverging from the freeway lane, which is essentially a widening of the overall roadway. This recognition is determined mainly by the change in the driver's visual angle subtended by the roadway; however, other elements such as edge markings and signing will generate a component of angular velocity. In addition, the angular velocity will reach threshold at greater distances for a curved ramp than for a simple diverging ramp, resulting in the use of more deceleration lane length in cloverleaf interchanges than in diamond interchanges. Complementing the findings in NCHRP 3-35, Livneh et al. (1988) observed traffic using freeway deceleration lanes at two freeway sites to record actual behavior and compare it to current design practice. They concluded that a considerable difference exists between the AASHTO assumptions and actual driver behavior along deceleration lanes. The principal discrepancies were in average speeds and in rate and duration of deceleration in-gear and while braking. The speed of both cars and heavy vehicles at the beginning of the deceleration lane was always lower than the average speed of through vehicles. The deceleration values obtained were lower than the values recommended by AASHTO. On properly designed long lanes, the duration and length of deceleration in-gear were longer than 3 s, as assumed by AASHTO, and deceleration-in gear took place for an average of 10 s until the speeds of vehicles slowed from about 85 percent of their average running speed on the through lane--the initial speed at the beginning of the taper--to an average of 67 percent. From this point, which was 200 m (650 ft) from the beginning of the deceleration lane, braking started and continued until speeds were further reduced to meet the average running speed required to negotiate safely the ramp curve that followed. To meet the needs of older drivers, the point of controlling curvature on an exit ramp, as well as the curve speed advisory, must be highly conspicuous to create an appropriate expectancy of the required vehicle control actions. With this expectancy, older drivers should be able to negotiate deceleration lane geometries meeting AASHTO or NCHRP guidelines competently (also assuming effective gore delineation as discussed in Handbook section II-A). Raised curve delineation treatments are recommended in this regard; post-mounted delineators or chevrons are particularly effective (see Handbook section III-A). In addition, Holzmann and Marek (1993) noted that ramp operations may be improved by moving the relatively sharp ramp curvature away from the ramp terminal. Finally, a recent review of interchange design issues, necessitated by changes in road user characteristics and current research, approached ramp geometry as a three-dimensional system (Keller, 1993). According to this review, the factors that influence ramp alignment and superelevation design include design consistency and simplicity, the roadway user, design speed, and (stopping and decision) sight distance. Because driver reaction time is slowed when elements of ramp geometry are different than expected, design should provide for long sight distances, careful coordination between horizontal and vertical alignment, generous curve radii, and smooth coordinated transitions, particularly when complex interchange designs are unavoidable. Increasing the sight distance and simplifying interchange layout can reduce some of the effects of decreasing visual acuity, short-term memory decline, reduced decision making ability, reduced ability to judge vehicle speed, decreased muscle flexibility and pain associated with arthritis, and early fatigue and slower reaction times associated with increasing driver age. With regard to design speed, Keller (1993) stated that the ramp proper should be viewed as a transition area with a design speed equal to the speed of the higher speed terminal wherever feasible, and that few diagonal or loop ramps are long enough to accommodate more than two design speeds. Thus, the terminals and the ramp proper should be evaluated to determine the appropriate speed for design. In terms of stopping sight distance (SSD) requirements, Keller (1993) noted that designers can reduce drivers' stress at interchanges by providing sight distances greater than the minimum SSD's. Although a brake reaction time of 2.5 s is representative of 90 percent of the drivers used in a 1971 study by Johansson and Rumar, and is used in the AASHTO SSD formula, it has been suggested that a 3.5-s perception and braking time should be used to accommodate the elderly with diminished visual, cognitive, and psychomotor capabilities (Gordon, McGee, and Hooper, 1984). Another assumption in the AASHTO calculations for SSD is a driver eye height of 1.06 m (3.5 ft); the eye height of older drivers is often less. Finally, alignment affects braking distance, such that curves impose greater demands on tire friction than tangents, resulting in increased braking distance when the friction requirements of curves and braking are combined (Glennon, Neuman, and Leisch, 1985). Keller (1993) noted that locations where SSD values do not provide the time necessary to process information and react properly highlight the importance of the use of decision sight distance (DSD). Examples of locations at interchange ramps where DSD is desirable include ramp terminals at the main road, especially at an exit terminal beyond the grade separation and at left exits; ramp terminals at the cross road; lane drops; and abrupt or unusual alignment changes. AASHTO guidelines (1994) note that sight distance along a ramp should be at least as great as the safe stopping distance. The sight distance on a freeway preceding the approach nose of an exit ramp should exceed the minimum stopping distance for the through traffic speed, desirably by 25 percent or more, although the desirable goal remains DSD. DSD values--which include detection, recognition, decision, and response initiation and maneuver times--are provided in AASHTO (1994) table III-3 by design speed and type of avoidance maneuver required. Lerner, Huey, McGee, and Sullivan (1995) measured DSD for three driver age groups (ages 20-40, ages 65-69, and age 70 and older) at six freeway lane drop locations. While perception-reaction time values measured by Lerner et al. (1995) were actually somewhat lower than the values assumed by AASHTO, they nevertheless found that the 85th percentile total time required by each age group for detection, decision and maneuvering exceeded the recommended AASHTO value of 14.5 s. The freeway total times averaged 16.5 s, 17.6 s, and 18.8 s, for the three groups (from youngest to oldest), respectively. The researchers explained that the original AASHTO work assumed free-flow traffic conditions, in which drivers were not required to wait for a gap in traffic to change lanes. The Lerner et al. (1995) study, by comparison, was conducted on heavily traveled urban freeways, and subjects often had to wait for gaps in traffic before maneuvering. This led to significantly higher maneuver times than were assumed by AASHTO. No modifications to the existing DSD standards were deemed necessary. Keller (1993), reporting on the results of a 1991 survey about distances used when locating ramp exits beyond a crest vertical curve, indicated that 15 (38 percent) of State design agencies use the safe SSD, 9 (23 percent) use the safe SSD plus 25 percent, and 12 (31 percent) use DSD.
C. Design Element: Fixed Lighting Installations Table 32. Cross-references of related entries for fixed lighting installations.
Research has documented that: (1) freeway interchanges experience a higher crash rate than the mainline (Cirillo, 1968); and (2) urban freeway lighting has beneficial safety effects (Box, 1972). Cirillo (1968) also found a reduction in the number of interchange crashes as lighting intensity increased. Gramza, Hall, and Sampson (1980) evaluated the interchanges in the Interstate Accident Research (ISAR-2) database at which lighting had been introduced during the 10-year study period. During the daytime, there were 83 crashes before lighting and 80 crashes after lighting. At nighttime, by comparison, there were 76 crashes before lighting and 43 crashes after lighting. Taylor and McGee (1973) found a reduction in erratic maneuvers at exit lane drop sites in a before after study, when the exit area was illuminated during the "after" period of data collection. Although nighttime driving is associated with a higher crash risk for drivers of all ages, the effects of aging on the visual system are further compounded by the effects of darkness. The aging process causes gradual declines in a variety of visual functions, including acuity, contrast sensitivity, glare recovery, and peripheral vision, making night driving especially difficult for older drivers. Of particular difficulty is the ability to notice and recognize objects at night and in low-light conditions such as dawn and dusk, rain, fog, haze, and snow. Between age 20 and age 70, aging directly reduces contrast sensitivity by a factor of about 3.0 (Blackwell and Blackwell, 1971); older drivers are thus at a greater relative disadvantage at lower luminance levels than younger drivers. The impact for the older driver of lost sensitivity under nighttime conditions should be assessed against the nature of the night driving task. Even at night, most visual information is processed by the cone or daylight system in the foveal region of the retina where fine detail is resolved. Artificial lighting raises the illumination level of the roadway environment to the photopic range so that reading and tracking functions can occur. The peripheral rod system participates primarily by alerting the driver to a weaker signal away from the foveal line of sight, which may then be oriented to by the driver with a foveal fixation. The implication of a loss in rod sensitivity is that a much brighter peripheral signal will be needed to elicit proper visual attention from the driver, and that signals now falling below threshold will be ignored. In fact, the signal may need to be 10 to as much as 100 times brighter, depending on age and object color (Staplin, Lococo, and Sim, 1990). Since both rod and cone thresholds increase with age, it is also true that more light will be needed to bring important tasks such as reading and tracking (path maintenance) above the cone limit. In a survey of 1,392 older drivers ages 50 to 97, 70 percent indicated that more highway lighting is needed on freeways. These respondents identified the following areas where more lighting is needed: interchanges, construction zones, and toll plazas (Knoblauch, Nitzburg, and Seifert, 1997). There are a number of other aspects of vision and visual attention that relate to driving. In particular, saccadic fixation, useful field of view, detection of motion in depth, and detection of angular movement have been shown to be correlated with driving performance (see Bailey and Sheedy, 1988, for a review). While these visual functions do not appear to have strong implications for highway lighting practice, it could be advantageous to provide wider angle lighting coverage to increase the total field of view of older drivers. High-mast lighting systems can increase the field of view from 30 degrees (provided by conventional fixtures) to about 105 degrees (Hans, 1993). Such wide angles of coverage provided by high-mast lighting might have advantages for older drivers in terms of peripheral object detection, thus easing the task of identifying ramp geometry, traffic control devices, and traffic patterns. However, while effective high-mast systems have been demonstrated (Ketvirtis and Moonah, 1995), such installations also tend to sacrifice target contrast for the increased field of view they provide. Hans (1993) defines "high mast" as any lighting structure that rises at least 18 m (60 ft) above road level. Some designs extend up to 46 m (150 ft) and higher above the ground. One pole, anchored 15 to 21 m (50 to 70 ft) from the edge of the roadway, may be used to support a cluster of 3 to 12 luminaires. As a comparison, conventional cobra-head poles mounted on the shoulder support 1 or 2 luminaires, at a height of 8 to 15 m (26 to 50 ft) above the road. For example, the New Jersey Roadway Design Manual defines their high-mast lighting system as one that utilizes a mounting height of 30.5 m (100 ft) with a cluster of a maximum of 8, 400-watt, high-pressure sodium luminaires, and their conventional lighting system as one that utilizes mounting heights of 7.9 m (26 ft) with 150-watt, high-pressure sodium luminaires for ramp application. The NJ Manual states that tower lighting (high mast) shall be considered first (over conventional lighting) for full interchange lighting, preferably using 400-watt cutoff-type luminaires; however, non-cutoff luminaires may be employed if the designer can justify their use. The following paragraphs summarize studies that: (1) evaluated the effects of lighting on crash experience at interchanges; and (2) evaluated specific aspects of driver performance as a function of number and type of luminaires at an interchange. Gramza et al. (1980) conducted a crash analysis of 400 nighttime crashes that occurred at 116 interchanges during the period of 1971-1976, in 5 States (Maine, Maryland, Minnesota, Texas, and Utah). In an analysis of the presence of high-mast lighting at interchanges, versus no lighting or other kinds of interchange lighting, the presence of high-mast lighting was found to significantly reduce total crash rates, total crashes involving fatalities and injuries, and crashes involving fatalities and injuries other than the vehicle-to-vehicle and vehicle-to-fixed-object categories (e.g., crashes caused by striking pedestrians). Table 33, taken from Gramza et al. (1980), shows the predicted effect of high-mast lighting on annual number of crashes. Gramza et al. (1980) also found that although the number of lights at an interchange and the level of illumination had no significant effect on the total number of nighttime crashes, significant decreases in a variety of distinct crash types were found with increases in illumination. Increases in the illumination level--measured in lux or horizontal footcandles (hfc)--at interchanges were associated with significant reductions in two types of crashes: vehicle-to-fixed-object crashes involving property damage, and vehicle-to-vehicle crashes involving fatalities and injuries. In addition, increases in the number of lights active at an interchange were found to significantly influence (reduce) the following two crash types: vehicle-to-fixed-object crashes involving fatalities and other injuries, and other property damage crashes. The number of lights at an interchange ranged from 0 to 114, with an average of 16 active lights and a median of 10. Thirty-two percent of the interchanges were unlit. As lighting levels increased, crash rates decreased. Illumination ranged from 0.0 lux to 10.76 lux (0.0 hfc to 1.0 hfc), with an average of 5.49 lux (0.51 hfc) for the lighted sections. These four crash types accounted for 61 percent of the crashes observed in the sample. Table
33. Relative annual effect of lighting type on total nighttime crashes (n=400)
at urban and nonurban interchanges.
Since there were relatively few crashes per interchange per year, Gramza et al. (1980) employed a model to predict the number of each crash type per year, assuming 3 levels of traffic volume (average nighttime traffic of 5,000, 7,500, and 10,000 vehicles) at partial cloverleaf and other types of interchanges, and allowing varying levels of illumination or varying numbers of lights. The predicted relationships between traffic volume, lighting, and crash frequency showed that reductions in number of lights and in level of illumination (hfc) resulted in higher frequencies of vehicle-to-fixed-object and other property damage crashes, for all traffic volumes. Vehicle-to-vehicle crashes were also shown to increase in frequency as illumination was reduced, for all interchange types. In addition, the findings at the level of one interchange were translated to estimate, as an overall annual impact for the five-State sample, the relative influence of the lighting variables on numbers of crashes at interchanges through three levels of night traffic volume. A level of 7.53 lux (0.7 hfc) was used to represent the allowable base of average maintained illumination. Overall, the model predicted that reductions in levels of illumination appear to cause greater increases in the number of crashes than do reductions in numbers of lights (Gramza et al., 1980). Although the work of Gramza et al. (1980) is noteworthy in its attempt to quantify the complex relationships between interchange lighting and safety, it is critical to remember that their model was applied to data derived to fit 1975 conditions--including, by implication, both the then-current number of older drivers and their exposure to this highway feature during nighttime operations. By contrast, present and anticipated future driving patterns of older drivers--whose actual numbers, as well as their percentage of all drivers, will increase dramatically--show much higher use rates for freeways (Lerner and Ratté, 1991). This trend should sharply accentuate the safety impacts cited by Gramza et al. Janoff, Freedman, and Decina (1982) conducted a study to determine the effectiveness of partial lighting of interchanges, where partial interchange lighting (PIL) was defined as lighting that consists of a few luminaires located in the general areas where entrance and exit ramps connect with the through traffic lanes of the freeway (between the gore and the end of the acceleration ramp/beginning of the deceleration ramp). A complete interchange lighting (CIL) system includes lighting on both the acceleration and deceleration areas plus the ramps through the terminus. In their survey of approximately 50 agencies which supplied information on over 14,000 interchanges and over 7,500 interchange lighting systems, it was found that 37 percent of the interchange lighting was CIL and 63 percent was PIL. An observational field study was conducted to determine the effects of lighting level (various levels of PIL, CIL, no lighting, and daylight), geometry of the interchange (straight versus curved ramps), and presence of weaving area versus no weaving area on driver behavior and traffic operations. PIL was stratified by the number of lights at each ramp, and included three levels: PIL 1 (one light), PIL 2 (two lights), and PIL 4 (four lights). CIL test sites included a full cloverleaf in suburban Baltimore, Maryland, and a three-leg interchange in suburban Philadelphia, Pennsylvania, with luminaire mounting heights of 12.2 and 9.5 m (40 and 31 ft), respectively. The dependent measures included speed and acceleration of individual vehicles traversing the interchanges; merge and diverge points of individual vehicles entering the main road or leaving it; and erratic maneuvers such as brake activations, use of high beams, and gore or shoulder encroachments. Both field studies indicated that CIL provided a better traffic operating environment than did PIL and that any interchange lighting performed better than no lighting (although the differences were not always as great as between CIL and PIL). In particular, to the extent that traffic flow and safety are important issues, the Janoff et al. study concluded that existing CIL systems should not be reduced to PIL systems. When installing new lighting and economics are not an overriding issue, a CIL system is preferred over a PIL system. However, a PIL system with one or two luminaires per ramp will normally perform better than no lighting at far lower cost than a CIL system. PIL systems with fewer luminaires (one or two) frequently performed better than PIL systems with greater numbers of luminaires (four). This was explained by the fact that drivers may experience transitional visibility problems under the PIL conditions when they are forced to drive from dark to light to dark areas and at the same time perform complex maneuvers such as diverging, merging, and tracking a 90-degree curve. Hostetter, Crowley, Dauber, and Seguin (1989) noted that when luminaires are not placed downstream of the physical gore of a partially lighted exit ramp, a driver proceeds from a lighted area to a nonlighted area. Citing evidence from various researchers (Boynton and Miller, 1963; Boynton, 1967; Boynton, Rinalducci, and Sternheim, 1969; Boynton, Corwin, and Sternheim, 1970; Rinalducci and Beare, 1974; and Fredericksen and Rotne, 1978), they reported that the effect of going from higher to lower levels of luminance results in a reduction in visual sensitivity, which would help explain the findings of Janoff et al. (1982) that performance under partial lighting was better with fewer luminaires. On a final note, Bjørnskau and Fosser (1996) conducted a before-after study on a section of roadway in Norway to record driver behavior as a function of roadway lighting. One interesting finding was that the percentage of older drivers and female drivers increased after the introduction of roadway lighting. Thus, a secondary benefit of roadway lighting (beyond its capability to reduce crashes) is increased mobility and access to goods and services for older drivers. D. Design Element: Traffic Control Devices for Restricted or Prohibited Movements on Freeways, Expressways, and Ramps Table 34. Cross-references of related entries for traffic control devices for restricted or prohibited movements on freeways, expressways, and ramps.
It has been reported that out of 100 wrong-way crashes, 62.7 result in an injury or fatality, versus 44.2 out of 100 for all freeway or expressway crashes (Tamburri and Theobald, 1965). These data highlight the fact that wrong-way crashes are more severe than most other types. The most frequent origin of wrong-way incidents, as reported by these authors, was entering the freeway via an off-ramp. Results of more recent investigations of the wrong-way problem in California indicate that fatal wrong-way crashes as a percentage of all fatal crashes on freeways have decreased substantially in the last 20 years (Copelan, 1989). The actual number of wrong-way fatal crashes was the same in 1987 as it was in 1963 (about 35 per year), despite the fact that freeway travel has increased fivefold; the reduction appears to be related to the countermeasures employed by California Department of Transportation over the intervening years, including the implementation of guide and wrong-way signs and pavement markings providing better visual cues. Copelan (1989), while noting that half of the wrong-way driving on freeways was from deliberate, illegal U-turns, reported that additional improvements could still significantly reduce wrong-way crashes. In their study of highway information systems, Woods, Rowan, and Johnson (1970) found that motorists frequently experience difficulty in locating entrance ramps to freeways, and drivers were often confused when there were several side roadways intersecting in close proximity to the interchange area. These researchers suggested that more efficient use could be made of "positive" signing techniques in guiding motorists to the freeway entrance ramps and discouraging drivers from possible wrong-way maneuvers. Early studies found that the rate of wrong-way driving based on vehicle-miles of travel increased with driver age (Tamburri and Theobald, 1965). In their analysis of 1,214 wrong-way driving incidents which occurred over two 9-month periods on California highways, they found a moderate increase in incidents for drivers ages 30-39 and those ages 40-49. Over age 60, the incidents rose rapidly; and over age 70, incidents occurred at rates approximately 10 times higher than for drivers ages 16-29. Lew (1971) reported on an analysis of 168 wrong-way crashes by civilians on California freeways in which the age of the wrong-way driver was recorded. While certain age groups (i.e., 30-39, 50-59, and 60-69) were represented to an extent corresponding closely to their proportion of the driving population, other groups such as those ages 16-19, 40-49, and 70-79 deviated markedly from expectation. Drivers ages 16-19 experienced approximately one-half of the wrong-way crashes expected for their age group; drivers ages 40-49 experienced three-quarters of the rate expected; and drivers ages 70-79 experienced over twice the number of freeway wrong-way crashes than would be expected. Age-related diminished capabilities contributing to wrong-way movements include the cognitive capabilities of selective attention and divided attention, and the sensory/perceptual capabilities of visual acuity and contrast sensitivity. Selective attention refers to the ability to identify and allocate attention to the most relevant targets in the driving scenario on an instant-to-instant basis, while divided attention refers to the ability to perform multiple tasks simultaneously. Individuals less capable of switching attention, or who switch too slowly, may increase their chances of choosing the wrong response or choosing the correct response too slowly. Treat, Tumbas, McDonald, Shinar, Hume, Mayer, Stansifer, and Castellan (1977) reported that 41 percent of crashes in which older adults were involved were caused by a failure to recognize hazards and problems, and that 18 to 23 percent of their crashes were due to problems with visual search. The selective attention literature generally suggests that for adults of all ages, but particularly for older drivers, the most relevant information must be signaled in a dramatic manner to ensure that it receives a high priority for processing in situations where there is a great deal of complexity at the level of information to be processed. Older drivers' use of signs designed to control wrong-way movements is affected by their visual performance capabilities. Letter acuity declines during adulthood (Pitts, 1982) and older adults' loss in acuity is accentuated under conditions of low contrast, low luminance, and high visual complexity. A field investigation of the effect of driver's age on nighttime legibility of highway signs indicated that older subjects perform substantially worse than younger subjects on a nighttime legibility task using a wide range of sign materials (Sivak, Olson, and Pastalan, 1981). Aside from difficulties in the use of signs, problems for older drivers at interchanges most likely to result from (age-related) deficits in spatial vision relate to the timely detection and recognition of pavement markings and delineation. Data from a study by Blackwell and Blackwell (1971) show that between age 20 and age 70, aging directly reduces contrast sensitivity by a factor of about 3.0. Mace (1988) stated that age differences in glare sensitivity and restricted peripheral vision coupled with the process of selective attention may cause higher conspicuity thresholds for older drivers. Overall, these deficits point to the need for more effective and more conspicuous signing and delineation. Violations of driver expectancy, use of alcohol, and reductions in the ability to integrate information from multiple sources to make navigation decisions while concurrently controlling the vehicle may all result in driver confusion at critical decision points, resulting in wrong-way maneuvers. Tamburri and Theobald (1965) found that many older drivers and drinking drivers did not know where their wrong-way movement began (i.e., they could identify neither where the decision point was nor the location of the wrong-way maneuver). Vaswani (1974) identified specific sources of wrong-way movements where alcohol was believed not to be a factor. In this study, exit ramps on partial interchanges generated wrong-way maneuvers because, unlike the ramps on full interchanges that converge with right-hand traffic, the ramps meet the crossroad at about 90 degrees to accommodate both left and right turns. Therefore the wrong-way entries consist of left turns off of the exit ramp into wrong-way traffic on a two-way divided highway, right turns from the divided highway into traffic exiting the ramp, and left turns from the crossroad into the exit ramp. At intersections with four-lane divided highways (divided arterial and primary highways), 45 percent of the wrong-way entries were at their intersections with exit ramps or secondary roads. The wrong-way entries were due to left-turning vehicles making an early left turn rather than turning around the nose of the median. Almost all these crashes involved sober drivers. Some ramp designs are more problematic than others. In Tamburri and Theobald's 1965 analysis of 400 wrong-way incidents where entry was made to the freeway via an off-ramp, the trumpet interchange category had the highest wrong-way entry rate, with 14.19 incidents per 100 ramp-years, and the full cloverleaf interchanges had the lowest wrong-way entry rate, with 2.00 incidents per 100 ramp-years. Parsonson and Marks (1979) also determined that several ramp types were particularly susceptible to wrong-way movements, as follows: half-diamond (3.9 per month), partial cloverleaf ("parclo") loop ramp (11.0 per month) and parclo AB loop ramp (6.7 per month). The parclo loop ramp and the parclo AB loop ramp share the same problem, which is an entrance and exit ramp in close proximity. The half-diamond is susceptible because it is an incomplete interchange, and drivers may make intentional wrong-way entries. A "problem" ramp has been defined as one that experiences more than five wrong-way movements per month; a corrected ramp has less than two per month (Rinde, 1978). Preventative measures for reducing the frequency and severity of wrong-way maneuvers include modifications in ramp and roadway geometry, and signing and pavement markings, and the use of warning and detection devices and vehicle arresting systems. Selected countermeasures are discussed below. Vaswani (1974) found that on almost all the interchanges on which wrong-way entries had been made into the exit ramp or from the exit ramp onto the crossroad, the corner of the exit ramp flared into the right pavement edge of the crossroad. He suggested that such a flare provides for a very easy but incorrect right-hand turn, and may help to induce a driver to make a wrong-way entry from the crossroad into the exit lane. A countermeasure consisting of a sharp right-hand junction would require a driver to reduce speed and almost come to a stop before maneuvering into the left lane, and would also reduce the chances that a driver exiting the ramp would turn left into wrong-way traffic on the crossroad. Site inspections showed that where the flare was not provided and the left lane of the exit ramp and the passage through the median were channelized, no wrong-way entry to or egress from the exit ramps was reported. Additionally, Vaswani (1974) reported that generous widths of an exit ramp with its junction with the crossroad make wrong-way entry or egress from the exit ramp easy. Narrow pavement widths will discourage such entries. A serious impediment to turning maneuvers by heavy vehicles could also result from this strategy, however. Vaswani (1974) also indicated that too large a set-back of the median noses from the exit ramp increases the width of the crossover and makes the intersection harder to "read." Vaswani suggests that if the width cannot be reduced, then pavement nose markings in the form of a striped median should be applied, for improved visibility of this design element. See also the discussion on page 100 of this Handbook for design element IE, about extending delineation treatments from a set-back median nose to the intersecting roadway. Campbell and Middlebrooks (1988), following the recommendation of Parsonson and Marks (1979) to widely separate the on- and off-ramps at partial cloverleaf interchanges, experimented with a design in which close exit and entrance ramps would be combined into one paved surface separated only by a double yellow line. Ten ramps in the Atlanta, Georgia, area were redesigned and evaluated using actual counts of wrong-way movements. Two of the ramps were monitored before and after they were converted to combined ramps. At the first location, the wrong-way rate per month before construction was 86.7; after combining the ramps, the rate fell to 0.3 per month. At the second location, the wrong-way rate was 88.6 per month. After the installation of four countermeasures (trailblazers, lowered DO NOT ENTER and WRONG WAY signs, 450-mm [18-in] stop bar, and 200-mm [8-in] yellow ceramic buttons in the centerline of the crossroad), the rate dropped to 2.0 per month. Once the ramps were combined at this second location, the wrong-way rate jumped to 30.0 per month, even when ceramic buttons, permanent signing, and pavement markings and a dotted channelizing line (i.e., pavement markings that lead turning vehicles onto the ramp) were employed. The mixed results of the Campbell and Middlebrooks study (1988) led to the evaluation of 15 additional combined ramps in the same research project, 12 of which were partial cloverleaf, with the balance consisting of median entrance/exit ramps (designed for future access by high-occupancy vehicles to the median lanes, but during the study period were open to all traffic). The study periods ranged from 30 to 102 days. The results clearly indicated that the concept of combined exit and entrance ramps can work when signing and markings conform to MUTCD specifications. It was recommended that 200-mm (8-in) yellow ceramic buttons be installed along the cross street centerline if all other countermeasures do not work. With regard to signing, Woods et al. (1970) indicated that positive signing which indicates the correct path or turning maneuver to the motorist rather than a restriction may help most to minimize driver confusion at freeway interchanges. Examples include route markers, trailblazers, and a FREEWAY ENTRANCE sign that positively designates an entrance to the freeway. Friebele, Messer, and Dudek (1971) noted that the use of oversized signs and reflectorization may be needed in locations where motorists are apt to disregard wrong-way warnings, and Copelan (1989) suggested that the larger, highly retroreflective signs may be helpful for confused or elderly drivers. Parsonson and Marks (1979) found that lowering the DO NOT ENTER and WRONG WAY signs to 450 mm (18 in) above the pavement to place them in the path of the headlight beams at night and placing trailblazer signs on the on-ramp were effective, inexpensive countermeasures. Individually, these two countermeasures reduced the wrong-way incidence to about one-third to one-half of its original rate. This is consistent with California's Standard Sign Package, which specifies that the DO NOT ENTER and FREEWAY ENTRANCE packages be mounted with the bottom of the lower sign 600 mm (24 in) above the edge of the pavement. It also specifies that ONE WAY arrows be mounted 450 mm (18 in) above the pavement. The Virginia Department of Highways and Transportation (1981b) noted concern regarding the 450 mm (18 in) mounting height of the ONE WAY signs, however, stating that the signs may become obscured by vegetation and by guardrails (when the sign is mounted behind a guardrail). Thus, mounting height was revised for this State to 900 mm (36 in), to alleviate these concerns. An additional concern with lowering the mounting height of these signs is the increased potential to impact a passenger vehicle windshield if struck by a motorist entering or exiting the freeway who strays off of the ramp and crashes into the sign support. However, wrong-way entries onto high-speed facilities can cause very serious head-on collisions in locations where there is a high incidence of wrong-way entry or a high likelihood of wrong-way entry due to geometrics. Since windshield penetration is less likely to occur at a location near the ramp terminus than at other locations because of lower travel speeds of drivers traveling in the correct direction along the ramp (who are slowing down for a stop or a signalized turn) and drivers making the wrong-way movement (who are accelerating from a turn), the anticipated benefit of increased sign conspicuity and prevention of wrong-way freeway entries is judged to significantly outweigh the risk of sign penetration. California uses the DO NOT ENTER and WRONG WAY signs together on a single signpost, with the WRONG WAY sign mounted directly beneath the DO NOT ENTER sign (the Do Not Enter Package). This sign package is placed on both sides of the ramp. The California Standard specifies that large FREEWAY ENTRANCE signs (1,200 mm x 750 mm [48 in x 30 in]) be placed on on-ramps, but the location of the sign package (FREEWAY ENTRANCE sign, plus route shield, cardinal direction sign, and down diagonal arrows) should not be controlled by the use of the larger signs; smaller signs (900 mm x 525 mm [36 in x 21 in]) may be used for proper placement, if necessary. For off-ramp signing, the Standard specifies the use of at least one Do Not Enter package (DO NOT ENTER and WRONG WAY signs), to be placed to fall within the area covered by the car's headlights and visible to the driver from the decision point on each likely approach; three or four packages may be required if the off-ramp is split by a traffic island. In addition, ONE WAY arrows should be placed as close to the crossing street as possible. The MUTCD standard sizes for the DO NOT ENTER and WRONG WAY signs are 750 mm x 750 mm (30 in x 30 in) and 900 mm x 600 mm (36 in x 24 in), respectively. California uses sizes of 900 mm x 900 mm; 1,200 mm x 1,200 mm; and 1,800 mm x 1,800 mm (36 in x 36 in; 48 in x 48 in; and 72 in x 72 in) for the DO NOT ENTER sign and 900 mm x 525 mm and 1,800 mm x 525 mm (36 in x 21 in and 72 in x 21 in) for the WRONG WAY sign. As they are retrofitted and newly installed, the Do Not Enter sign packages in California have high intensity sheeting (Copelan, 1989). Increases in conspicuity distance have been reported in the literature on fluorescent signing. As stated earlier in Chapter I for Design Element L, Burns and Pavelka (1995) found that signs with fluorescent red sheeting were detected by 90 percent of the participants in a field study conducted at dusk. Only 23 percent of the subjects were able to detect the standard red signs, under the same lighting conditions. To improve the daytime conspicuity of DO NOT ENTER and WRONG WAY signs, as well as conspicuity of these signs under low luminance conditions (dawn and dusk), fluorescent red sheeting is recommended. In addition, use of retroreflective sheeting that provides for high brightness at the wide observation angles typical of the sign placements and distances at which these signs are viewed (e.g., 1.0+ degrees), as well as lowering the sign heights for these signs will enhance their nighttime conspicuity under lowbeam headlight illumination. Turning to a consideration of pavement markings, Tamburri (1969) found that a white pavement arrow placed at all off-ramps pointing in the direction of the right-way movement can be effective in reducing the number of wrong-way maneuvers. However, Parsonson and Marks (1979) found that at a parclo AB loop off-ramp that has its crossroad terminal adjacent to the on-ramp, standard pavement arrows, lowered DO NOT ENTER and WRONG WAY signs, trailblazer signs, and a 600-mm (24-in) wide stop bar were not sufficient, as the ramp still showed 22.3 wrong-way movements per month. Large pavement arrows (7.3-m [24-ft long]) and yellow ceramic buttons (with a diameter of 200 mm [8 in]) to form a median divider on the crossroad were required, in addition. It was specified that the ceramic buttons should touch each other to form a continuous, unbroken barrier, and should extend far enough toward the interchange structure (the freeway) to prevent a wrong-way driver from avoiding the buttons by turning early. The length required is typically 30.5 m (100 ft). The addition of the ceramic buttons reduced wrong-way maneuvers from a rate of 88.6 per month to a rate of 2.0 per month. Campbell and Middlebrooks (1988) also found that installing yellow ceramic buttons to the extension of the centerline of the crossroad to aid in channelizing left-turning traffic entering the freeway, in combination with countermeasures employed by the Georgia Department of Transportation as standard practice--trailblazer sign, 450-mm (18-in) wide stop line at the end of the off-ramp, 5.5-m (18-ft) long arrow pavement marking, and lowered WRONG WAY and DO NOT ENTER signs--reduced wrong-way maneuvers. It was also recommended in the Parsonson and Marks (1979) study that the two-piece, 7.3-m (24-ft) long arrow pavement marking (part of the California standard) be adopted. This use of the wrong-way arrow is described in MUTCD section 3B.19 and shown in MUTCD figures 3B-22 and 3B-23. The control of wrong-way movements on freeways and expressways, a related problem, may be accomplished through the use of lane control signals (LCS). The MUTCD (section 4J.0) defines lane control signals as "special overhead signals that permit or prohibit the use of specific lanes of a street or highway or that indicate the impending prohibition of their use." The meanings of LCS indications (steady downward green arrow, steady yellow X, and steady red X) are defined in MUTCD section 4J.02 LCS's provide real-time information to motorists about which downstream freeway lanes are open (green downward arrow), which are closed (red X) and which lanes are about to be closed (yellow X) either because of an incident downstream or because the lane is a reversible lane. Drivers should vacate lanes over which an LCS displays a yellow X, and they should not enter lanes designated by a red X. Safe and effective responses to these indications by older drivers hinge upon the same visual target detection and recognition processes which have been documented elsewhere in this Handbook to decline systematically with advancing age. Ullman, Parma, Peoples, Trout, and Tallamraju (1996) conducted legibility studies of commercially available lane control symbols (LCS's) being used in freeway traffic management systems throughout Texas. Subjects included drivers ages 16-44 and drivers age 65 and older. In the first study, subjects were seated in the driver's seat of a test vehicle that was positioned 460 m from an overhead sign structure that displayed three fiber optic LCS's mounted side by side.
They were shown one symbol presented on one LCS for a 1.5-s duration, and were asked to describe the symbol and the color. If a subject could not correctly identify the color and symbol, he or she moved closer to the LCS, until the color and symbol could be correctly identified. The study was conducted during the day. The symbols on all three LCS heads measured 356 mm (14 in) in height, but the arrangement of the pixels varied for the three sign manufacturers. Signal 1 utilized a single-stroke arrangement of pixels, arranged using 13-mm (0-5 in) lenses spaced 25 mm(1 in) apart. Signal 2 utilized a double-stroke arrangement of pixels, arranged using 15-mm (0.6-in) lenses spaced 38 mm(1.5 in) apart. Signal 3, besides displaying the three standard MUTCD symbols, was also able to display a yellow arrow pointing downward, or pointing to the left or right. Signal 3 utilized a double-stroke arrangement of pixels for the green arrow, the red X, and the yellow X, but utilized a single-stroke arrangement for the downward and diagonal yellow arrows. The lenses measured 4 mm (0.15 in), and spacing was 18 mm (0.7 in). Figure 21 presents the pixel layout of the three LCS heads used in this research. The legibility distances by symbol type are presented in table 35, by signal type and driver age. Results indicate that median legibility distances for the older drivers viewing the red X, yellow X, and green arrow were 91 to 198 m (298 to 649 ft) shorter than those for the younger drivers. The biggest discrepancies between younger and older drivers were for the red X on Signal 2 and the green down arrow on Signal 1. Signal 3 produced the most uniform legibility distances for all symbols. The authors state that comments from the older drivers indicated that the double-stroke pixel arrangement combined with the larger pixel lenses on Signal 2 caused irradiation effects, resulting in older drivers' inability to identify the shape of the red "glow" until they were 50 percent closer to the signal than younger drivers. The actual cause of the poor legibility of the green down arrow on Signal 1 for older drivers was unknown, but hypothesized by the researchers to be a result of being slightly more "blue" than the green down arrows on the other two signals. On the other hand, although the yellow downward and diagonal arrows displayed on Signal 3 are not standard MUTCD symbols for LCS's, they showed the highest legibility distance of all symbols for the older drivers, and yielded a legibility distance that was 30 m shorter than younger drivers' legibility distance. These symbols were created with a single line of closely spaced small pixels. The legibility distance was greater than that of the double-stroke yellow X presented on the same display. Results of a preliminary field study conducted in this same project indicated that the yellow X and yellow down/diagonal arrows were interchangeable, resulting in similar proportions of drivers exiting a closed lane. The authors also studied the effects of age, dirt accumulation, and regular maintenance on LCS legibility. The combined effect of age and dirt accumulation significantly reduced the visibility of the green arrow and red X for both younger and older driver groups. The signal had been installed for 6 years, and had an 18-month accumulation of dirt, since its last cleaning. Subjects viewed the symbols before and after cleaning and replacement of each of the 50-watt halogen light bulbs in the signal face. The legibility distances before maintenance and cleaning ranged from 183 to 335 m (600 to 1,099 ft) for drivers under age 45, and 107 to 274 m (351 to 899 ft) for drivers age 65 and older. After maintenance and cleaning, visibility distances increased significantly for both driver groups. Median visibility distances for the younger drivers ranged from 259 m to 381 m (850 to 1,250 ft), and for the older drivers ranged from 213 to 335 m (699 to 1,099 ft). There appears to be permanent loss of visibility of the red and green symbols over time; after maintenance, the legibility distances for both driver groups were two-thirds to three-fourths of those shown for the new LCS. The effect of dirt and signal age did not affect legibility distance of the yellow X. Table
35. Median legibility distance (meters) of lane control signals, as a function
of driver age, LCS type, and LCS symbol.
1 m = 3.28 ft
FHWA-RD-01-103 |
|||||||||||||||||||||||||||||||||||||||||||||||||||||||||||||||||||||||||||||||||||||||||||||||||||||||||||||||||||||||||||||||||||||||||