U.S. Department of Transportation
Federal Highway Administration
1200 New Jersey Avenue, SE
Washington, DC 20590
202-366-4000
Federal Highway Administration Research and Technology
Coordinating, Developing, and Delivering Highway Transportation Innovations
 |
| This report is an archived publication and may contain dated technical, contact, and link information |
|
Publication Number: FHWA-HRT-04-138
Date: December 2005 |
|||||||||||||||||||||||||||||||||||||||||||||||||||||||||||||||||||||||||||||||||||||||||||||||||||||||||||||||||||||||||||||||||||||||||||||||||||||||||||||||||||||||||||
Enhanced Night Visibility Series, Volume VII: Phase II—Study 5: Evaluation of Discomfort Glare During Nighttime Driving in Clear WeatherPDF Version (574 KB)
PDF files can be viewed with the Acrobat® Reader® CHAPTER 4—DISCUSSION AND CONCLUSIONSAs mentioned in the Methods section (chapter 2), the aiming protocol used for this study resulted in a deviation in the maximum intensity location from where it typically is for some headlamp types. Details about this deviation are discussed in ENV Volume XVII, Characterization of Experimental Vision Enhancement Systems. The protocol used in this study would be expected to result in higher discomfort glare for the HLB, HOH, and HHB than would be found if these headlamps were aligned more typically. To determine the difference in glare ratings between the two aiming methods, an additional study was conducted comparing discomfort glares associated with an optical aimer method and with the aiming method used in this study (i.e., ENV method). The additional study used the HLB headlamps because they were included in each of the Phase II and Phase III studies. The additional study was conducted using the same experimental methods as the original discomfort glare study. Two SUVs of the same make, model, and year were used. One SUV had its HLB headlamps aimed using the ENV aiming protocol. The headlamps on the second SUV were aimed using an optical aiming device that aimed the headlamps lower and more to the right. This is considered a more typical alignment than the ENV aiming protocol provided. Participants included 12 younger and 12 older gender-matched participants who were selected using the same participant selection criteria as the original discomfort glare study. Exposure to the different aiming methods was counterbalanced to eliminate order effects. Participants evaluated the glare by providing deBoer ratings as was done previously. A paired, two-sample t-test indicated no statistical difference between the two aiming methods for either the far discomfort rating (p = 0.46) or the near discomfort rating (p = 0.35). The average far rating was 5.0 (“Just acceptable”) for both aiming methods with a standard deviation of 2.1 for the optical aimer method and 1.9 for the ENV method. A frequency count indicated that 11 participants rated the ENV method as having more discomfort glare, nine participants rated the optical aimer method as having more discomfort glare, and four participants rated both methods the same. The average near rating was also similar between the two aiming methods with a mean of 3.6 for the optical aimer method and 3.4 for the ENV method (both just above “Disturbing”). The standard deviation was 2.1 for both aiming methods. A frequency count indicated that 10 participants rated the ENV method as having more discomfort glare, 12 participants rated the optical aimer method as having more discomfort glare, and 2 participants rated both methods the same. This additional study shows no indication that the ENV aiming method made any difference in the results for the HLB headlamps despite the likelihood that the ENV method directed more illumination toward the oncoming participant’s eyes than the optical aimer method. Even so, it is important to consider the results presented in this discomfort glare study in the context and conditions tested; if different halogen headlamps or aiming methods had been used, different results might have been obtained. Finally, although not tested in the additional study, with respect to glare, the headlamp system that was most likely to be affected by the ENV aiming method is the halogen high beam (HHB). Recall that this headlamp was in the same housing as the HOH; therefore, when the HOH was adjusted higher and more toward the center of the road, the HHB was directed higher still and into the oncoming driver’s lane. This aiming method likely led to an overestimate of discomfort glare in the near rating and possibly an underestimate of discomfort glare in the far rating. The amount of vertical illumination measured at the driver’s eye supports this premise. Table 12 in appendix H indicates that the illumination for the HHB was higher than expected during the near rating. The illumination was similar to the other headlamps in the far rating, where the HHB would be expected to have a higher illumination. It is important to take these expectations into account when reviewing the following results. VES CONFIGURATIONThe results of the discomfort glare evaluation are consistent with existing knowledge and previous research on the subject. The amount of light directed toward the observer’s eye by the opposing headlamps seems to be the overriding factor contributing to the reported discomfort sensation. The effects of both age and the spectral content of the visible lights are much smaller and less consistent. In general, the addition of the UV–A headlamps, which were used along with a base headlamp (HLB or HID) for the three UV–A and five UV–A configurations, do not add substantially to the discomfort caused by the base headlamp alone; however, the hybrid UV–A headlamp, which was used along with the HID and HLB headlamps for the hybrid configurations, does add to the discomfort caused by the base headlamp alone. Both of these results are expected because the UV–A headlamps have very little visible light, whereas the hybrid UV–A headlamp has a noticeable amount of light. The far discomfort ratings indicate that there are not many significant differences between the different VESs when the separation distances are between 396.2 and 304.8 m (1,300 and 1,000 ft); however, there are significant differences at the near separation distances between 137.16 and 45.72 m (450 and 150 ft). The HID used in this study alone and in combination with the UV–A configurations cause significantly less discomfort than any of the halogen configurations, excluding the HLB–LP. It is surprising that the three UV–A + HID configuration was perceived as causing less discomfort than the HID alone. Not surprisingly, the vertical illumination at the participant’s eye level was nearly identical between the two conditions (table 12). The five UV–A + HID was also rated as causing less discomfort than the HID alone, although the difference was not significant. On the other hand, the three UV–A + HLB and five UV–A + HLB both were rated as causing more discomfort than the HLB alone, although the difference was not significant. The reason behind these differences in perceived discomfort is unknown. In laboratory settings, the spectral power distribution of HID headlamps, which results in a blue-white color, has been shown to cause more discomfort than the yellow light of traditional tungsten-halogen headlamps.(24) Although the goal of this study was not to retest that hypothesis, it can be inferred from the results that it may also be applicable in a realistic driving environment. Over the near segment of road, which stretched from 137.2 to 45.7 m (450 to 150 ft) from the opposing headlamps, the HLB–LP provided an average vertical illumination at the participant’s eye of 2.26 lx (0.21 foot-candles (fc)) with a maximum of 2.9 lx (0.27 fc). The HID provided an average vertical illumination of only 0.33 lx (0.03 fc) with a maximum of 0.75 lx (0.07 fc); however, the discomfort ratings for these two VESs are not significantly different. Although this result may be attributed partly to the difference in spectral power distribution, with the discomfort from the blue-white color of the HID replacing the discomfort lost by its low illumination, it must be noted that the low profile of the HLB–LP slightly increased the glare angle; therefore, no firm conclusion about the effect of spectral power distribution alone in a realistic driving environment should be drawn from this study. The illuminance measurements show that the HID used for this study has a beam pattern that directs a minimal amount of light onto the opposing lane. If this type of pattern can offset the discomforting effects caused by the perceived brightness of the blue-white color while still providing an acceptable visibility distance, then HID lamps in vehicular applications may become more widely accepted by the public. It should be noted that, in previous research using these VESs under similar weather conditions, drivers could see objects farther away with the baseline halogen lights than with the baseline HID lights (ENV Volume III). An observable trend (figure 7) shows that younger participants reported more discomfort than the older participants at lower reported glare levels, with the pattern reversing at higher reported glare levels. Specifically, the younger drivers reported significantly more discomfort for the HID, three UV–A + HID, and hybrid UV–A + HLB configurations. This result may indicate that the younger participants, because of the increased amount of light that strikes their retinas relative to the middle and older age groups, are somehow more sensitive to these conditions. All three of these configurations have a larger blue spectral component than most of the other configurations. COMPARISON OF RESULTS TO SCHMIDT-CLAUSEN AND BINDELS EQUATIONSchmidt-Clausen and Bindels developed an equation to predict the mean deBoer discomfort rating from the adaptation luminance, the illumination directed toward the observer’s eye, and the glare angle.(7) Olson and Sivak found that in real driving scenarios, the average discomfort reported was one to two scale intervals more comfortable than predicted by the equation.(9) Therefore, it was logical to determine how well the Schmidt-Clausen and Bindels equation predicted the mean discomfort ratings obtained for each VES tested in this study. The first step was to calculate two predicted deBoer ratings for each VES: a predicted far discomfort rating and a predicted near discomfort rating. To do this, a single value for the vertical illumination and glare angle was needed for each rating; however, because the participants rated the discomfort glare while traveling over a 91.44-m (300-ft) section of road, these two parameters were changing constantly. To reach a single predicted value, three different calculations attempted to model how participants estimated discomfort glare. Each calculation assumed that participants based their rating on one of the following: (1) the average level of vertical illumination to which he or she was exposed over the 91.4-m (300 ft) segment; (2) the maximum level of vertical illumination to which he or she was exposed over the 91.4-m (300-ft) segment; or (3) the very last level of vertical illumination to which he or she was exposed (i.e., he or she would base the rating on whatever he or she felt at the moment when the experimenter asked for the rating). For situation 1, researchers used the average glare angle over each 91.4-m (300-ft) segment for the calculation (wavg). For situation 2, the glare angle at the distance where the maximum illumination occurred (as recorded in the vertical illumination measurements) was used (wmax). For the near discomfort rating, the maximum illumination always corresponded to the last point on the 91.4-m (300-ft) segment (table 9). For the far discomfort rating, the maximum illumination often occurred before the last point was reached (table 10). For situation 3, researchers used the glare angle at the distance where the experimenter asked for the rating for the calculation (wlast). The second step was to compare the predicted deBoer ratings to the ratings obtained during the study (D). Table 9 and table 10 show predicted and obtained deBoer ratings for the near ratings and far ratings, respectively.
It appears that the observation made by Olson and Sivak, in which the average discomfort reported in a realistic driving environment was one to two scale intervals more comfortable than predicted by the Schmidt-Clausen and Bindels equation, also applied to these experimental conditions.(9) A regression analysis was then performed to determine if a correlation existed between the predicted and actual values. If a strong correlation did exist, it would suggest that the average value on the deBoer scale could be predicted reasonably in a realistic driving environment from the Schmidt-Clausen and Bindels equation by using vertical illumination, adaptation luminance, and glare angle as parameters; however, the regression coefficients in this equation would need to be reevaluated to account for the lower discomfort ratings observed in this experiment. Linear regression was done using the average discomfort rating (D) as the dependent variable and either wavg, wmax, or wlast as the independent variable. Results are summarized in table 11.
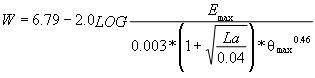
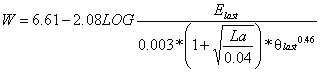
Based on the correlation coefficients in table 11, it appears likely that a participant based his or her ratings either on the maximum amount of illumination or on the very last level of illumination experienced before giving the rating. It can be concluded that the average deBoer rating in a realistic driving environment can be reasonably predicted using one of the variations of the Schmidt-Clausen and Bindels equation calculated by the linear regressions to the data. The variations are shown in figure 8 and figure 9. Figure 8. Equation. Variation of Schmidt-Clausen and Bindels equation based on maximum illumination experienced.
In the equation in figure 8, W = mean value on deBoer’s scale, Emax = maximum level of illumination directed toward the observer’s eye from the headlamps (lx), Figure 9. Equation. Variation of Schmidt-Clausen and Bindels equation based on last illumination experienced. In the equation in figure 9, W = mean value on deBoer’s scale, Elast = last level of illumination directed toward the observer’s eye from the headlamps (lx), These equations can be used to provide insight into the ratings that could be given by participants in a real driving experiment. During the design stage of beam development, headlamps could be evaluated to help assess the effect of the beam pattern on the perception of opposing drivers.
|
|||||||||||||||||||||||||||||||||||||||||||||||||||||||||||||||||||||||||||||||||||||||||||||||||||||||||||||||||||||||||||||||||||||||||||||||||||||||||||||||||||||||||||