U.S. Department of Transportation
Federal Highway Administration
1200 New Jersey Avenue, SE
Washington, DC 20590
202-366-4000
Federal Highway Administration Research and Technology
Coordinating, Developing, and Delivering Highway Transportation Innovations
 |
| This report is an archived publication and may contain dated technical, contact, and link information |
|
Publication Number: FHWA-HRT-04-143
Date: December 2005 |
||||||||||||||||||||||||||||||||||||||||||||||||||||||||||||||||||||||||||||||||||||||||||||||||||||||||||||||||||||||||||||||||||||||||||||||||||||||||||||||||||||||||||||||||||||||||||||||||||
Enhanced Night Visibility Series, Volume XII: Overview of Phase II and Development of Phase III Experimental PlanPDF Version (631 KB)
PDF files can be viewed with the Acrobat® Reader® CHAPTER 2—PHASE II STUDIESPhase II of the ENV project included six studies. Four studies evaluated 12 different vision enhancement systems (VESs) on their ability to assist drivers in detecting and recognizing objects and pedestrians at night in clear and inclement weather. The other two studies evaluated 11 of these VESs in the areas of pavement marking detection and discomfort glare. This chapter summarizes the independent variables, dependent variables, and key results of the six studies conducted in Phase II. The following nine ENV reports provide the full details of all Phase II efforts:
Volume III through Volume VIII provide the detailed methodologies, protocols, and results for each of the six studies. Volume IX describes the methodology and results of a subsequent analysis that characterized the luminance of the objects with each VES used in the detection and recognition testing except for the infrared thermal imaging system (IR–TIS). Volume X describes the visual performance simulation software developed to evaluate the visibility of objects and traffic control devices with various headlamps. Volume XI describes the cost-benefit analysis that evaluated the performance of the UV–A headlamps. In addition, Volume XVII—Characterization of Experimental Vision Enhancement Systems (FHWA-HRT-04-148)—details the characterization of the VESs used in this phase. VISUAL PERFORMANCE STUDIESIndependent VariablesVision Enhancement SystemsThe term “VES” encompasses the combination of headlamps, supplemental lighting, and/or imaging system used on each vehicle. The VESs for the conditions of clear weather (ENV Volume III), rain (ENV Volume IV), snow (ENV Volume V), and fog (ENV Volume VI) included the following technologies:
As a VES, UV–A is not designed to function without visible light, and it should be thought of as a supplemental visibility system. This research used the following three UV–A configurations: two hybrid UV–A lamps (hybrid UV–A), so called because of their significant visible light component; three UV–A lamps (three UV–A) that had a minimal visible light component; and five of these lamps (five UV–A). Each of the UV–A configurations was paired with two HLB baseline headlamps and, separately, two HID baseline headlamps. Table 1 presents these six UV–A configurations as well as the other six VES configurations used throughout the visual performance studies. An “X” in this table indicates that the VES configuration was used in the corresponding study. The clear and rain studies included all 12 VESs. The fog and snow studies reduced the VESs to the subset with the most potential to perform well in inclement weather.
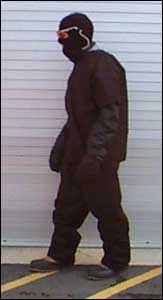
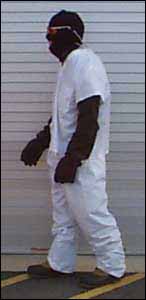
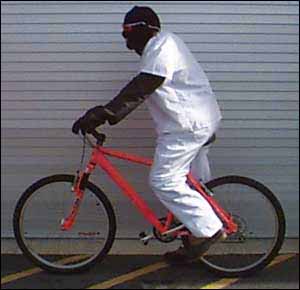
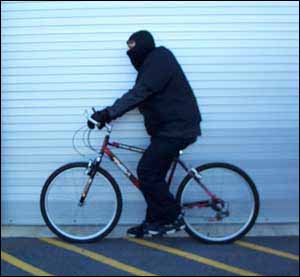
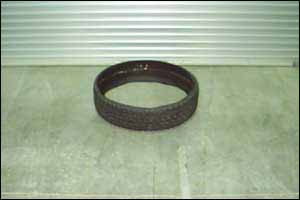
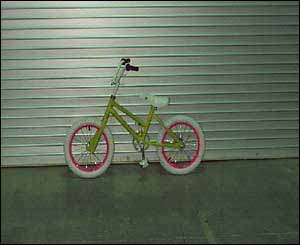
Most of the configurations were installed on high-profile vehicles, including sport utility vehicles (SUVs) and pickup trucks. The IR–TIS was part of an original equipment manufacturer (OEM) package on a sedan that used halogen headlamps. This was the only sedan included in the study, so the headlamps were defined as halogen low beam, low profile (HLB–LP). These HLB–LP headlamps were tested alone and in conjunction with the IR–TIS. The prototype HOH lamp, which was designed to produce more visible light, was installed in the same type of housing as the HLB–LP but placed on a pickup rather than a sedan. The HHB lamp was in the same housing as the HOH lamp but in the high-beam lamp position. The headlamps used for the HLB, HID, HOH, HHB, and UV–A configurations were located on external light bars. To change from one configuration to another, researchers moved the HLB and HID headlamps between vehicles. Each light assembly movement necessitated a re-aiming process, which took place before starting the experimental session each night. During the photometric characterization of the headlamps, it was discovered that the position of the maximum intensity location of the HLB, HOH, and HHB configurations was aimed higher and more toward the left than typically specified. This aiming deviation likely increased detection and recognition distances for the HLB and HOH configurations and likely decreased them for the HHB configuration. Details about the aiming procedure and the maximum intensity location are discussed in ENV Volume XVII. AgeEach of the studies except for the snow study used three age groups: younger participants (18 to 25 years), middle-aged participants (40 to 50 years), and older participants (65 years or older). For the snow condition, the older group was excluded for safety reasons. The participants were required to get in and out of the experimental vehicles multiples times throughout the night on a potentially icy road surface. Therefore, the risk for a slip and fall, although unlikely, was deemed too great to allow older drivers to participate. ObjectsTable 2 and figure 1 through figure 6 show the objects used in the clear, rain, snow, and fog studies. ENV Volume IX provides detailed characterization of each of these objects. Parallel pedestrians continuously walked back and forth along a portion of the right side of the road on the shoulder side of the edgeline. The pedestrian walked 10 paces forward followed by 10 paces backward, always facing the oncoming vehicle for safety reasons. Perpendicular pedestrians continuously walked from the right edgeline of the road to the centerline and back. Cyclists continuously rode from one edgeline to the other. The static pedestrian, tire tread, and child’s bicycle were on the right edgeline. The clear study used all the objects. In the snow study, the cyclist was removed for the safety of the cyclist and because it is unlikely that a cyclist would be present in an actual snowstorm. The tire tread and the child’s bicycle were also removed because they were rapidly covered with snow. In the fog study, variable wind and temperature conditions made it challenging to maintain consistent fog density across runs. To more accurately assess object visibility independent of fluctuations in fog density, the study used only the white-clothed perpendicular pedestrian, but it used this object multiple times to provide a better estimate of detection distance.
Dependent VariablesThe primary performance variables used in the clear, rain, snow, and fog studies were detection and recognition distance. Detection was explained to participants as follows: “Detection is when you can just tell that something is on the road in front of you. You cannot tell what the object is, but you know something is there.” Recognition was explained as follows: “Recognition is when you not only know something is there, but you also know what it is.” During training and practice, the participants pressed a button on a hand-held wand when they could detect an object on the road. The participants performed a second button press when they could recognize the object. The in-vehicle experimenter pressed another button the moment the participant drove past the object. Detection and recognition distances were calculated from distance data collected at these three points. The dependent variables also included subjective ratings. Participants were asked to evaluate a series of seven statements for each VES using a seven-point Likert-type scale. The two anchor points of the scale were “1” (indicating “Strongly Agree”) and “7” (indicating “Strongly Disagree”). The statements addressed each participant’s perception of improved vision, safety, and comfort after experiencing a particular VES. Participants were asked to compare each VES with their own vehicle’s regular headlights. Following is a list of the statements on the questionnaire:
Experimental DesignEach of the visual performance studies used a mixed-factor experimental design. VES and object were both within-subject variables, and age was the between-subjects variable for each of the studies. Key FindingsThe following are the key findings in the clear, rain, snow, and fog object detection and recognition studies. ENV Volumes III, IV, V, and VI, respectively, contain the full findings for these studies. Supplemental UV–AIn general, the supplemental UV–A did not provide sufficient improvement over the baseline HID and HLB headlamps to justify additional research in this area. As expected, the UV–A produced longer detection distances for the scenarios with the white-clothed pedestrian in the clear, rain, fog, and snow conditions relative to the baseline headlamps alone. For comparison purposes, the detection results for the baseline headlamps with five UV–A—the configurations with the most supplemental UV–A—and for the perpendicular pedestrian dressed in white—the object most likely to have its visibility enhanced
by UV–A—are shown in table 3. Note that these combinations had the greatest potential to show a benefit of UV–A. In inclement weather, the five UV–A configuration allowed an approximately 10 m (32 ft) greater detection distance than the HLB baseline headlamps. In the clear condition, the five UV–A showed the greatest improvement, with a 25 m (83-ft) greater detection distance than HLB alone and an approximately 40 m (132 ft) greater detection distance than HID alone. In rain, the five UV–A detection distance improvement was approximately 18 m (60 ft) greater than HID alone; however, when the results of five UV–A are compared for all the objects It is important to recognize that the five UV–A headlamp configuration was included to provide a proof-of-concept by evaluating the maximum potential benefits of a UV–A supplemental headlamp system. As described in detail in ENV Volume XVII, the configuration used five large, high-wattage lamps designed for use on snowplows in Norway. Thus, barring significant advances in technology (such as UV–A light-emitting diodes), providing this much UV–A light is not practical for installation on automobiles at this time for reasons of cost, power consumption, and size.
Supplemental Infrared SystemThe IR–TIS was included because of its ability to present the driver with images of the environment based on the temperature differential of objects. This approach has the potential to allow for very early detection of pedestrians, cyclists, animals (i.e., objects generating heat) or infrastructure objects that shed heat (e.g., guard rails, light posts) on the roadway. Table 5 compares mean detection distances with HLB–LP and IR–TIS (recall that these two VESs were always paired) for the perpendicular pedestrian dressed in white, the only object used in clear, rain, and fog conditions. The IR–TIS was not used during the snow condition because the camera became blocked by snow. Heavy rain negatively affected the image presented to the drivers from the IR–TIS in the rain condition. In the fog condition, IR–TIS provided the longest detection distances and was rated as the most helpful for detection. In the clear condition, IR–TIS was superior to all other VESs for pedestrian detection, especially for detection of low-contrast pedestrians.
Table 6 illustrates the mean detection distances for the perpendicular pedestrians dressed in white and in black clothes for IR–TIS and HLB–LP in the clear condition. The pedestrian dressed in white was detected more than 50 m (164 ft) farther when IR–TIS was available than with the headlamps alone. For the pedestrian dressed in black, detection occurred more than 100 m (328 ft) farther with the IR–TIS, potentially allowing a driver twice the time to avoid such a pedestrian than would be provided by headlamps alone. Because it is atypical for pedestrians to wear high-luminance or highly reflective clothing,(1) this type of technology has the potential to reduce pedestrian crashes and should be evaluated further.
AgeIn the clear condition, older drivers had shorter detection distances on average than the younger and middle-aged drivers, especially with low-contrast objects; the differences were smaller with the IR–TIS. However, in the rain and snow conditions, age made little difference; the precipitation reduced visibility levels so drastically that it effectively leveled the playing field for all ages. Surprisingly, the younger participants had shorter detection distances than the other participants in the fog condition. ObjectsIn the clear and rain conditions, clothing contrast, rather than object motion, appears to have been responsible for the differences observed between the different types of pedestrians and cyclists. Not surprisingly, pedestrians dressed in white were detected farther away than pedestrians dressed in black, regardless of the VES used. Subjective RatingsThe drivers’ subjective evaluations suggest that they thought HID helped them the most to detect and recognize the different objects. This finding conflicts with the objective data. For example, in the rain condition, although the HLB supplemented with UV–A allowed pedestrians and cyclists in white clothing to be detected farther away, the drivers’ subjective evaluation indicated that HID was more helpful in object detection. DISCOMFORT GLARE STUDYThe primary focus of the discomfort glare study (ENV Volume VII) was to determine the degree of driver discomfort caused by oncoming supplemental UV–A headlamps. The study included all VESs (table 1) except IR–TIS because glare is not an issue with IR technology. This study was conducted on the Smart Road using 60 participants split equally among 3 age groups: younger participants (18 to 25 years), middle-aged participants (40 to 50 years), and older participants (60 years or older). Participants drove toward a fixed glare source and rated it twice using the deBoer discomfort rating scale.(2) The first rating represented the discomfort the participant experienced at an approximate range of 396 to 305 m (1,300 to 1,000 ft) away from the opposing headlamps. The second rating reflected the discomfort felt in the approximate range of 137 to 46 m (450 to 150 ft). The results indicated that the amount of visible light (maximum illumination) directed toward the observer’s eye by the opposing headlamps was the overriding factor contributing to the reported discomfort sensation. The spectral distribution of the light did not appear to have an effect. The hybrid UV–A lamps appeared to add discomfort glare (recall that this lamp had a larger visible light component), but the other UV–A lamps did not. The HLB headlamps selected for this testing produced more discomfort glare than did the HID headlamps tested. This result may have been caused by the aiming strategy used for the HLB headlamps; however, a subsequent study could not confirm that the aiming strategy made a difference. Finally, modifications of the Schmidt-Clausen and Bindels equation were made to allow the maximum level or last experienced level of illuminance at the driver’s eye to be used in predicting ratings of discomfort glare.(3) This may provide headlamp designers with insight into discomfort glare of proposed headlamps early in the design process. PAVEMENT MARKINGSThe pavement marking study (ENV Volume VIII) focused on the visibility of three pavement marking materials: a liquid system, fluorescent thermoplastic, and fluorescent paint. The liquid system was chosen because it has approximately twice the retroreflectivity of conventional patterned tape markings. Fluorescent pigments were added to the other two pavement markings to evaluate the potential benefit of UV–A in these materials. The pavement markings were applied to three separate sections of the Smart Road with a blank section (i.e., no pavement marking) before and after each type of marking. As in the discomfort glare study, the pavement markings study used all the VESs (table 1) except for IR–TIS because that technology was not designed to facilitate pavement-marking visibility. Thirty participants, 10 from each of the 3 age groups (18 to 25 years, 40 to 50 years, and 60 years or older), completed the study. While driving, the participants indicated when they could first detect the beginning of a pavement marking section by pressing a hand-held pushbutton. They pressed the pushbutton a second time when they could detect the end of a pavement marking section. Each participant performed this detection activity for each marking type using each of the VESs. The two baseline VESs, HLB and HID, were compared both individually and in combination with three levels of UV–A to each other and three other headlamps (see table 1). The results indicated that all the VESs provided adequate minimal visibility distances for all of the pavement markings at the 40 km/h (25 mi/h) speed driven. It is likely that visibility would be adequate at much higher speeds, but additional research would be required to verify this. The supplemental UV–A did not improve detection distances for either the HID or the HLB headlamps. This effect likely was caused by the significant and rapid degradation of the fluorescent pigments in the pavement marking materials. Nothing in this study supported the additional cost of adding fluorescent material to pavement markings. In fact, no VES and pavement marking pair outperformed other pairs to the extent that a combination of VES and pavement marking could be recommended. Both the liquid system and fluorescent thermoplastic pavement markings outperformed the fluorescent paint. As expected, younger drivers attained the longest detection distances, which likely can be attributed in part to their faster reaction times and increased contrast sensitivity. CONCLUSIONSThe results of the Phase II research indicated that supplemental UV–A did not provide sufficient improvement in visibility to justify conducting the onroad field study planned for Phase III; however, the IR–TIS technology in clear conditions did show a meaningful improvement in visibility of pedestrians (especially pedestrians in low-contrast clothing) over headlamps alone. IR–TIS also improved visibility in the fog condition but not in rain. The maximum illumination directed toward the driver’s eye by the opposing headlamps was the overriding factor contributing to the reported discomfort sensation. Based on these results, modifications to the Schmidt-Clausen and Bindels equation were made to allow the maximum level or last experienced level of illuminance at the driver’s eye to be used in predicting ratings of discomfort glare.(3) This equation could potentially help headlamp designers early in the design process. Because the UV–A sources used in the study did not produce much visible light, the addition of the UV–A did not substantially increase discomfort glare ratings. No VES and pavement marking pair outperformed other pairs enough to merit recommendation. An unfortunate side effect of providing UV–A-sensitive marking materials is that the fluorescent properties fade rapidly because of the lack of UV protection from the sun. This was clearly a factor in these results; however, because there is no known practical method for alleviating this issue, no additional testing was warranted.
|