U.S. Department of Transportation
Federal Highway Administration
1200 New Jersey Avenue, SE
Washington, DC 20590
202-366-4000


Skip to content
Facebook iconYouTube iconTwitter iconFlickr iconLinkedInInstagram

Federal Highway Administration Research and Technology
Coordinating, Developing, and Delivering Highway Transportation Innovations

Report
This report is an archived publication and may contain dated technical, contact, and link information
Publication Number: FHWA-HRT-04-144
Date: December 2005

Enhanced Night Visibility Series, Volume XIII: Phase III—Study 1: Comparison of Near Infrared, Far Infrared, High Intensity Discharge, and Halogen Headlamps on Object Detection in Nighttime Clear Weather

PDF Version (1.01 MB)

PDF files can be viewed with the Acrobat® Reader®

APPENDIX E—VISION TEST RESULTS


Bar graph. Color vision results for the three age groups by response. Click here for more detail.

Figure 74. Bar graph. Color vision results for the three age groups by response.


Bar graph. Color weak or color blind participants per age group. Click here for more detail.

Figure 75. Bar graph. Color weak or color blind participants per age group.


Bar graph. Participant visual acuity per age group. Click here for more detail.

Figure 76. Bar graph. Participant visual acuity per age group.


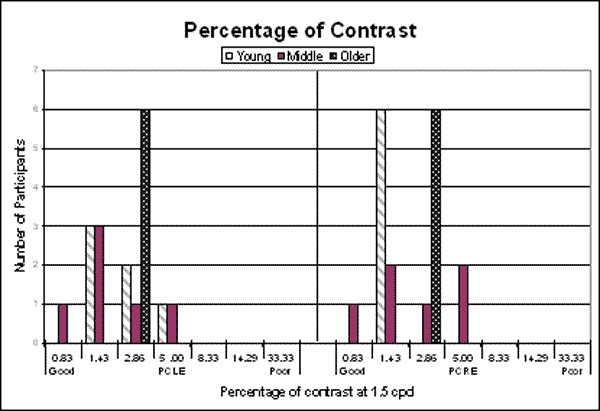
Bar graph. Percentage of contrast for left eye (PCLE) and percentage of contrast for right eye (PCRE) at 1.5 cycles per degree (cpd) per age group. Click here for more detail.

Figure 77. Bar graph. Percentage of contrast for left eye (PCLE) and percentage of contrast for right eye (PCRE) at 1.5 cycles per degree (cpd) per age group.


Bar graph. Percentage of contrast at 3.0 cpd per age group. Click here for more detail.

Figure 78. Bar graph. Percentage of contrast at 3.0 cpd per age group.


Bar graph. Percentage of contrast at 6.0 cpd per age group. Click here for more detail.

Figure 79. Bar graph. Percentage of contrast at 6.0 cpd per age group.


Bar graph. Percentage of contrast at 12.0 cpd per age group. Click here for more detail.

Figure 80. Bar graph. Percentage of contrast at 12.0 cpd per age group.


Bar graph. Percentage of contrast at 18.0 cpd per age group. Click here for more detail.

Figure 81. Bar graph. Percentage of contrast at 18.0 cpd per age group.


Table 31. Participant height.
Participant Standing Height (mm)
1 1,664
2 1,867
3 1,778
4 1,575
5 1,829
6 1,676
7 1,715
8 1,918
9 1,803
10 1,676
11 1,765
12 1,600
13 1,905
14 1,740
15 1,791
16 1,613
17 1,727
18 1,588
Mean = 1,735
SD = 106


Previous    Table of Contents    Next
Federal Highway Administration | 1200 New Jersey Avenue, SE | Washington, DC 20590 | 202-366-4000
Turner-Fairbank Highway Research Center | 6300 Georgetown Pike | McLean, VA | 22101