U.S. Department of Transportation
Federal Highway Administration
1200 New Jersey Avenue, SE
Washington, DC 20590
202-366-4000
Federal Highway Administration Research and Technology
Coordinating, Developing, and Delivering Highway Transportation Innovations
 |
| This report is an archived publication and may contain dated technical, contact, and link information |
|
Publication Number: FHWA-HRT-04-145
Date: December 2005 |
|||||||||||||||||||||||||||||||||||||||||||||||||||||||||||||||||||||||||||||||||||||||||||||||||||||||||||||||||||||||||||||||||||||||||||||||||||||||||||||||||||||||||||||||||||||||||||||||||||||||||||||||||||||||||||||||||||||||||||||||||||||||||||||||||||||||||||||||||||||||||||||||||||||||||||||||||||||||||||||||||||||||||||||||||||||||||||||||||||||||||||||||||||||||||||||||||||||||||||||||||||||||||||||||||||||||||||||||||||||||||||||||||||||||||||||||||||||||||||||||||||||||||||||||||||||||||||||||||||||||||||||||||||||||||||||||||||||||||||||||||||||||||||||||||||||||||||||||||||||||||||||||||||||||||||||||||||||||||||||||||||||||||||||||||||||||||||||||||||||||||||||||||||||||||||||||||||||||||||||||||||||||||||||||||||||||||||||||||||||||||||||||||||||||||||||||||||||||||||||||||||||||||||||||||||||||||||||||||||||||||||||||||
Enhanced Night Visibility Series, Volume XIV: Phase III—Study 2: Comparison of Near Infrared, Far Infrared, and Halogen Headlamps on Object Detection in Nighttime RainPDF Version (1.52 MB)
PDF files can be viewed with the Acrobat® Reader® CHAPTER 4—DISCUSSIONThis chapter begins with an explanation of stopping distance and continues with the calculation of stopping distances for each VES at various speeds plus tabulated detection distances for each object. The discussion continues with a summary of the performance of each of the VESs and comparisons to both the baseline HLB VES (a readily available system) and the FIR VES (the system that outperformed the others in detecting pedestrians in the clear driving condition in the previous study (ENV Volume XIII). The summaries for the different VESs also contain more detailed observations about the performance of each VES. The chapter concludes with some general comments about results of the clear weather study versus results in the rainy weather study, and the results of the near (active) versus far (passive) IR systems. As mentioned in chapter 2, the aiming protocol used for this study resulted in a deviation in the location of maximum intensity from where it typically is for the HLB VES. Details about this deviation are discussed in ENV Volume XVII, Characterization of Experimental Vision Enhancement Systems. As a result of the headlamp aiming, the detection and recognition distances likely increased for the HLB configuration. It is important to consider the results presented in this study in the context and conditions tested. If different halogen headlamps or aiming methods had been used, different results might have been obtained. STOPPING DISTANCESWhile these detection and recognition distances provide an indication of the advantages of one system over another, they fail to describe completely potential safety benefits or concerns based on VES use. With a limited number of assumptions, the VES-specific detection distances in rainy weather conditions can be compared with various speed-dependent stopping distances, which can help determine how easy it is to out-drive a system. In other words, when are the increased detection distance advantages of a particular system overridden by an increase in vehicle speed resulting from a driver’s unfounded sense of security? Collision-avoidance research dealing with different aspects of visibility suggests that time-to-collision is an important factor in enhancing driving safety.(9) For consistency, time-to-collision is presented as distance-to-collision (or stopping distance) for direct comparisons to the detection distances in this current study. Stopping distance is the sum of two components: (1) the distance needed for the braking reaction time (BRT) and (2) braking distance (table 8). Braking distance is the distance that a vehicle travels while slowing to a complete stop.(10) The results from driver braking performance studies suggest that the 95th percentile BRT to an unexpected object scenario in open-road conditions is about 2.5 s. (See references 11, 12, 13, and 14.) The braking distances in table 8 are calculated using the equation shown in figure 22. Figure 22. Equation. Braking distance approximation. The equation in figure 22 assumes an acceleration (g) of 9.8 m/s2 (32.2 ft/s2), a final speed of zero, a coefficient of friction (f) between the tire and the pavement of 0.35, and a straight, level roadway
The calculations shown in table 8 represent a simple and ideal condition, but they allow for some visualization of the capabilities of VESs. These stopping distances can be used as a measure of the capability of VESs to provide enough time to detect, react, and brake to a stop at different speeds, but with some caveats. First, in this study, distances were obtained while drivers were moving at approximately Table 9 through table 12 present VES and object combinations with mean detection distances that might compromise sufficient stopping distances. (In these tables, an "X" means the stopping distance might be compromised). Note that the detection distances in tables 9 through 12 for each VES and object combination were collected while the drivers were traveling in a controlled manner (e.g., within a specified speed range) and thus assume that such distances translate to all of the speeds listed.
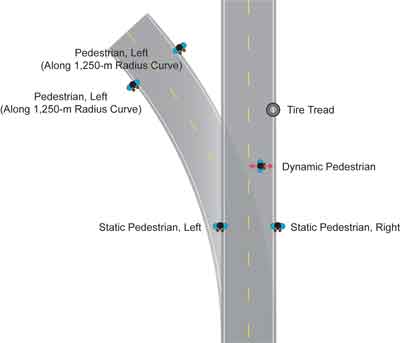
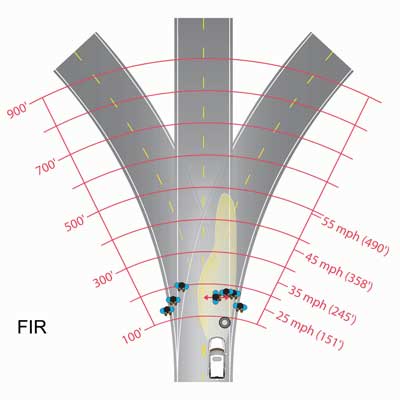
To provide an overview of each system’s performance, graphics are provided for each VES. Figure 23 depicts some of the general graphics used in the representations of specific VESs. The VES-specific representations, figure 24 through figure 27, depict the detection performance for each of the pedestrian scenarios and the obstacle scenario (tire tread). Pedestrian icons facing straight down on the diagram (e.g., Static Pedestrian, Left) were presented on straight road segments. Pedestrian icons angled with the road (e.g., Pedestrian, Left) were presented on the curved road segment. Each graphic is intended to give an overall impression rather than precise comparisons. Figure 23. Diagram. Graphics for detection distances. Where patterns or items of interest are identified for specific VESs in figure 24 through figure 27, the reader is encouraged to refer to table 19 through table 24 (presented subsequently) to investigate the information in more detail. Additionally, while reading the following Discussion sections, the graphics provide a quick comparison of the discussed results. Each graphic includes an icon representing mean detection distance for a given scenario. The mean-detection-distance scale is located on the left side of the diagram. On the right side, the approximate stopping distance required for given speeds is shown. Where an icon is below a given speed, the stopping distance (where required) may be insufficient for the given speed. Figure 24. Diagram. FIR mean detection distances.
In general, stopping distances are insufficient for the FIR system except at speeds less than 48 km/h (30 mi/h) for all objects. Stopping distances are compromised at speeds of only 40 km/h (25 mi/h) for the pedestrian on the left side of a left curve, the pedestrian on the right side of a right curve, and the tire tread. The FIR system produced detection distances similar to, but always less than, the HLB in all of the tested scenarios, though not significantly so. It follows that the FIR system also underperformed the NIR systems in all scenarios. The FIR detection distances were, in fact, significantly lower than those of the NIR 1 system for the detection of all pedestrian scenarios except the pedestrian on the right side of both the left and right curves (LFtrnRT and RTtrnRT). Note that detection distances were not significantly different for these two scenarios between any of the VESs. Table 13 and table 14 illustrate some of the differences between the FIR system results and those of the other VESs. These tables include information similar to that provided for the HLB baseline, but the percentage differences comparisons are made to the FIR system. (An asterisk indicates a significant difference.)
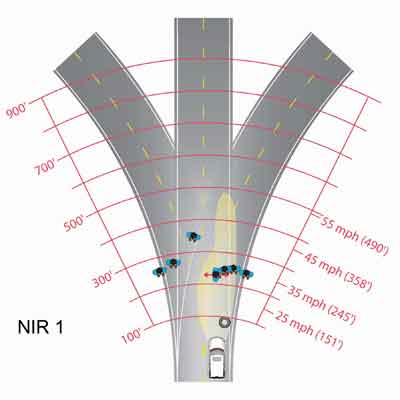
Figure 25. Diagram. NIR 1 mean detection distances.
For the NIR 1, all pedestrian scenarios were associated with detection distances close to or higher than required stopping distances at speeds in the 56 km/h (35 mi/h) range. Detection of one scenario, the pedestrian on the left side of a right curve, could allow sufficient stopping distance at a speed of nearly 72 km/h (45 mi/h). The NIR 1 system provided better overall performance (shorter detection distances) than the HLB and the FIR system in all scenarios except the tire tread scenario, when it performed worse (longer detection distances) than any other system, though not significantly. The NIR 1 also performed better than or similar to the NIR 2 system in several scenarios. The differences between the NIR 1 system and the HLB, as well as the FIR, are generally significant. The exceptions, as mentioned earlier, are the scenarios with pedestrians on the right side of curves, for which detection distances are longer for NIR 1, but not statistically significant. Table 15 and table 16 illustrate some of the differences between the NIR 1 system results and those of the other VESs. These tables include information similar to that provided for the HLB baseline, but the percentage differences comparisons are made to the NIR 1 system. (An asterisk indicates a significant difference.)
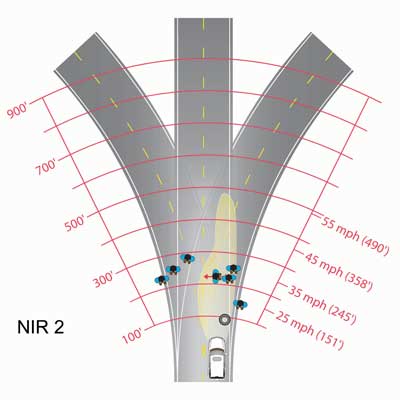
Figure 26. Diagram. NIR 2 mean detection distances.
Similar to the NIR 1 system, pedestrian detection distances for NIR 2 were acceptable compared to required stopping distances at speeds in a range around 56 km/h (35 mi/h). The detection of some pedestrian scenarios allows adequate stopping distance up to slightly above 56 km/h (35 mi/h), and others are acceptable only at speeds slightly below 56 km/h (35 mi/h). The exception is the pedestrian on the right side of a right curve, which is not detected at an acceptable distance, even at a speed as low as 40 km/h (25 mi/h). Although similar to NIR 1 values, the NIR 2 system effectively decreases the allowable speed for adequate stopping distance for every pedestrian scenario, compared to the same scenarios using the NIR 1 system. With the exception of the tire tread, the NIR 2 tended to perform close to or below the NIR 1, but better than the other two systems. In ENV Volume XIII, the NIR 2 VES was found to have a generally lower performance than the other VESs in clear weather. Thus, the improvement in relative performance in this study indicates the potential benefits of NIR technology. Table 17 and table 18 illustrate some of the differences between the NIR 2 system results and those of the other VESs. These tables include information similar to that provided for the HLB baseline, but the percentage differences comparisons are made to the NIR 2 system. (An asterisk indicates a significant difference.)
Figure 27. Diagram. HLB mean detection distances.
The HLB provided sufficient detection distances in relation to stopping distances only at low speeds (below 56 km/h (35 mi/h)) for all objects. For the pedestrian on the left side of a left curve and the tire tread, stopping distance could be compromised even at a speed as low as 40 km/h (25 mi/h). Unlike the clear weather performance found in the previous testing, the HLB was surpassed in most of the scenarios by the NIR systems tested. HLB, which was the baseline for the technologies tested, produced significantly lower detection distances than both NIR systems for the static pedestrians on the left and right sides of the straight road. The HLB also had significantly lower detection distances than the NIR 1 system for the pedestrian standing on the left side of both a left curve and a right curve (i.e., LFtrnLF and RTtrnLF). These findings are listed in table 19, which includes percentage differences from HLB detection distances for each of the other three VESs (an asterisk indicates a significant difference). Table 20 lists similar findings for the recognition distances.
COMPARISON OF RAIN AND CLEAR CONDITION DETECTION DISTANCESThe participants in this study also took part in the previous IR study in clear weather (ENV Volume XIII). Table 21 to table 27 provide the mean detection distance and standard error for each object in the rain and clear studies. The tables also provide the detection distances in the rain condition as a percentage of the detection distances in the clear condition. The only scenario in which a VES had a higher detection distance in the rain condition than in the clear condition was the FIR with the pedestrian on the left during a left turn (table 21). As discussed in the clear study, this pedestrian likely was not visible with the FIR because of the system’s field of view; therefore, this pedestrian likely was detected with headlamps alone in the clear study as well as in the rain study. The FIR system could not distinguish pedestrians in the rain; therefore, participants may have glanced at the FIR system less and the road more, resulting in slightly longer detection distances with this VES in the rain condition than in the clear condition, although these detection distances are not statistically different. In fact, after considering the relative detection distances of other objects in rain, it appears that detection with the FIR configuration actually was performed with the headlamps alone in the rain condition. The potential merit of NIR in rain can be seen by further examination of the NIR 2 results in the clear and rain studies. The detection distances with the FIR in rain conditions ranged from 18 percent to 32 percent of the detection distances in the clear condition; however, for the pedestrian on the left in a left turn scenario, the NIR 2 system showed no detection decrement in rain and a 41 percent longer detection than the FIR. (Both the FIR and the NIR 2 were on the same SUV model and year with the same type of headlamps.) Assuming that the participants driving with the FIR system were using headlamps alone, this result could indicate a potential benefit of NIR. In the clear study, the NIR 2 system had the shortest detection distance for all the objects and VESs that were also included in the rain study (tables 25 to 31). In the rain study, the NIR 2 had the second greatest detection distance in six out of the seven pedestrian scenarios. Assuming that the FIR system provided only headlamps to detect pedestrians, the NIR 2 system indicated an average 30 percent benefit over headlamps alone for these six scenarios. In the remaining scenario, a pedestrian on the right in a right turn, it appears that drivers with the NIR 2 used headlamps only because the short detection distance of the VES was similar to the detection distance with the FIR (table 24). The pedestrian is this scenario may be outside the FOV of the NIR 2 system. (See ENV Volume XIII for further discussion.) The other NIR system, NIR 1, had the longest detection distance in all the pedestrian scenarios in rain conditions, further highlighting the potential benefit of near IR in rain conditions. The NIR 1 system had either the longest or the second longest detection distance for pedestrians in clear condition scenarios that were also included in the rain study. The halogen lights showed a 50 to 70 percent decrement in detection distance in the rain condition when compared to the clear condition. This decrement, combined with the potential added detection benefit of the NIR system in rain conditions, indicates a possible added safety benefit from including a supplemental NIR system on a vehicle.
SUBJECTIVE RATINGSThe NIR 1 system received the most favorable ratings overall in the subjective scaled responses. With the exception of the statement "This VES did not cause me any more visual discomfort than my regular headlights," the mean subjective statement responses for NIR 1 were the most favorable among the four VES configurations. In particular, the responses for statements 1 and 2, allowing detection and allowing recognition of objects compared to regular headlamps, were statistically greater for the NIR 1 system compared to the other three systems. These subjective results correspond to the objective results discussed previously, and they demonstrate that drivers subjectively felt the advantage of NIR in the detection and recognition of objects as well. For the cases in which drivers felt better able to detect and recognize objects while using the NIR 1 system, there were no significant differences in ratings related to the age of the drivers. There was some evidence of more favorable ratings for older drivers when they asked whether systems aided in the determination of road direction (statement 4), but there was no significant difference in these ratings related to VES and no interaction of VES and age for this category.
|