U.S. Department of Transportation
Federal Highway Administration
1200 New Jersey Avenue, SE
Washington, DC 20590
202-366-4000
Federal Highway Administration Research and Technology
Coordinating, Developing, and Delivering Highway Transportation Innovations
 |
| This report is an archived publication and may contain dated technical, contact, and link information |
|
Publication Number: FHWA-HRT-04-145
Date: December 2005 |
||||||||||||||||||||||||||||||||||||||||||||||||||||||||||||||||||||||||||||||||||||||||||||||||||||||||||||||||||||||||||||||||
Enhanced Night Visibility Series, Volume XIV: Phase III—Study 2: Comparison of Near Infrared, Far Infrared, and Halogen Headlamps on Object Detection in Nighttime RainPDF Version (1.52 MB)
PDF files can be viewed with the Acrobat® Reader® CHAPTER 2—METHODSPARTICIPANTSFifteen individuals participated in this study. The participants were divided into three different age categories: five participants were between the ages of 18 and 25 years (younger category of drivers), five were between the ages of 40 and 50 (middle category of drivers), and five were over the age of 65 (older category of drivers). Each age category had two males and three females. All these individuals participated in the previous IR study conducted in clear weather conditions (ENV Volume XIII). Candidates were allowed to participate in the study after they completed a screening questionnaire and if they fulfilled the selection conditions listed in appendix A. Participants had to sign an informed consent form (appendix B), present a valid driver’s license, pass the visual acuity test (appendix C) with a score of 20/40 or better as required by Virginia State law, and have no health conditions that made operating the research vehicles a risk. Participants were instructed about their right to freely withdraw from the research program at any time without penalty. They were told that no one would try to make them participate if they did not want to continue and that they would be paid 20 dollars per hour for the amount of time of actual participation. All data gathered as part of this experiment were treated with complete anonymity. During the experiment, each participant drove with four different VESs during one night of driving. The session included training in which the study was described and the forms and questionnaires were completed (appendixes A and B). The participant completed a practice lap in the first experimental vehicle to become familiar with the Virginia Smart Road and the detection and recognition methods. The presentation orders for each VES were counterbalanced (table 1). A detailed explanation of each VES configuration appears in the Independent Variables section of this report. The VES configurations for this study were defined as follows:
EXPERIMENTAL DESIGNThe study was a four (VES configuration) by eight (Object) by three (Age) mixed factor design. The between-subjects factor of the experiment was age, which had the same three levels used in the other ENV studies (i.e., younger, middle-aged, and older). VES type was a within-subjects factor that included the four VESs in table 1. As shown in table 2, there were eight different objects, including seven pedestrian scenarios and a tire tread. Participants were exposed to the left, right, and dynamic (i.e., crossing the road) pedestrian scenarios in the straight segment of the test road (table 2). Each participant was exposed to only two of the four turn scenario pedestrians; therefore, the participant was exposed to either a left- or right-positioned pedestrian in a left turn and either a left- or right-positioned pedestrian in a right turn. A detailed explanation of the independent variables follows.
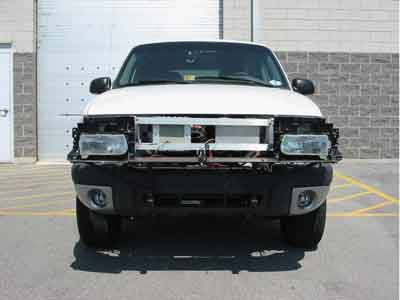
INDEPENDENT VARIABLESThis experiment incorporated the independent variables of VES configuration, age, and object. The age factor had three levels: younger participants (18 to 25 years), middle-aged participants (40 to 50 years) and older participants (65 years or older). These age groups were created based on literature review findings that suggest changes in vision during certain ages. (See references 1, 2, 3, 4, and 5.) Each age group was made up of two males and three females that had participated in the previous IR clear study (ENV Volume XIII). The four VESs were also tested in a previous study that evaluated detection and recognition of 17 objects in clear weather (ENV Volume XIII). Note that the configurations include an SUV 1 with an FIR system and an SUV 1 with a NIR 2 system. These SUVs were not the same vehicle, but they were the same make, model, and year of vehicle; therefore, the same naming convention was used for both vehicles. Following are detailed descriptions of the four VESs and the vehicle platform used to mount them. SUV 1 with Prototype Far Infrared Vision SystemA prototype FIR system was tested on an SUV. This system is referred to as "FIR" throughout this document. The system display used a direct-reflect virtual image with an 11.7° horizontal by 4° vertical FOV. The reflective mirror was located in a high head down (HHD) position on the instrument panel surface above the instrument cluster and on center with the driver. The reported magnification at the eye was approximately 1:1. The production halogen headlamps used were for this vehicle. SUV 2 with Prototype Near Infrared Vision SystemA prototype NIR system that used a laser IR emitter was tested on a second SUV. This system is referred to as "NIR 1" throughout this document. The system used a curved mirror display with an 18° horizontal by ~6° vertical FOV. The mirror was located in a HHD position on the instrument panel surface above the instrument cluster and on center with the driver. The reported minification was ~2:3 at the eye. The production halogen headlamps were used for this vehicle. SUV 1 with Prototype Near Infrared Vision SystemA prototype NIR system that used halogen IR emitters was tested on the same type of SUV as the FIR system. This system is referred to as "NIR 2" in this document. The system display used a direct-reflect virtual image with an 11.7° horizontal by 4° vertical FOV. The reflective mirror was located in a HHD position on the instrument panel surface above the instrument cluster and on center with the driver. The reported magnification at the eye was approximately 1:1. The production halogen headlamps were used for this vehicle. SUV 3 with Halogen Low BeamThe halogen low beam (HLB) headlamps were tested on SUV 3 using a light rack as shown in figure 1. These headlamps were tested to provide a halogen benchmark for the other VESs tested and a comparison point to previous studies. These headlamps are referred to as "HLB" throughout this document. Table 3 lists the different VESs, the vehicles on which the VESs were tested, the headlamps on the vehicle, and, where applicable, the display method, FOV, and image minification or magnification. Specification of display, display FOV, and minification/magnification were provided by the system engineers responsible for designing the systems.
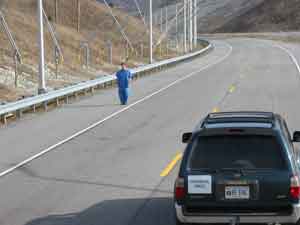
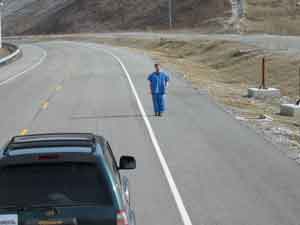
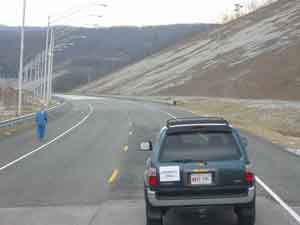
Headlamp technical specifications appear in ENV Volume XVII, Characterization of Experimental Vision Enhancement Systems. ObjectsUsing the four VESs, detection and recognition distances were measured for seven pedestrian scenarios and a tire tread. The main reason pedestrians were included in this study was because of their high crash-fatality rates.(6,7) Although pedestrian mockups have been used in previous research of this type,(8) human pedestrians were used here to permit performance measurement of the FIR VES, which functions based on temperature characteristics of the object of interest. To investigate the interaction of beam patterns and FOV as well as road geometry when viewed from the driver’s perspective, pedestrians were presented in various positions along the roadway. The pedestrians, wearing denim clothing, either were static on the side of the road and facing oncoming traffic or walking across the lane, perpendicular to the approaching vehicle, with their faces looking toward the approaching vehicle. The static pedestrians were positioned on the left or right shoulder in straight sections of the roadway and in left and right curves of 1,250-m (4,101-ft) radius. The tire tread represented low-contrast objects common in public roadways. The tire tread was selected because of its potential for very low detection distances, which often lead to last moment object-avoidance maneuvers. The tire tread also provided a point of comparison to previous ENV studies. Table 4 and figure 2 through figure 9 describe the objects used and their locations. (For visual clarity, the figures do not represent the environmental conditions in this study).
OBJECTIVE DEPENDENT VARIABLESTwo objective performance measures were collected : (1) the distance at which a participant could first detect something in the road ahead and (2) the distance at which the participant could correctly recognize (i.e., identify) the object ahead. The participant was provided with a definition of detection: "Detection is when you can just tell that something is ahead of you. You cannot tell what the object is, but you know something is there." Each participant was also given the definition of recognition during data collection and analysis: "Recognition is when you not only know something is there, but you also know what it is." The method for translating into distance measurements is described in the Apparatus and Materials section. SUBJECTIVE RATINGSUsing a seven-point Likert-type scale, the participant was asked to indicated agreement or disagreement with a series of seven statements for each VES. The two anchor points of the scale were "1" (indicating "Strongly Agree") and "7" (indicating "Strongly Disagree"). The scale shown in figure 10 was located on the instrument panel for the participant to refer to while responding to the statements. The statements were intended to address the participant’s perception of improved vision, safety, and comfort after using a particular VES. The participant was asked to compare each VES to his or her "regular headlights" (i.e., the headlights on his or her own vehicle); the assumption was made that the participant’s personal vehicle represented what he or she knew best, and therefore, was most comfortable using. The statements used for the scaled response questionnaire included the following (note that while the word "headlamp" is used throughout the ENV series, the subjective questions posed to the participants used the synonymous word "headlight," as reflected below):
The following open-ended questions also were presented to each participant:
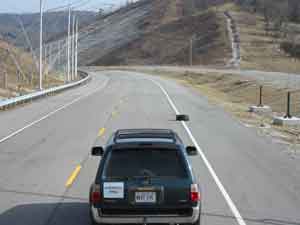
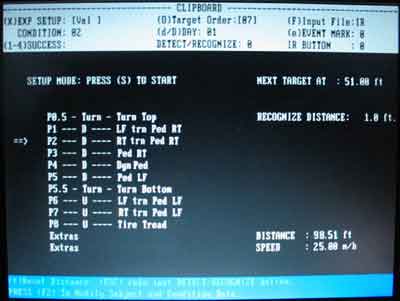
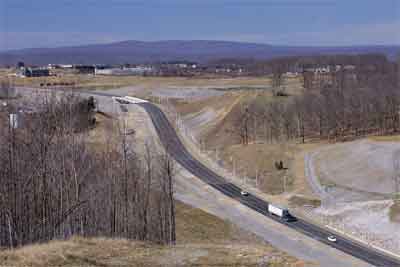
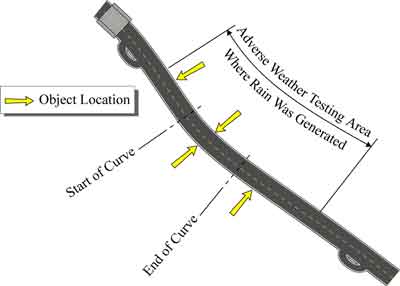
SAFETY PROCEDURESSafety procedures were implemented as part of the instrumented-vehicle system. These procedures were used to minimize possible risks to participants during the experiment. The safety measures required that all data-collection equipment be mounted, to the greatest extent possible, so that it did not pose a hazard to the driver in any foreseeable instance; participants had to wear the seatbelt restraint system any time the car was on the road; none of the data-collection equipment could interfere with any part of the driver’s normal field of view; a trained in-vehicle experimenter had to be in the vehicle at all times; and an emergency protocol was established before the testing began. The participant was required to maintain a speed of 16 km/h (10 mi/h) while driving under the rain towers and 40 km/h (25 mi/h) otherwise. Two-way communications were maintained between the onroad crew and the in-vehicle experimenter to ensure the onroad scenarios were ready and the vehicle was following the expected path. Onroad pedestrians also visually monitored the approach of the participant’s vehicle and moved away from the lane boundary about 1.5 s before its approach. APPARATUS AND MATERIALSOnroad driving was conducted using four vehicles. The experimental vehicles included four SUVs, two of which were the same model. All vehicles were instrumented to collect distance information on a laptop computer using software specifically developed for this study. The software logged information such as the participant’s age, gender, and assigned identification number, prompted the experimenter with the appropriate object order for each participant and VES trial, and collected detection and recognition distances. Figure 11 shows the screen used by the experimenters to provide turn guidance, monitor object presentation orders, and collect data. Measurements of object detection and recognition distances were collected using two methods. When a participant detected an object, he or she would say the word "something." Then, when the participant could recognize the object, he or she would provide a verbal identification. At each of these utterances, the in-vehicle experimenter would press a button to flag the data. The in-vehicle experimenter pressed the spacebar when the bumper of the vehicle passed the object. The data flags generated by these button presses provided one method for collecting the distance measures. In addition, as the participant vehicle passed an object, the onroad crew transmitted the number of the object over the radio (inaudible to the participant), which was synchronized with the datastream. A video and audio recording of the participant orally stating detection and recognition, combined with the onroad crew’s transmission from when the vehicle passed the object, provided a second method for identifying the distance measurements in the datastream. Smart RoadThe Virginia Smart Road (see figure 12) was used for the onroad study. Figure 13 presents a schematic of the Smart Road segment used in this study with examples of object locations. Figure 12. Photo. Smart Road. In this study, there were four object locations, two on each side of the road. Each lap included a blank (i.e., no object) at one of the locations. Figure 13 is a schematic of the Smart Road with the object locations. All objects were presented in the all-weather testing portion of the Smart Road. Using the Smart Road pumping system, a constant water pressure was distributed to the 40 rain towers used for the experiment. The rain rate used for the investigation was 12.5 cm/hr (2.5 inches/hr), and the rain towers were located every 9.2 to 10.7 m (30 to 35 ft). The tower heads were positioned over the centerline of the westbound lane of the test facility. From this position, consistent rain was available only in this lane, which forced the participant to drive in the wrong lane when he or she was traveling the eastbound (downhill) leg of the test route. The participant started each drive from the contractor building. One onroad experimenter was assigned to each participant; this experimenter was responsible for showing the participant where the different controls were and verifying that the correct VES configuration was being tested. Five onroad experimenters positioned tire treads, worked as pedestrians, and shuttled other onroad experimenters to different object locations during the session. A sixth onroad experimenter was responsible for presenting certain scenarios, preparing the next vehicle for the participant, and making measurements of the participant’s eye position and instrument dimmer settings. The participant made two laps through the weather testing section in each of the four vehicles used for data collection. The participant experienced a different object order for each vehicle. Headlamp and IR System AimingThe HLB headlamps were mounted on a testing rack external to the experimental vehicle. This mounting, developed at the beginning of the ENV project, allowed different headlamps to be swapped on a single vehicle for each night of testing. An aiming procedure was developed to ensure that the headlamp condition was the same after every swap. The procedure was the same for all of the ENV testing. During the photometric characterization of the headlamps, it was discovered that the maximum intensity location of the HLB was aimed higher and more toward the left than typically specified. This aiming deviation likely increased detection and recognition distances for the HLB configuration. Details about the aiming procedure and the maximum intensity location are discussed in ENV Volume XVII, Characterization of Experimental Vision Enhancement Systems. The headlamps on the FIR vehicle, NIR 2 vehicle, and NIR 1 vehicle were production headlamps. They were aimed before the study, and they did not require further aiming. The aiming of cameras and IR emitters on these vehicles was checked according to the procedures provided by the system manufacturers. When necessary, the aiming was further confirmed by comparing IR system images collected at the start of the study to new system images. The NIR 2 vehicle was the only IR system that required re-aiming during testing. This was because the adhesive tape used on the provided prototype system came unfastened between sessions of the experiment. EXPERIMENTAL PROCEDUREParticipant ScreeningThe participants in this study had participated in the previous ENV IR study in clear conditions (ENV Volume XIII). Candidates were initially screened over the telephone (appendix A), and if a candidate qualified for the study, a time was scheduled for testing. Candidates were instructed to meet the experimenter at the contractor facility in Blacksburg, VA. After arriving, an overview of the study was presented to each candidate. Subsequently, each candidate was asked to complete the Informed Consent Form (appendix B) and take an informal vision test for acuity using a Snellen chart and a contrast sensitivity test (appendix C). The vision tests and predrive questionnaires from the clear weather study were used because each of the candidates had completed it recently. After the candidate qualified and these steps were completed, the participant began the training portion of the session. TrainingThe participant was given an overview of the study indicating that it was similar to the previous study (ENV Volume XIII) during which the participant was provided with a definition of detection ("Detection is when you can just tell that something is ahead of you. You cannot tell what the object is, but you know something is there") and recognition ("Recognition is when you not only know something is there but you also know what it is"). The participant was instructed to say the word "something" when he or she detected an object, and then say what he or she saw when he or she could identify it. The participant was shown daytime photographs of each of the experiment objects similar to those in table 4. The participant was then shown the questionnaire that would be administered after he or she drove each vehicle. The in-vehicle questionnaire included subjective questions rated on a seven-point Likert-type scale to record the participants’ perceptions of the performance of the VES compared to his or her normal headlamps. Each statement was read aloud and the in-vehicle experimenter reviewed the scale. If the participant had no questions, the training was complete. Vehicle FamiliarizationNext, the experimenter took the participant to the first test vehicle. In this vehicle (as well as subsequent vehicles), the experimenter helped the participant adjust the seat, steering wheel, and instrument panel lighting. Where an in-vehicle display was present, the experimenter assisted the participant in achieving a clear view of the image and showed him or her how to adjust the brightness of the display. The participant was permitted to adjust the instrument panel and display brightness three times—before driving, halfway through the practice, and at the end of the practice drive. The brightness settings were recorded, and remained set throughout data collection. After the participant was ready, an onroad experimenter measured eye position in relation to landmarks on the door. When this was complete, to provide a reference for video data of driver glances (video was recording during this phase), the participant was asked to look at various locations in and around the vehicle while saying the location aloud. Where a display was present in the vehicle, the participant was instructed: "This system is not intended to be used alone. Instead, it is supposed to accompany your normal driving. Be sure to view the road as you normally do while also using the display." Driving and Practice LapThe participant then drove a practice lap to become familiar with the vehicle, the objects, the road, and the procedure for calling out objects. During the driving portions of the study, the in-vehicle experimenter rode in the second-row passenger-side seat of the vehicle. The participant was reminded of the procedure and instructed not to drive faster than 10 mi/h (16 km/h) while in the rain section. After the practice lap was completed, the participant began the test drive. During the actual test drive, the in-vehicle experimenter configured and monitored the data collection system, recorded when the participant detected and recognized objects, gave guidance on where to make turns, checked speed, and, if necessary, advised the participant to maintain the 10 mi/h (16 km/h) speed limit. General Onroad ProcedureWhile the participant drove the practice lap and the test drive, the onroad crew was responsible for presenting objects at different locations along the Smart Road according to the appropriate object order for each participant and VES. The participant had a different object order for each of the four vehicles he or she drove. Each time the bumper of the participant’s vehicle passed the current object, an onroad experimenter transmitted its number by radio.
|