U.S. Department of Transportation
Federal Highway Administration
1200 New Jersey Avenue, SE
Washington, DC 20590
202-366-4000
Federal Highway Administration Research and Technology
Coordinating, Developing, and Delivering Highway Transportation Innovations
 |
| This report is an archived publication and may contain dated technical, contact, and link information |
|
Publication Number: FHWA-HRT-04-145
Date: December 2005 |
|||||||||||||||||||||||||||||||||||||||||||||||||||||||||||||||||||||||||||||||||||||||||||||||||||||||||||||||||||||||||||||||||||||||||||||||||||||||||||||||||||||||||||||||||||||||||||||||||||||||||||||||||||||||||||||||||||||||||||||||||||||||||||||||||||||||||||||||||||||||||||||||||||||||||||||||||||||||||||||||||||||||||||||||||||||||||||||||||||||||||||||||||||||||||||||||||||||||||||||||||||||||||||||||||||||||||||||||||||||||||||||||||||||||||||||||||||||||||||||||||||||||||||||||||||||||||||||||||||||||||||||||||||||||||||||||||||||||||||||||||||||||||||||||||||||||||||||||||||||||||||||||||||||||||||||||||||||||||||||||||||||||||||||||||||||||||||||||||||||||||||||||||||||||||||||||||||||||||||||||||||||||||||||||||||||||||||||||||||||||||||||||||||||||||||||||||||||||||||||||
Enhanced Night Visibility Series, Volume XIV: Phase III—Study 2: Comparison of Near Infrared, Far Infrared, and Halogen Headlamps on Object Detection in Nighttime RainPDF Version (929 KB)
PDF files can be viewed with the Acrobat® Reader® APPENDIX J—RESULTS FOR ANOVA WITHOUT THE LOW/WIDE VESIn order to assess the influence of the low/wide VES on the original results, a secondary analysis was performed. This analysis used the same models, excluding the low/wide VES, as the original analysis of the detection distance, illuminance at the driver’s eye, and deBoer glare rating as discussed in the Results section. The significant main effects and interactions for each dependent variable are marked with an “x” in table 18. The effect of pedestrian location and its interactions were not applicable to the deBoer glare ratings. The secondary ANOVA indicated no changes in significant difference for the detection distance or the deBoer glare ratings. Not surprisingly, with the exception of the Pedestrian by VES interaction, all the significant interactions in the original analysis (indicated by a dash in table 18) were not significant in this analysis.
DEBOER SCALE RATINGSTable 19 shows the secondary ANOVA results for the deBoer glare ratings. Only the main effect of VES glare (VES) was significant for the subjective measure of discomfort (p < 0.05). Results of a post hoc analysis of this main effect, shown in table 20, show no differences between the results of the original analysis and the secondary analysis.
DETECTION DISTANCETable 21 shows results of the secondary ANOVA for detection distance. The significant results of the original analysis and the secondary analysis were the same: a significant two-way interaction—Pedestrian by VES—and three main effects—age, VES, and pedestrian location.
Pedestrian by VES InteractionThe significant interaction of pedestrian location and VES is illustrated in figure 27. The results are the same between the original analysis and the secondary analysis. The low/narrow VES had the lowest detection distance for both the pedestrian on the left and the pedestrian on the right. The other VESs had similar distances to each other for the pedestrian on the left; however, the pedestrian on the right appeared to have longer detection with the medium/medium VES, which was rated as less glaring on the deBoer scale. Figure 27. Bar graph. Secondary analysis mean detection distances for the interaction of pedestrian and VES.
VES Main EffectThe secondary analysis found the main effect of VES to be significant (p < 0.05). Post hoc analyses for the original and secondary analyses indicated the same results (table 22).
Pedestrian Main EffectThe main effect of pedestrian position was significant (p < 0.05) in the secondary analysis. In the original analysis, the left pedestrian yielded a mean detection distance of 67.7 m (222 ft) and the right pedestrian a much farther detection distance of 122.8 m (403 ft). The secondary analysis indicated a similar result: left pedestrian at 64.4 m (211 ft) and right pedestrian at 117.1 m (384 ft). Age Main EffectThe secondary analysis also found the main effect of age to be significant (p < 0.05). In both the original and secondary analyses, the post hoc SNK indicated that as age increased, detection distance significantly decreased. These results and both analyses’ means are shown in table 23.
DRIVER’S EYE ILLUMINANCE MEASUREMENTSTable 24 shows secondary analysis ANOVA results of the illuminance at the driver’s eye. The significant results were the same as those for the original analysis for the main effects and the Pedestrian by VES interaction; however, the original analysis’ significant results that could be tied directly to the possible change in the low/wide VES were not significant in the secondary analysis. Specifically, the three-way interaction Pedestrian by VES by Age and the two-way interactions Pedestrian by Age and VES by Age were not significant in this analysis.
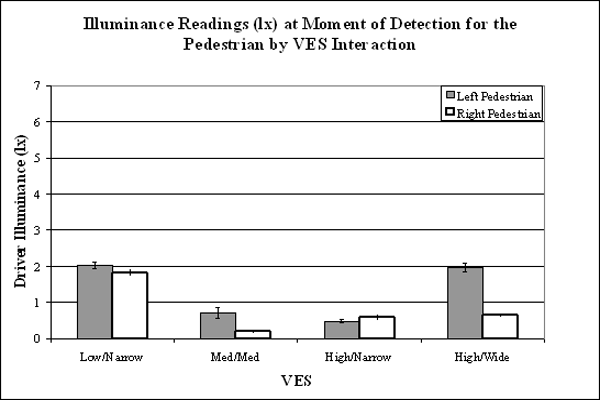
Pedestrian by VES InteractionThe significant interaction of Pedestrian by VES is shown in figure 28. As in the original analysis, the wide-beam VES had the largest illuminance at detection of the left pedestrian, which was also more than three times that of the VES’s illuminance at detection of the right pedestrian. The medium/medium VES also seemed to follow this trend; however, both the narrow-beam VESs had similar illuminances at the point of detection for both the left and right pedestrians.  Figure 28. Bar graph. Mean illuminance readings (lx) at moment of detection for the Pedestrian by VES interaction without the low/wide VES. VES Main EffectThe secondary SNK post hoc test of VES indicated the same three significantly different groupings of driver’s eye illuminance (
Pedestrian Main EffectThe main effect of pedestrian location was also similar between the original analysis and the secondary analysis. Originally, the left-pedestrian location had a mean illumination level at detection of 1.52 lx. The mean illumination level for the right pedestrian was approximately half as great, 0.75 lx. In the secondary analysis, the illumination for the left was 1.30 lx, and for the right it was 0.82 lx. Age Main EffectThe significant main effect of age is shown in table 26. In both the original and secondary analyses, as age increased, illumination at detection increased. However, the original post hoc analysis did not indicate a significant difference between younger and middle-aged drivers whereas the secondary analysis indicated that each age group was statistically different.
|
|||||||||||||||||||||||||||||||||||||||||||||||||||||||||||||||||||||||||||||||||||||||||||||||||||||||||||||||||||||||||||||||||||||||||||||||||||||||||||||||||||||||||||||||||||||||||||||||||||||||||||||||||||||||||||||||||||||||||||||||||||||||||||||||||||||||||||||||||||||||||||||||||||||||||||||||||||||||||||||||||||||||||||||||||||||||||||||||||||||||||||||||||||||||||||||||||||||||||||||||||||||||||||||||||||||||||||||||||||||||||||||||||||||||||||||||||||||||||||||||||||||||||||||||||||||||||||||||||||||||||||||||||||||||||||||||||||||||||||||||||||||||||||||||||||||||||||||||||||||||||||||||||||||||||||||||||||||||||||||||||||||||||||||||||||||||||||||||||||||||||||||||||||||||||||||||||||||||||||||||||||||||||||||||||||||||||||||||||||||||||||||||||||||||||||||||||||||||||||||||