Investigation of Crashes with Animals
There has been a continuing interest in hit-animal crashes for a number of years, both because of the loss of human life and animal life and the damage to property. Crashes between motor vehicles and animals account for a large percentage of the total crashes in many areas. Motor vehicle crashes involving animals have been increasing over the years. Because of the relatively large number of animal-related crashes reported in previous studies, there was a need to quantify the magnitude and severity of animal-related crashes. This analysis was undertaken to define the nature of animal crashes.
State Data Bases Used
The Highway Safety Information System (HSIS) data base was used in this study. All five HSIS States (Illinois, Maine, Minnesota, Utah, and Michigan) were used in the analysis. A review of the variables related to crashes revealed that each of the HSIS States had sufficient information for a meaningful analysis of animal-related crashes. Data for animal crashes reported from 1985 through 1990, inclusive, were used.
Analysis Methods
Animal crashes were defined to include the following crashes:
- Crash type was "collision with animal" or "animal."
- Collision type was "animal on roadway."
- Type of crash (first event) was "motor vehicle/animal (wild)" or "motor vehicle/animal (domestic)."
The resulting extract files contained data on 153,345 animal crashes. Michigan's crash report contains a "special tag" variable that indicates whether the crash was "deer
involved" or "deer associated." For Michigan, almost all of the hit-animal crashes
(99.7 percent) were deer related. Recent data from Minnesota indicates that over 90 percent of all animal crashes involved deer.
The first step of the analysis was to look at the severity of the animal crashes. The second step was to investigate trends over time in the animal crashes. The third step was to compute the average annual animal crash frequencies (crashes per kilometer per year) and crash rates (crashes per million vehicle-kilometers of travel) within each State as a function of area type (urban vs. rural), facility type (two-lane vs. multilane), and average daily traffic (ADT) level. The objective of this analysis was to determine if the rates and/or frequencies of animal crashes are higher for certain types of roads. The fourth step was to investigate whether animal crashes occurred primarily at night. The fifth and final step was an attempt to determine whether the animal crash problem was a localized problem. Specifically, the objective was to answer the following questions:
- Do animal crashes tend to occur in specific locations or cluster at specific points?
- Does a relatively small number of locations account for a relatively large percentage of all animal crashes?
Results
In terms of driver and occupant injury severity, it was found that less than 0.2 percent of all
reported animal collisions resulted in the loss of human life, and approximately 5 percent of all animal crashes resulted in personal injuries. Compared to other types of crashes, driver and occupant injury severity is much lower for animal crashes. Of all reported crashes, about 0.5 percent are fatal and 29 percent are personal injury crashes.
For the trend analysis, investigation of the single-variable tabulation summaries for each HSIS State revealed an increasing trend in the number of animal crashes. For the five HSIS States combined, the number of animal crashes increased from 21,479 in 1985 to 36,332 in 1991. (For this trend analysis, data were available for 1991. The results for other analyses were based on data through 1990.) This represents an increase of 69 percent over a 7-year period. Figure 1 shows the trend in the number of animal crashes. For all HSIS States combined, animal crashes as a percentage of all crashes increased from 4.7 percent in 1985 to 8.2 percent in 1991.
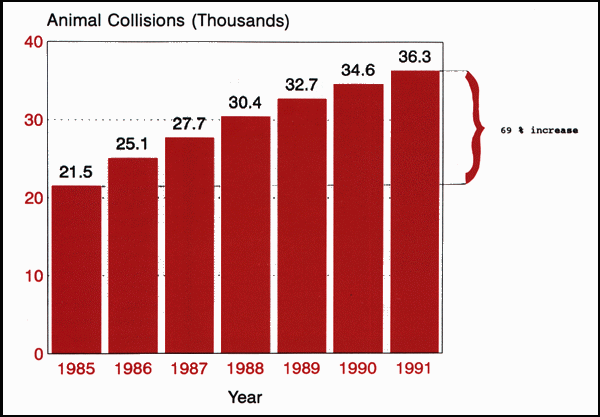
Figure 1. Trend in the number of animal collisions.
Animal collisions expressed as a percentage of all reported crashes were significantly larger for rural roads when compared to urban roads, as shown in Table 1. For all five HSIS States combined, 66 percent of the animal crashes occurred on two-lane rural roads.
| Table 1. Animal collisions, expressed as a percentage of all
reported crashes, by road type. |
| State |
Two-lane
Rural Roads |
Multilane
Rural Roads |
Urban Roads |
| Illinois |
17.8 |
18.9 |
0.3 |
| Maine |
11.7 |
10.0 |
1.4 |
| Michigan |
35.0 |
7.6 |
1.7 |
| Minnesota |
14.0 |
16.0 |
2.4 |
| Utah |
26.5 |
21.7 |
1.3 |
| All States combined |
21.0 |
14.8 |
1.4 |
The average animal crash frequencies for rural roads ranges from 0.07 crashes per kilometer per year for Maine to 1.16 crashes per kilometer per year for Michigan. For urban roads, these frequencies are 0.07 for Maine and 0.71 for Michigan. Figure 2 shows the animal crash rates (crashes per million vehicle kilometers) for rural and urban roads in the five HSIS States. As can be seen, the animal crash rate is substantially higher on two-lane rural roads when compared to urban roads.
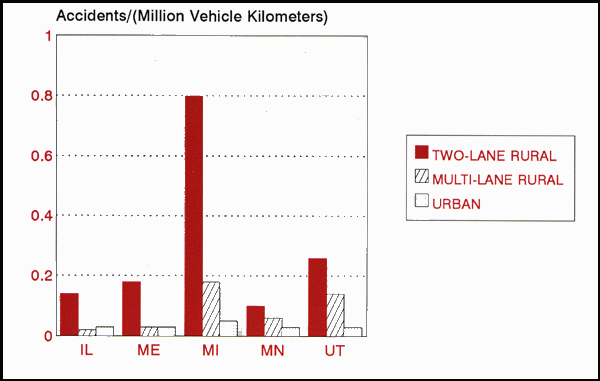
Figure 2. Average animal crash rate by road type.
For the distribution of animal crashes by time of day, the greatest number of animal collisions occur during the early morning hours (4 to 6 a.m.) and the evening hours (6 to 11 p.m.). Figure 3 shows animal collisions by hour of the day for each State.
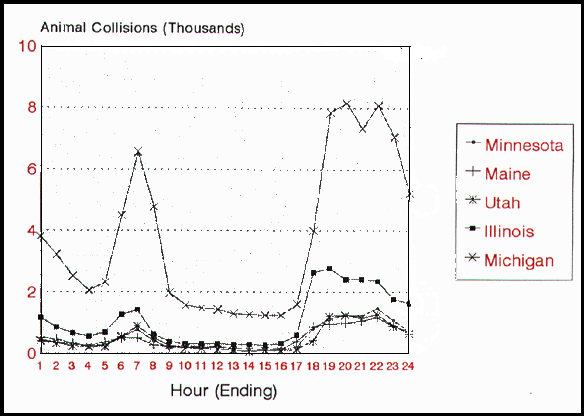
Figure 3. Distribution of animal collision by hour of day.
Animal crashes were found to occur more frequently at night. The percentage that occurred at night ranged from 68 to 85 percent.
To further investigate temporal patterns in animal crashes, an investigation of the month when the crash was reported was undertaken. As indicated in Figure 4, the greatest number of animal crashes by far occurred in November. This is the "mating" season for deer.
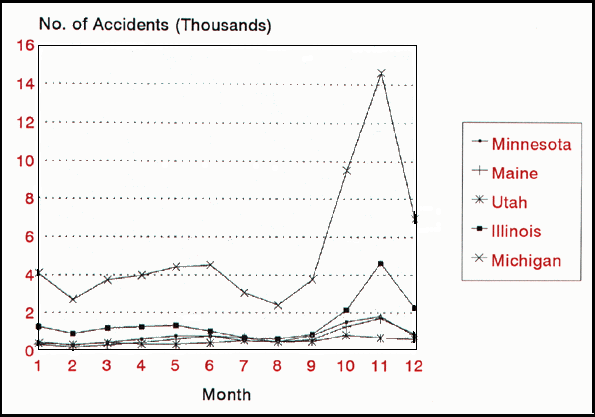
Figure 4. Animal collision distribution by month.
For the location clustering analysis, the decision was made to concentrate on rural roads based on the finding that 74 to 94 percent of the reported animal crashes occurred on rural roads. A "sliding scale" analysis with a 0.5-km window was done for four States (Illinois was excluded due to issues related to their roadway file). The sliding scale program basically "slides" a window of pre-specified length along a route and determines the number of crashes reported within that window. Table 2 shows the distribution of windows by crash frequency. The results of the analysis indicated that over the 6-year period from 1985 through 1990, all States had some animal crash location clusters (i.e., 0.5-km-long sections with a 6-year average of more than one animal crash per year). Michigan had the highest number of animal crash clusters.
| Table 2. Distribution of 0.5 km "windows" by crash frequency. |
| Average Annual Animal Crash Frequency (Acc/Yr) |
| State |
0 |
0.1-1.0 |
1.1-2.0 |
> 2.0 |
| Maine |
143,215 |
18,005 |
18 |
0 |
| Michigan |
15,269 |
47,423 |
8,784 |
1,990 |
| Minnesota |
91,314 |
18,384 |
156 |
8 |
| Utah |
94,925 |
16,509 |
389 |
65 |
On the basis of the findings of this study, the following conclusions can be made:
- Animal crashes, both in terms of total numbers and as a percentage of all reported crashes, have steadily increased.
- Animal crashes tend to occur more frequently in rural areas.
- November has substantially more animal crashes than any other month.
- Animal crashes occur more frequently at night.
- In terms of time of day, the greatest number of animal crashes occur in the early morning hours (between 4 to 6 a.m.) and the evening hours (between 6 and 11 p.m.).
- Using a "sliding scale" approach, animal crash clusters (0.5-km-long sections with an average of more than one reported animal crash per year) were identified in each of the States.
Study Implications
The availability of the HSIS crash data allowed for a multi-State analysis of animal-related
crashes. The results suggest that animal crashes may pose a much larger problem in some States than in others. For three of the HSIS States, it appears that animal crashes do not randomly occur
on all roads throughout the rural areas. However, for Michigan, the animal crashes occur on a significantly higher percentage of rural roads, indicating that the problem of hit-deer crashes is
widespread in Michigan. Traditionally, static deer warning signs have been the only countermeasure available to the traffic engineer. Despite the prolific use of these signs, deer accidents continue to increase. Studies of the effectiveness of other countermeasures, such as wildlife warning reflectors and mirrors to reflect the headlights of oncoming automobiles off to the side of the road to "freeze" nearby deer, have reported mixed results. Even though the severity of animal crashes is low, they represent a substantial percentage of all crashes on rural roads, and the trend is increasing. Based on the results of this study, it is recommended that: (1) policies for the installation of deer warning signs be reviewed to restrict their use to locations with significant deer crash problems, (2) further investigation of the effectiveness of
warning reflectors should be conducted, and (3) the development of rural IVHS applications (either roadside or vehicle-based) should include consideration of animal-related crashes.
For More Information
This research was conducted by Mr. Warren E. Hughes (Bellomo-McGee, Inc.), and Dr. Reza Saremi (LENDIS Corp.) as part of the HSIS contract. For more information, contact Jeffrey F. Paniati, HSIS Program Manager, HSR-20, (703) 285-2057.
|

