U.S. Department of Transportation
Federal Highway Administration
1200 New Jersey Avenue, SE
Washington, DC 20590
202-366-4000
Federal Highway Administration Research and Technology
Coordinating, Developing, and Delivering Highway Transportation Innovations
 |
| This report is an archived publication and may contain dated technical, contact, and link information |
|
Publication Number: FHWA-HRT-05-080
Date: May 2006 |
Pedestrian Access to Roundabouts: Assessment of Motorists' Yielding to Visually Impaired Pedestrians and Potential Treatments to Improve AccessPDF Version (1.14 MB) PDF files can be viewed with the Acrobat® Reader®
CHAPTER 3. STUDY 2: FIELD EVALUATIONIn study 1, the drivers followed a script and were instructed to stop at the crosswalk, which they did. To ensure that there would be crossing opportunities; both lanes were blocked at some point in 16 of the 18 trials. In study 2, the drivers were untrained and presumably unaware that they were participating in a research study. The pedestrian participants were five of the seven participants from study 1. Thus, the pedestrians had been exposed previously to the sound strips, were aware of their purpose, and had been briefed on the layout of the strips from the previous study. Because a thorough evaluation of the sound strips required that vehicles yield, and because the literature suggested that yielding might be rare, a yield sign was placed in the street between the lanes at the edge of the cross walk. In exploratory visits to the roundabout, it was observed that vehicles yielded well upstream of the crosswalk; therefore, the yield sign was supplemented with a sign that indicated where to yield (see figure 3).
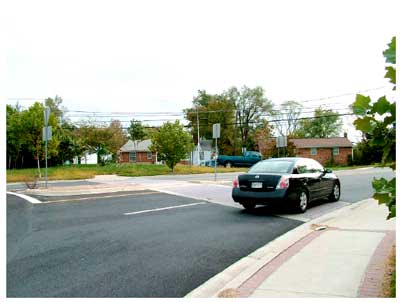
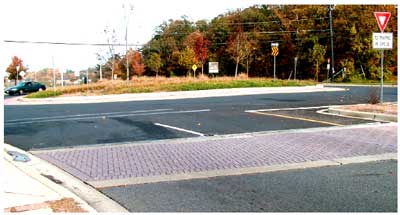
METHODThe research design included one control and one experimental condition. All control observations were made before the experimental observations. Data collection took place in fall 2004. Control observations were made between 5 p.m. and 6:30 p.m. in the 2 weeks that preceded the end of daylight savings time. Treatment observations were made between 3:30 p.m. and 5 p.m. during the 2 weeks that followed the switch to standard time. Traffic counts taken in spring 2004 showed that the traffic volume at the exit peaked at 5 p.m. at a rate of about 800 vehicles per hour, and that the volume was symmetrically distributed about the peak. Because of the switch from daylight savings time to standard time, lighting conditions were approximately the same for the baseline and treatment conditions. Because all data were collected at the same roundabout, and since an adjacent commuter rail station generated traffic, it was likely that most of the drivers traversed the same exit daily at approximately the same time. By shifting the data collection time between the control and treatment conditions, an attempt was made to maximize the probability of observing different drivers from the same population. Because there were 10 days of testing (5 in each condition), some drivers were observed more than once. The trials averaged 1.5 minutes in length, and there was an average of 15 trials per day. Thus, over the 90-minute test interval, the participant and the mobility specialist were only at the crossing for about 23 minutes. It is estimated that on any given test day, a daily roundabout user had about a one-infour chance of participating. The roundabout exit in the control condition is shown in figure 7. Figure 8 shows the exit after the installation of the sound strips and the mount for the street sign. As in study 1, one sound strip was placed at the upstream edge of the crosswalk and extended across the road approximately 10.7 m (35 ft). The second and third strips were placed parallel to the first, 6.1 m (20 ft) and 7.3 m (24 ft) upstream, respectively. The street sign was bolted to the pavement on the lane marking at the upstream edge of the crosswalk. The sign mount can be seen in figure 8 as the opening in the pavement where the center white line meets the crosswalk.
Three video cameras were mounted atop an 8.5-m (28-ft) mast. The mast was located on a knoll on the side of the street opposite the exit of interest and about 15 m (49 ft) downstream from the exit crosswalk. One camera was used to videotape the participants, the certified orientation and mobility specialist, the crosswalk, and the vehicles approaching the exit. This camera was the only one used to capture the data reported here. A second camera was used to videotape traffic in the circular roadway, and a third camera filmed traffic that approached the roundabout entry adjacent to the exit. Before data collection began, the certified orientation and mobility specialist crossed with the participants several times so that the participants could familiarize themselves with the roundabout layout and traffic sounds. Although she was not visually impaired, the certified orientation and mobility specialist carried a long white cane and wore sunglasses. Every participant had either a long white cane or a guide dog. Before each trial, the participant and certified orientation and mobility specialist waited on the sidewalk approach to the exit crosswalk. When no vehicles were within about 15 m (49 ft), they stepped to the edge of the crosswalk ramp, and the certified orientation and mobility specialist began tapping her long white cane in the street at a rate of one tap per second. The red-tipped end of the cane traveled about 1 m (3.3 ft) vertically with each tap. The certified orientation and mobility specialist stood with one foot over the curb edge, in the gutter, so that she was technically in the crosswalk. The participant stood completely on the sidewalk to the left and upstream of the certified orientation and mobility specialist. The tapping of the cane signaled the beginning of a trial. A trial ended when one of the following events occurred:
In most cases, the certified orientation and mobility specialist and the participant made a crossing at the end of a trial. Although a crossing was not required for data collection, a crossing was performed to avoid confusing drivers who had clearly yielded or to reward those who had stopped to help. In a few cases, the certified orientation and mobility specialist and the participant stepped away from the crossing and waved on any drivers who might have stopped or slowed. Rest periods between trials varied from several seconds to several minutes; however, new trials were never started until all drivers who might have seen the end of the preceding trial had departed. This precaution was important because vehicles making a right turn into the exit sometimes formed long queues at the adjacent exit and were in a position to see the end of the preceding trial, albeit from some distance. Participants carried a wireless microphone so that their verbal responses could be recorded on the video recorder. Participants were instructed to indicate verbally when vehicles were stopped and when both lanes were blocked. Unlike the previous experiment, they were not asked to indicate the lane in which vehicles stopped. However, participants were instructed to indicate when stopped vehicles departed. RESULTSAcross all participants, 151 trials were observed (65 in the control condition and 86 in the treatment condition). As shown in table 3, during these trials, 1,944 vehicles approached the observed crosswalk. Most of those vehicles (1,671) passed the crosswalk without stopping. Only 273 vehicles (14 percent) stopped, even if only momentarily, before passing the crosswalk. In the control condition, 11.5 percent of the vehicles stopped. In the treatment condition, 16.7 percent of the vehicles stopped. The results were consistent with the hypothesis that the "YIELD TO PEDESTRIAN" sign that was placed between the lanes induced a greater proportion of the drivers to stop (?2 = 24.4, p < 0.0001). Table 3. Drivers' responses to the presence of visually impaired pedestrians in the crosswalk.
Table 4 shows in which lanes vehicles were stopped. The far lane category includes some vehicles that may have been straddling the two lanes. As reported elsewhere, drivers who are traveling straight through a roundabout tend to take the shortest path, which results in drivers who enter and exit in the near lane shifting to the far lane as they travel through the circular part of the roadway.(18) Some of the drivers in this study stopped within the circular roadway. Thus, some of the drivers who were classified as having stopping in the far lane may have been on a path that would have placed them in the near lane when they eventually reached the crosswalk. Table 4 Lateral position of vehicles that stopped for pedestrians.
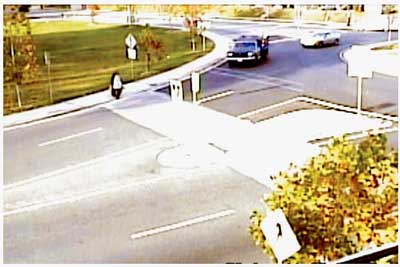
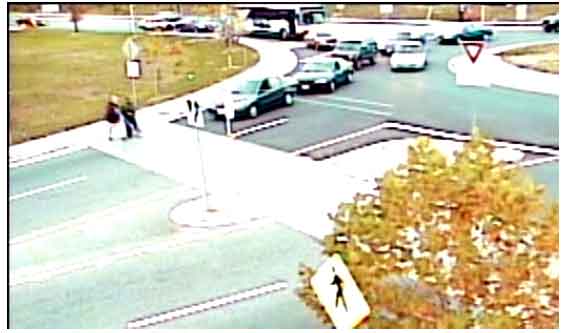
Although the sign placed between the lanes resulted in a small but statistically reliable increase in yield compliance, the nature of the compliance was less than optimal for the effectiveness of the pavement sound-strip treatment. Figure 9 shows the longitudinal distance from the crosswalk to the front of vehicles that stopped in the near lane. Dotted lines in the figure represent the distance of the sound strips from the crosswalk. It can be seen that the majority of the vehicles in the near lane did not fully traverse the strips. Figure 10 shows a video capture of two vehicles that stopped well upstream of the crosswalk and, thus, did not cross the sound strips. Vehicles that stopped 6 m (19.7 ft) from the crosswalk would have crossed the farthest upstream strip with their front axle. Their rear axle would not have crossed either of the upstream sound strips. Only drivers that stopped within 3 m (9.8 ft) of the crosswalk likely would have triggered sounds from both upstream strips with both their front and rear axles. Thus, only 24 of the 194 vehicles that stopped in the near lane were likely to have generated the desired sound pattern. In the near lane, the stopping distance from the crosswalk did not vary significantly with treatment (p > 0.10). However, the vehicles that stopped in the far lane stopped farther from the crosswalk in the treatment condition than in the control condition (t (77) = 3.4, p < 0.01). Figure 11 shows the distribution of stopping distances for the far lane in the control and treatment conditions. The in-street and roadside signs appear to have induced more motorists to stop, but these signs were not effective in inducing motorists to stop closer to the crosswalk. Given that the majority of the yielding vehicles did not cross over the upstream strips before stopping, and that very few vehicles passed over the pair of strips with both axles, the effectiveness of the sound strips in cuing the visually impaired pedestrians to the presence of yielding vehicles clearly was compromised.
Table 5 shows the outcome of the 151 trials. Five of the seven participants in study 1 returned to take part in study 2. Individuals retained the same participant number assigned from study 1.
Table 5 includes an outcome not anticipated in the research plan-many trials ended when a passing pedestrian or motorist stopped to assist the pedestrians in crossing (act of a Good Samaritan). These were labeled "Good Sam Crossings." A crossing was given this designation when: (1) a pedestrian stopped to provide assistance, (2) a driver got out of his/her car to provide assistance, (3) a driver engaged in some overt behavior to influence other drivers to stop, or (4) a driver interacted with the pedestrians in a way that disrupted their ability to listen for other traffic. Each day during the study, at least one passing pedestrian stopped to offer assistance. In some cases, they were told that an experiment was being conducted and assistance was not needed. In other cases, it was not practical to explain the situation; such was the case when a pedestrian stepped into the street and flagged down traffic. Drivers, too, often stopped to offer crossing assistance. Other drivers maneuvered their vehicles across the traffic lanes to form a barricade, as did several transit bus drivers. Still other drivers rolled down their windows and shouted that it was safe to cross. The "Time Out" category included two different outcomes: (1) 3 minutes passed without two vehicles blocking the lanes, or (2) the certified orientation and mobility specialist determined that individual vehicles or traffic were excessively delayed. The latter occurred when a vehicle or series of vehicles yielded in the near lane, but no vehicles would yield in the far lane. The remaining categories are similar to those used in study 1. A correct identification was scored when vehicles blocked each of the lanes and the participant indicated that this was the case. Unlike the closed-course study, it was rare for two vehicles to stop side-by-side in the roundabout exit. In most cases, both lanes were considered blocked if vehicles stopped in such a way that it would be difficult for subsequent vehicles to maneuver into the roundabout exit. Figure 12 shows a video image of a treatment-condition crossing in which the participant correctly identified that both lanes were blocked. In this image, the vehicle blocking the left lane stopped about 12 m (39.4 ft) upstream of the crosswalk.
A false alarm was scored when the participant indicated that both lanes were blocked when, in fact, only one lane was blocked. A miss was scored when both lanes were blocked for 10 s, but the participant failed to indicate that both lanes were blocked. The proportion of the trials in each category differed significantly between the control and treatment conditions (X2 (4) = 34.3, p < 0.0001). However, it is unlikely that these differences are because of the treatment, since most yielding vehicles were not producing the desired sound cues by running over the sound strips. Practice, or a shift in response criteria, is a more likely cause to explain the performance differences. In any case, the observed changes were not in the predicted direction. Although 16.7 percent of the vehicles in the treatment condition stopped for the pedestrians, most of these stops were not useful and did not result in a detected crossing opportunity. There are several possible reasons for this. One is that the pedestrians did not immediately respond when the drivers stopped. Figure 13 shows the distribution of the delays between the time both lanes were blocked by fully stopped vehicles and the time when participants indicated that the lanes were blocked. One unexpected finding was that in three cases, participants identified the blocked lanes 2 s before both vehicles came to a complete stop. This apparent anomaly may have been attributed to participants shifting from the strategy that they normally use to detect stopped vehicles (idling engines) to listening for silence after detecting approaching vehicles. This strategy worked when there was no traffic approaching the opposing entrance and when all traffic in the circle stopped. Note that in figures 10 and 12, both of which show correct detections, there were no vehicles entering the roundabout from the opposing direction. Detection times in study 2 were comparable to the detection times found in study 1.
When pedestrians did not begin to cross immediately, drivers sometimes moved on. To estimate how long drivers may wait, the amount of time that stopped drivers waited was tabulated. If the pedestrians crossed or stepped away from the curb, then the amount of time drivers waited was not included. This procedure yielded delay times for 28 drivers in the control condition and 56 drivers in the treatment condition. A histogram of the wait times is provided in figure 14. In the control condition, drivers waited an average of 10.8 s. In the treatment condition, drivers waited an average of 4.7 s. In the control condition, wait times varied between 1 and 25 s. In the treatment condition, wait times varied between 1 and 20 s. The difference in wait times, not assuming equal variances between groups, was statistically reliable (t (39) = 5.1, p < 0.01). The difference in willingness to wait may have been because drivers who were induced to stop by the yield sign were not as committed to waiting as were drivers who stopped without the added inducement. If this hypothesis is correct, then the benefit for visually impaired pedestrians of yield signs is diminished. The bulk of the drivers who are influenced by the sign appear to be willing to wait only 3 to 6 s. Thus, these drivers may be pulling away just as the pedestrian with visual impairment begins to cross.
The goal of the sound-strip treatment was to improve the detection of stopped vehicles. One question that could be asked is: If detection were immediate and perfect, how long would the visually impaired pedestrian have to wait? To provide an estimate of the amount of delay before both lanes were blocked, 74 trials were identified that did not end in a time out before the first double yield occurred or a Good Samaritan intervened. It can be seen in table 6 that the mean time before both lanes were blocked was 63 s. The longest wait observed was 245 s. The 15th percentile wait was 16 s, and the 85th percentile wait was 125 s. Thus, even with the low yielding rates of 11 to 16 percent that were observed in this study, wait times for a double yield are comparable to wait times at signalized intersections. Table 6. Average wait time before the first double yield.
DISSCUSIONOne purpose of study 2 was to evaluate the effectiveness of an audible pavement treatment to assist pedestrians with visual impairment in detecting the presence of stopped vehicles at a double-lane roundabout exit. The treatment applied in the current study did not appear to be effective. The majority of the vehicles that stopped for the pedestrians stopped before crossing the treated area, and thus did not produce the intended sound cue. The same pavement treatment was used in study 1. In that study, performance was markedly improved by the treatment, even if it was not completely satisfactory. That study assumed that drivers would stop close to the crosswalk; however, in the field that assumption proved to be wrong. Drivers not only saw pedestrians long before they reached the roundabout crosswalk, they also frequently stopped before they entered the exit. This finding should be encouraging to those who are concerned about pedestrian conspicuity at roundabout exits. If drivers stop in the circular roadway (as was frequently observed in this study), then roundabout operations will be compromised both for motorists and visually impaired pedestrians. Moving crosswalks two car lengths away from the inscribed circle instead of the one car length, as seen at this particular roundabout, may improve vehicle operations. It is unclear that this would help visually impaired pedestrians detect yielding vehicles if drivers continue to stop one to three car lengths back from the crosswalk. For a pavement cuing system to work, vehicle behavior must be more consistent than it was in this study. The "YIELD HERE" sign used in this study did not appear to be effective in increasing consistency. Although fewer than 15 percent of the drivers came to a complete stop for the pedestrians, it should not be assumed that the remaining 85 percent of the drivers did not see or respond to the pedestrians. There were several indications that most drivers were aware of the pedestrians–many drivers slowed, but did not come to a complete stop. The number of drivers who slowed is difficult to quantify because it would require knowing how fast they would have traveled if the pedestrians were not present. It appeared that most drivers attempted to engage in a nonverbal exchange with the pedestrians. In that attempted exchange, drivers signaled that they would yield if the pedestrians moved forward in response to their slowing. Apparently, the drivers did not perceive that people carrying long white canes or using guide dogs might not have access to this type of nonverbal exchange. Other drivers appeared to be unwilling to stop. Some honked as they accelerated past the crosswalk. Other drivers visibly altered their path to move farther away from the pedestrians. This last behavior was not unique to drivers who did not stop. A few drivers who stopped in the near lane proceeded to move on by merging into the far lane. In the treatment condition, this lane change required sharp maneuvers to avoid striking the yield sign. Another purpose of study 2 was to evaluate the effectiveness of an in-street "YIELD TO PEDESTRIAN" sign. Although a statistically significant increase in stopping was obtained, the increase was probably too small to have practical significance. Furthermore, it appears that drivers induced to stop by the sign are less patient than those who would stop regardless of the sign. Because visually impaired pedestrians take more time to leave the curb than sighted pedestrians, they are not likely to benefit from a small increase in brief stops. The size of the increase in yielding in this study was similar to those obtained in previous studies.(10,11) Those studies also show that motorist response varies from site to site, both in overall yielding rates and in response to the in-street sign; therefore, the reader is cautioned against overgeneralizing from the current findings. The final objective of this study was to quantify motorists' yielding behavior. In the absence of a treatment, 11 percent of the vehicles came to a full stop for two visually impaired pedestrians at the crosswalk threshold. Many more motorists slowed, and perhaps were willing to stop if the pedestrians had moved toward their path or taken more aggressive measures to take control of the crosswalk. Even with the low rate of yields, wait time for a double yield (see table 6) averaged only a minute. Thus, if a reliable sound cue were available so that visually impaired pedestrians could act immediately when two vehicles yield, then delay imposed by roundabout crosswalks would compare well with the delay imposed by traffic signals. An unexpected finding was the proportion of trials in which pedestrians or motorists intervened to assist the visually impaired pedestrians. Although this level of altruism is encouraging, it would be better if the assistance were more effective. Some of the assistance greatly increased the risk to both the pedestrians and the motorists. For instance, some of the drivers who stopped to shout out that it was okay to cross did not monitor other traffic and did not warn the pedestrians that cars were continuing to go through the exit. When a transit bus attempted to blockade the exit, two vehicles accelerated around the bus and drove briskly through the crosswalk even though the bus obstructed these drivers' sight line to the pedestrians. Some pedestrians who stood in the crosswalk and signaled vehicles to yield watched the visually impaired pedestrians cross and turned their back to oncoming vehicles. Thus, we cannot recommend reliance on passersby to resolve accessibility challenges to the visually impaired.
FHWA-HRT-05-080 |