Lesson 4: Bicycle and Pedestrian Planning
Lesson Outline
- Federal surface transportation law and pedestrian and bicycle facilities.
- Elements of State and local pedestrian and bicycle plans.
- Bicycle and pedestrian models: demand and facility quality.
- Bicycle and pedestrian maps.
Federal Requirements
- ISTEA (1991) and subsequent legislation.
- States and MPOs are required to address bicycle and pedestrian needs during the planning process.
Federal Planning Guidance
- FHWA and FTA technical guidance for State and MPO pedestrian and bicycle plans:
| – Incorporate public involvement. |
| – Assess current conditions and needs. |
| – Include vision statement, goals, policy statements, specific programs and projects, and performance criteria. |
| – Identify financial resources needed for implementation. |
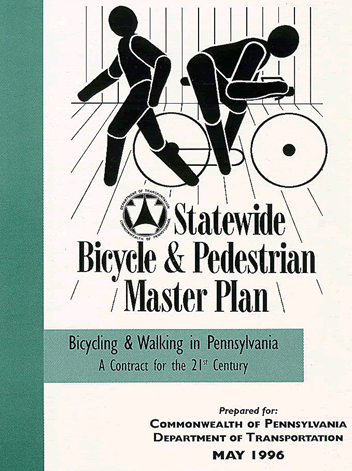
State Plans
- Outreach to regional and local jurisdictions.
- Identification of policies and legal barriers.
- Development of planning and design guidelines for local governments.
- Coordination among State agencies.
|
|
Regional/MPO Plans
- Establish regional priorities for funding.
- Develop planning and design guidelines for local governments.
- Develop unified approach to land use and bicycle and pedestrian transportation across region.
- Provide continuous connections across jurisdiction boundaries.
Common Elements of Local Pedestrian and Bicycle Plans
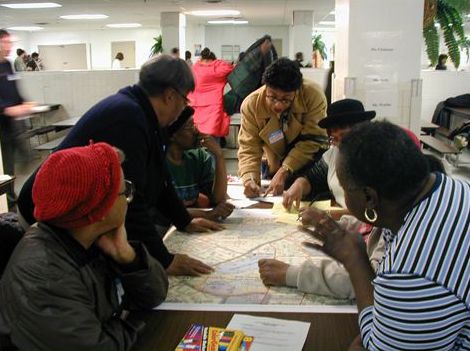
- Gaining public involvement.
- Using geographic information systems (GIS).
- Reviewing transportation and land use policies/regulations.
- Establishing facility design procedures.
- Identifying and prioritizing where improvements are needed.
|

|
Forecasting Travel Demand
- Determine the relative demand for pedestrian and bicycle travel on a facility.
- Estimate the number of pedestrians and/or bicyclists to use the facility if built.
- Sketch planning techniques.
Assessing Pedestrian and Bicycle Suitability
- Models are based on real-time human perception.
- Models evaluate the comfort of bicyclists and pedestrians in a roadside environment.
- Conditions are rated on an A–F grade scale based on factors such as speed limit, traffic volume, lane and shoulder width, pavement condition, etc.
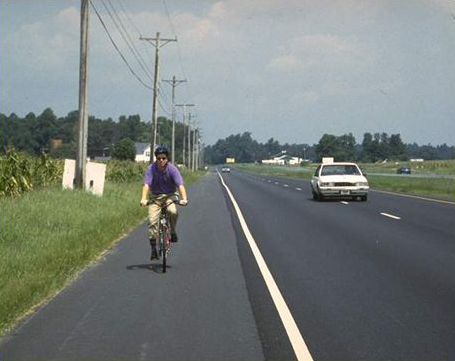
Bicycle Level of Service A
|
- 2.7-m (9-ft) shoulder.
- 4-m (12.5-ft) lane.
- 88 km/h (55-mi/h) speed limit.
- 4 lanes, undivided.
- 8,000 average daily traffic (ADT).
- 3% trucks.
|
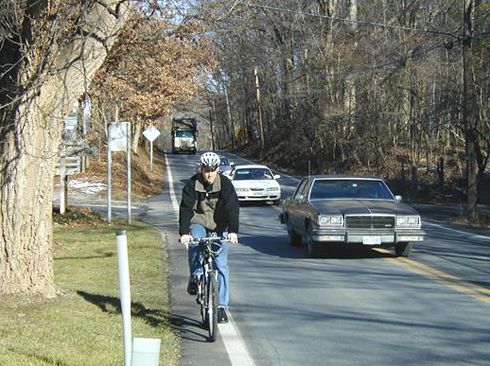
Bicycle Level of Service E
|
- 0.3-m (1-ft) shoulder.
- 4-m (12.5-ft) lane.
- 80 km/h (50 mi/h) speed limit.
- 2 lanes, undivided.
- 8,000 ADT.
- 7% trucks.
|
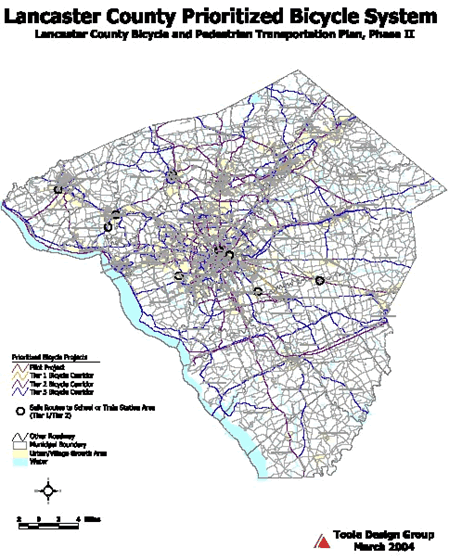
Types of Maps
- Urban bicycle map.
- Bicycling guide.
- Bicycling touring guide.
- City and county bicycle and pedestrian plan maps.
|
|
Lesson Summary
- Current Federal transportation laws support pedestrian and bicycle planning.
- There are similarities and differences between State, regional, and local plans.
- Methods have been developed to assess pedestrian and bicycle demand and facility quality.
- There are several types of maps that aid in pedestrian and bicycle planning processes.
FHWA-HRT-05-092
|


