U.S. Department of Transportation
Federal Highway Administration
1200 New Jersey Avenue, SE
Washington, DC 20590
202-366-4000
Federal Highway Administration Research and Technology
Coordinating, Developing, and Delivering Highway Transportation Innovations
 |
| This report is an archived publication and may contain dated technical, contact, and link information |
|
Publication Number: FHWA-HRT-05-137
Date: July 2006 |
Evaluation of Safety, Design, and Operation of Shared-Use PathsFinal ReportPDF Version (1172 KB) PDF files can be viewed with the Acrobat® Reader®
CHAPTER 2. LITERATURE REVIEWINTRODUCTIONThis chapter provides a thorough, critical review of the major, relevant research to date on the topic of LOS estimation for shared-use paths. The chapter contains sections on path user characteristics, ways to measure the quality of the performance of the shared path for the users, and ways to establish an LOS scale. The review will indicate why path designers and others needed a research project on this topic, and will show which directions the project had to take. Much of the material in this document is from previous recent work by members of the project team for the FHWA, including Rouphail, et al., (10) and Allen, et al. (11) The document also includes results from searches of computerized indexes and manual searches by the project team of available library resources.
PATH USER CHARACTERISTICSThere is a wide variety of users within the pedestrian population and, therefore, a large variety of needs within this population that have to be addressed by path designers. One can classify pedestrians by gender, age, or trip purpose, among other typologies. In addition, disabled pedestrians have unique requirements that the profession must address in order to adequately serve this group. Gender is an important factor where pedestrians are concerned. Fruin notes that despite the consistency in walking gait across both sexes and all ages, differences in other aspects of pedestrian walking and standing exist among these groups. (12) For example, adult male pedestrians consume more area than their female counterparts, and female pedestrians exhibit a higher level of pelvic rotation for a given length of stride. Polis, et al., observed differences in walking speeds between male and female pedestrians in Israel. (13) The authors attributed this primarily to the typically greater physical size and stride of males; they also noted a second hypothesis–that a greater number of males than females were walking to and from work in Israel. Another dividing factor is age. Aging reduces the length of the stride of a pedestrian and results in a commensurate reduction in walking speed. (12) Very young pedestrians will also walk at a slower gait than other groups. (14) There may also be differences between pedestrians of different ages, including perception, reaction time, and risk-taking, which are important considerations in evaluating passing, although there has been limited attention paid to these aspects in the pedestrian literature. Knoblauch, et al., note that the current traffic environment is "not well adapted to the needs of the older pedestrian" and reports that older pedestrians have the highest pedestrian fatality rate of any age group.(15) With decreases in visual acuity accelerating after age 60, and with reductions in walking speeds prevalent among the elderly, the transportation professional faces unique challenges in attempting to service this segment of the population. One can also divide pedestrians into groups by trip purpose. Commuting pedestrians exhibit higher pedestrian speeds than do shoppers.(16) By stopping to window-shop, the latter group also consumes more of the walkway width.(16) Students exhibit different characteristics than other groups.(17) Impaired users are a critical concern for the designers of pedestrian facilities. In a recent report for FHWA, Kirschbaum, et al.,(18) describe many different types of users who the designers of pedestrian facilities should consider, including:
Kirschbaum, et al., cite Census Bureau statistics from 1994 that "approximately 20 percent of Americans have a disability and the percentage of people with disabilities is increasing." (18) In terms of pedestrian space requirements, designers of pedestrian facilities (considering only unimpaired pedestrians) use body depth and shoulder breadth, at least implicitly, for minimum space standards. In addition, pedestrians require a certain minimum space for comfort. Fruin described these concepts as the "body ellipse" and the "body buffer zone." (12) All recent editions of the HCM applied the concepts of pedestrian space as a measure of effectiveness with regard to pedestrian facility analysis procedures. (See references 2, 4, 14, and 19.) As noted by Tanaboriboon and Guyano, cultural attitudes and prevailing pedestrian characteristics may affect space requirements.(20) For example, they note that Asians are typically smaller than Westerners, and that Asian pedestrians require less personal space than Americans. Fruin notes that the average adult male body occupies an area of about 0.14 square meters (m2) (1.5 square feet (ft2)). (12) Given the existence of body sway in both idle and moving persons, as well as the typical preference to avoid contact with others, Fruin presents the concept of a 45.7-centimeter (cm) by 61.0-cm (18-inch by 24-inch) body ellipse, with a total area of 0.279 m2 (3 ft2), as the practical minimum standing area. Davis and Braaksma use a similar body ellipse of 46.0 cm by 61.0 cm (18 inches by 24 inches) in their study of Canadian transportation terminals.(21) Pushkarev and Zupan note that pedestrians can occupy as little as 0.09 m2 (0.97 ft2) per woman and 0.14 m2 (1.50 ft2) per man, but require about 0.22 to 0.26 m2 (2.4 to 2.8 ft2) per person to avoid touching, and prefer a body buffer zone of 0.27 to 0.84 m2 (2.9 to 9.0 ft2) to avoid "emotional discomfort in the presence of strangers." Flow involving "unnatural shuffling" begins when space falls below 0.75 m2 (8.1 ft2).(22) Navin and Wheeler(23) state that an individual's "domain" (clear space around the individual) could be defined by a parabolic curve with its apex about 0.75 m (2.4 ft) in front of the pedestrian and the edges about 0.40 m (1.3 ft) to the pedestrian's sides. There is little information in the technical literature on joggers on shared-use paths. Most of the recreational literature on joggers relates to optimizing performance rather than characterizing typical joggers. There are estimated to be more than 100 million bicyclists in the United States; however, less than 1 percent of travel trips are made by bicycling in this country.(24) According to one source, there are three general categories of bicycle users: (1) the child bicyclist, (2) the casual or inexperienced adult bicyclist, and (3) the experienced adult bicyclist.(25) A report released by FHWA divides bicyclists into three similar categories: (1) Group A: Advanced Bicyclists, (2) Group B: Basic Bicyclists, and (3) Group C: Children.(26)The behavior and attributes of these three groups differ; however, most bicycle facilities cater to all three types of bicyclists. The child bicyclist (group C) is defined as a bicyclist who is too young to obtain a motor vehicle operator's license (age 16 in most States). Approximately three-quarters of all children under age 16 ride bicycles, and this group makes up a little less than half of all bicyclists.(25) A high percentage of children are forced to ride bicycles because they have no other transportation alternatives. This group tends to prefer residential streets with low motor vehicle speed limits and volumes, well-defined bicycle lanes on arterials and collectors, and/or separate bicycle paths. The casual or inexperienced adult bicyclist (group B) is defined as someone who is old enough to possess a motor vehicle operator's license, is moderately skilled, and has a basic, but not extensive, knowledge of bicycling. For this group, bicycling is mostly a recreational activity that is done on residential streets and bicycle paths. However, this group occasionally will make purposeful trips and/or use major streets. It is estimated that this group makes up approximately 40 percent of the overall bicycling population.(25) The experienced or advanced adult bicyclist (group A) is defined as an experienced, knowledgeable, and skilled bicyclist who is old enough to possess a motor vehicle operator's license. This group tends to use the bicycle for longer trips and more often for purposeful trips than the casual adult bicyclist. It is estimated that this group makes up approximately 10 percent of the overall bicycling population.(25) This group normally prefers to use the most direct route to its destination, and riders are willing to use a variety of different types of streets with or without designated bicycle facilities. FHWA reports that more than 50 percent of bicycle trips in the United States are taken for social/recreational purposes.(24) The other trip categories were personal or family business, school and church, work, and "other" trips. Bicycle trips are often divided into just two categories for operational analysis: (1) recreational trips and (2) purposeful trips. Purposeful trips include all categories other than social/recreational. The fact that more than half of all bicycling trips may be recreational must be considered when analyzing bicycle traffic, because the same is generally not true for motor vehicles. Hunter, et al., conducted a study in several U.S. cities and found that bicycle traffic volumes between the hours of 7 a.m. and 7 p.m. on weekdays were fairly constant, with peak-hour volumes being approximately 1 1/3 times the average hourly volumes.(27) They also found that the peak hours on weekdays typically corresponded with local commuter schedules. In one city, they measured peak-hour volumes as 10 to 15 percent of total daily volume. The proportion of weekday to weekend traffic varied greatly, depending on the recreational uses of the bicycle facilities. Seasonally, they found that volumes were generally highest in the summer and lowest in the winter. A study conducted in the Seattle area by Niemeier analyzed bicycle volume data collected over 1 year at five separate locations.(28)The study showed that bicycle volumes were higher during the p.m. peak than during the morning peak at all but one location, which was slightly lower. Three of the locations had more than double the volume during the p.m. peak. Bicycle peak-hour factors (PHFs) between 0.52 and 0.82 were observed during the morning peaks at the various locations, and PHFs between 0.58 and 0.80 were observed during the p.m. peaks. The study showed significant variability in volumes over the year. This variability suggested that a single volume count could be biased by as much as ±15 percent, depending on the time of year that the count was taken. Volumes were much lower during adverse weather because bicyclists are exposed to the elements. Because of the recreational and social nature of bicycling, bicycle users often ride in pairs. A study found that in The Netherlands, the number of paired bicycles was a function of bicycle volume.(5) However, the dependence differed with location. As expected, the study also found that paired riding was more common during recreational bicycle trips than purposeful trips. The fact that bicycle users often ride in pairs has been noted by others; however, no other attempt has been made to quantify this phenomenon. Other than the bicyclists, the bicycle itself has known properties that have to be taken into account. With regard to space requirements, a typical bicycle in the United States is 1.75 m (5.75 ft) in length, with a handlebar width of 0.60 m (2 ft).(25) In The Netherlands, it has been reported that 95 percent of bicycles are less than 1.90 m (6.25 ft) in length and that 100 percent of bicycle handlebar widths are less than 0.75 m (2.5 ft). In addition, a bicyclist needs a certain amount of operating space. No bicyclist, at any speed, can ride a bicycle in a perfectly straight line. One U.S. source reports that a typical bicycle needs between 0.75 m (2.5 ft) and 1.40 m (4.5 ft) of width in which to operate.(25) This amount of space can also be referred to as the effective lane width for a bicycle. An older study in Davis, CA, recommends a minimum width of 1.28 m (4.2 ft) for bicycles, with additional width at higher volumes.(29)In The Netherlands, 1.00 m (3.3 ft) of clear space is generally recommended for bicycles.(30) In Germany, 1.00 m (3.3 ft) is reported as the normal width of one bicycle lane.(31) In Sweden, 1.20 m (3.95 ft) is reported as a typical bicycle lane width.(32) A Chinese study reports that the width of a two-lane bicycle path in China is generally 2.5 m (8.2 ft), with an additional 1.0 m (3.3 ft) added for each additional lane.(33) The Norwegian Public Roads Administration states, "One meter is not enough," and recommends a width of 1.6 m (5.3 ft) for single-lane bicycle lanes.(34) Overall space requirements for bicycles can also be defined in terms of density. A Canadian study found that bicycle operating space greater than 9.3 m2/bicycle (100.1 ft 2/bicycle) provided for free-flow bicycling conditions.(35) The study also found that when less than 3.0 m2/bicycle (32.3 ft2/bicycle) of operating space is provided, there was no freedom for bicycles to maneuver. A study in China(33) found that bicycle operating space greater than 10 m2/bicycle (107.6 ft2/bicycle) provided very comfortable operations, and that less than 2.2 m2/bicycle (23.7 ft2/bicycle) forced most cyclists to dismount and walk their bicycles. The older study in Davis, CA, found that bicycle operating space greater than 20 m2/bicycle (200 ft2/bicycle) provided free-flow conditions and that less than 3.7 m2/bicycle (40 ft2/bicycle) represented congestion.(36) Free-flow speed is also important in the study of bicycle operations. The Davis, CA, study reported a mean velocity of approximately 19 kilometers per hour (km/h) (11.8 miles per hour (mi/h)) for class I bicycle facilities and mean bicycle velocities between approximately 17.7 km/h (11.0 mi/h) to 20.1 km/h (12.5 mi/h) for class II facilities.(29) Class I facilities are off-street paths and class II facilities are designated as on-street bicycle lanes. Another study conducted in Davis, CA, reports that the free-flow speed of bicycles is usually above 17.7 km/h (11.0 mi/h).(36) A study conducted primarily in Michigan on university campuses reported average observed speeds of 24.9 km/h (15.5 mi/h) on bicycle lanes and 20.3 km/h (12.6 mi/h) on bicycle paths.(37) A manual released by FHWA (38) reported that the 85th percentile speed of bicycles is approximately 24 km/h (15 mi/h), and that a design speed of 32 km/h (20 mi/h) on level terrain would allow for nearly all bicyclists to travel at their desired speeds. In Sweden, the 85th percentile free-flow speed of bicycles is reported to be between 16 km/h (10 mi/h) and 28 km/h (17.4 mi/h).(32) A Canadian study found a free-flow speed of 25 km/h (15.5 mi/h).(35) One study in China reported observed average bicycle speeds at various locations between 10 km/h (6.2 mi/h) and 16 km/h (10 mi/h), with an overall mean of approximately 12 km/h (7.5 mi/h).(39) Another Chinese study reported observed average bicycle speeds between 12 km/h (7.5 mi/h) and 16.3 km/h (10.1 mi/h), with an overall mean of approximately 14 km/h (8.7 mi/h).(40) A more recent Chinese study reported peak-hour free-flow speeds of 18.2 km/h (11.3 mi/h), where bicycle traffic was separated from motor vehicles by a barrier, and 13.9 km/h (8.6 mi/h) at locations without a lane barrier.(41) A Dutch study reported a mean bicycle speed of 18 km/h (11.2 mi/h), with a standard deviation of 3 km/h (1.9 mi/h).(42) The Dutch study also reported that the observed average speed appeared to be unaffected by path width. Virkler and Balasubramanian(43) conducted the most detailed field study on shared-use paths using North American data collected prior to this study. Their study focused on operational data collected along two multi-use facilities (one in Columbia, MO, and the other in Brisbane, Australia). Mean speeds were recorded for hikers, joggers, and bicyclists. Results from the speed study showed that the mean speed of joggers was roughly twice that of hikers, and the mean speed of bicyclists was roughly twice that of joggers. As expected, the standard deviation of speed within each user group increased as the mean speed increased. The mean speeds collected at the Missouri site were similar to those collected at the Brisbane site; however, the standard deviation of speeds was much higher at the Missouri site for the jogger and bicyclist user groups. In addition, passing data for each user-group combination were collected at the two sites. Passing data recorded at the two sites showed significant differences with respect to the mean passing time. On average, passing times at the Columbia site were approximately twice as long as passing times at the Brisbane site. This is to be expected given the larger standard deviation of speeds observed at the Missouri site. A total of 206 passing maneuvers were recorded at the Brisbane site compared to 49 passing maneuvers at the Columbia site. In an earlier effort, Botma and Papendrecht(5) collected operational data on four paths within a town and on one tour (race) path outside of town. The narrowest town path was 1.8 m wide, while the other three were approximately 2.5 m (8.2 ft) wide. The paths selected for the data collection contained only bicycle and moped traffic. No pedestrians were observed. Speed and lateral clearance data were collected for all bicycles and mopeds. Passing data (i.e., frequency, passing time, and lateral clearance) were also collected. The average bicycle speed recorded at each of the sites was 19 km/h (11.8 mi/h), which is comparable to Virkler and Balasubramanian's observations.(43) However, the standard deviation found by Botma and Papendrecht (4.8 km/h (3 mi/h)) was much lower than that found by Virkler and Balasubramanian (4.8 to 7.6 km/h (3 to 4.7 mi/h)).(5, 43) Interestingly, curb height, which varied from 3 to 10 cm (1.1 to 3.9 inches), did not affect the lateral position of bicyclists; however, it did affect that of mopeds. Bicycle passing data collected in this study indicate that on the narrower 1.8-m path, the distance over which passing occurred was quite short (about 24 m (79 ft)) and took less than 5 seconds (s). On the 2.5-m path, passing took place over a much longer distance (about 63 m (206 ft)) and consumed more than 11 s. Therefore, based on this study, it appears that the wider paths provided a more comfortable transition for passing maneuvers as cyclists became less concerned about negotiating opposing traffic. In summary, we know a good deal about bicyclist characteristics, although there is a rather large range for some key parameters. For example, free-flow bicycle speed appears to be somewhere between 10 km/h (6.2 mi/h) and 28 km/h (17.4 mi/h), with a majority of the observations being between 12 km/h (7.5 mi/h) and 20 km/h (12.4 mi/h). Meanwhile, the design speed recommended by AASHTO for bicycle facilities in the United States is 32 km/h (20 mi/h), which is the same as that recommended by FHWA.(1) Bicyclists and pedestrians are typically not the only regular users of shared-use paths in the United States. Until recently, there has not been any significant quantitative research completed in the United States that addresses the effects that other path users (i.e., inline skaters, skateboarders, scooters, etc.) have on the performance of the path. This changed with the recent publication of a final report from FHWA on the characteristics of many of these other path users.(44) The research team studied the characteristics of 811 users of 14 emerging devices in three States. They measured the physical dimensions of the devices, the space required for a three-point turn, the lateral operating space (sweep width), turning radii, acceleration capabilities, speed, and stopping sight distances. One of their most important findings that relates to the objectives of this study was that inline skaters had a sweep width of 1.5 m (5 ft). This is larger than the minimum bicycle lane width of 1.2 m (4 ft) recommended by AASHTO.(1) The team also found that for horizontal curve radius and stopping sight distance, the emerging devices that had the highest values were recumbent bicycles. Segways were included among the emerging devices studies during this effort, incidentally; however, the team found that Segway users would not be the critical users for any of the design criteria evaluated. In Europe, interest is rising in the role played by skaters on shared-use paths. The main concern seems to be safety, especially in city centers. Most of the current expressions of this concern are to blame the skaters and admonish them to behave better. There is no new information about adequate facilities that would incorporate skaters with other users. In fact, some observers believe that the number of inline skaters will rise in the short term, but will stabilize or fall in the medium and long term.
MEASURING PATH USER QUALITY OF SERVICEOn shared-use facilities, the presence of pedestrians can be detrimental to bicycle quality of service because pedestrians move at much lower speeds. However, it is very difficult to establish a single bicycle/pedestrian equivalent value because the relationship between the two modes differs depending on their respective volumes, directional splits, and other conditions. Botma developed the concept of hindrance on shared-use paths to overcome this difficulty and to allow a meaningful quality of service to be computed.(42) Botma's procedure for determining bicyclist LOS on a shared-use path is founded on the concept of the hindrance experienced by path users as they travel a unit length of the path.(42) Based on earlier field studies conducted at four sites in The Netherlands, he found that the correlation between bicycle volume and speed was very weak (R2 = 0.20).(5) Density, the ratio of volume and speed, has been used in Germany as the LOS indicator on trails; however, the selection of densities to delineate LOS can be rather subjective. Botma therefore concluded that LOS for bicycle paths should not be based on speed or density, but rather on the freedom to maneuver and the ability to make unrestricted passing maneuvers.(42) Hindrance reflects the degree to which a user is restricted from the freedom to maneuver. Such restrictions occur when a bicyclist passes a slower bicyclist or a pedestrian, or when he or she meets a bicyclist or pedestrian traveling in the opposite direction. LOS is then defined on the basis of the fraction of the path users that experience hindrance. For example, LOS A is said to occur when fewer than 10 percent of all users experience hindrance over a 1-km (0.62-mi) path. On the other extreme, the LOS E/F boundary is reached when all users experience hindrance and when the average path user is expending about two-thirds of his or her time maneuvering around other users. It is important to note that the LOS E/F boundary occurs well before the path capacity is reached. Capacity in one lane on a bicycle path has been reported to be somewhere between 1,500 and 5,000 bicycles per hour, as will be shown later. Using a simple simulation model, Botma and Papendrecht were able to relate the percentage of hindrance to directional volumes.(45)Furthermore, because hindrance is difficult to measure directly in the field, the frequency of meeting and passing events was used as a proxy variable for hindrance. Of course, the conversion from events to hindrance requires some judgment about the "relative impedance" of each event from the user perspective. Since there was no guidance in the literature, Botma assumed that all meeting events are half as severe as all passing events.(42) Therefore, the total hindrance is calculated as the weighted frequency of all meeting and passing events. The computation of the various event-type frequencies is described next. From the bicyclist's perspective, the number of events experienced by the average bicyclist depends on: (1) whether the path is one way or two way, (2) whether the path is exclusive (bicycles only) or shared (bicycles, pedestrians, inline skaters, etc.), and (3) the directional volumes of all path users. For a two-way shared-use path serving primarily bicycles and pedestrians, there are four types of events, including:
For case A, assume that bicyclists do not impede each other and that bicycle speeds are normally distributed with mean (Ub) and standard deviation (
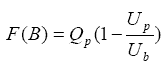
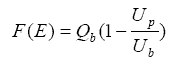
For case B, the frequency of pedestrians that the average bicyclist passes, assuming a directional pedestrian flow of Qp per hour with mean speed Up, is estimated by the following equation:
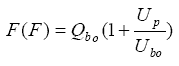
In case C, the frequency of opposing bicycles that the average bicyclist meets, assuming an opposing bicycle flow of Qbo, with mean speed Ubo, is estimated as:
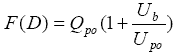
In the event that the mean bicycle speeds are equal in both directions, F(C) simplifies to 2Qbo. Finally, for case D, the frequency of opposing pedestrians that the average bicyclist meets, assuming an opposing pedestrian flow of Qpo, with mean speed Upo, is estimated as:
From the pedestrian's perspective, Botma's method assumes (probably unrealistically) that pedestrians do not impede each other on a shared-use path. Therefore, the relevant events are only those involving the interactions of pedestrians and bicycles. For a two-way, shared-use path that serves primarily bicycles and pedestrians, there are two such events (making the reasonable assumption that pedestrians never pass bicyclists):
E. Pedestrian overtaken by bicycles traveling in the same direction. For case E, the hourly frequency of bicycles passing the average pedestrian on the path, assuming a directional bicycle flow of Qb per hour, and assuming pedestrian and bicycle mean speeds of Up and Ub, respectively, is estimated from:
In case F, the hourly frequency of opposing bicycles meeting an average pedestrian on the path, assuming an opposing directional bicycle flow of Qbo per hour, and assuming pedestrian and opposing bicycle mean speeds of Up and Ubo, respectively, is estimated from:
A path-wide hindrance or LOS can be obtained by adding all the "impedance weighted" events for each path user, and then calculating the path average using the volume for all path users. The procedure reveals a high sensitivity of bicycle LOS to pedestrian volumes and a much lower sensitivity of pedestrian LOS to bicycle volumes. The two examples in table 1, taken from Botma, illustrate the point.(42) The LOS indicated in parentheses is the one predicted if the path were to be used exclusively by pedestrians or bicycles. Table 1. LOS examples for a two-way, shared-use path.
Until very recently, the HCM had no substantive material on bicycle operations and much less on shared-use paths.(2, 14, 19) Based on previous research performed for FHWA by some members of this research team, much of Botma's work on shared-use paths (modified for U.S. conditions) was incorporated into the 2000 HCM.(3-4,7) This material appears in three chapters. Chapter 11 deals with pedestrian and bicycle concepts and provides descriptive information on the various facility types. Chapter 18 on pedestrians presents the effects of bicycles on pedestrian LOS on shared-use paths. Finally, chapter 19 on bicycles provides the most comprehensive treatment of shared-use paths. Analysis methods are provided for any combination of pedestrians and bicycles for one-way and two-way paths, and for two-lane and three-lane paths. Examples illustrating the LOS benefits of separating pedestrians and bicycles are provided. All of this material was reflected in the Highway Capacity software and in other software replicating HCM calculations. The one published effort to date that attempted to validate Botma's method was by Virkler and Balasubramanian.(43) The bicycle passing data they collected on a shared-use path in Brisbane, Australia, were compared to predictions calculated using Botma’s hindrance models. The mean speed and standard deviation data from the Brisbane site were applied to Botma’s overtaking frequency model and were compared to the actual observations for each six passing combinations: (1) bicycle passing bicycle, (2) jogger passing jogger, (3) hiker passing hiker, (4) bicycle passing jogger, (5) bicycle passing hiker, and (6) jogger passing hiker. Results from the prediction model were very similar to the actual observations for all passing combinations, with the exception of the hiker passing hiker and jogger passing hiker combinations. The predicted frequencies for these two passing types were much higher than those observed in the field. Similarly, the predicted delayed overtakings for these two passing combinations were much higher than the actual delayed overtakings, while the rest of the combinations were quite comparable. Density Density has often been proposed as a measure of effectiveness (MOE) for bicycle facilities. Previous studies in California, (36) Germany,(42) and China(33) all proposed levels of service based on density. The California study reported that bicycle capacity occurs at approximately 2,600 bicycles per hour per 1.0-m (3.3-ft)lane. That study proposed that LOS A was at a density greater than 20 m2/bicycle (215 ft2/bicycle) while LOS F was at a density less than 3.7 m2/bicycle (40 ft2/bicycle). The German study proposed that LOS A was at a density greater than 200 m2/bicycle (2150 ft2/bicycle) while LOS F was at a density less than 10 m2/bicycle (108 ft2/bicycle). Instead of LOS of an A through F scale, the Chinese study proposed the following seven "states of bicycle traffic"
The highest state, very comfortable, was at a density greater than 10 m2/bicycle (108 ft2/bicycle) while lowest state, dismount, was at a density less than 2.2 m2/bicycle (24 ft2/bicycle). Note that a density just over 10 m2/bicycle (108 ft2/bicycle) would produce an LOS E in Germany and would produce a "very comfortable" rating on the Chinese scale. No capacities were reported in the Chinese study. However, based on the speeds and densities reported, it appears that the capacity for a 2-m- (6.6-ft-) wide path is between 4,400 and 4,500 bicycles per hour, and the capacity of a 3-m- (9.9-ft-) wide path is between 6,600 and 6,700 bicycles per hour. Space The 2000 HCM uses space (m2/ped) as the primary measurement of effectiveness for pedestrian LOS on uninterrupted facilities.(4) The HCM uses that measurement because space dictates the pedestrians' ease, speed, and freedom of movement. Because pedestrian movements are affected by the presence and relative location of other pedestrians, space is a viable measurement. Stress There are many components to the bicycling environment that need to be considered when thinking about the potential attractiveness of a bicycle facility or determining the best locations for new construction and improvements that would benefit bicycles. Researchers have identified many of those factors and have shown how they can help estimate the quality of service for a facility. To this point, such work has applied only to on-street bicycle facilities. Based on other studies, Northwestern University(25) has assigned stress levels between 1 and 5 to three primary factors and to three secondary factors that contribute to the relative attractiveness of an on-street bicycle facility. Level 5 suggests a high level of stress, and level 1 suggests a low level of stress. The assignment of an overall stress level to a facility is based on an average of the values for the three primary factors:
Stress level 1 is associated with motor vehicle volumes of 50 vehicles per hour per lane, curb lane widths of 4.6 meters (15 feet), and motor vehicle speeds of 40 km/h (25 mi/h). Meanwhile, stress level 5 is associated with motor vehicle volumes of 450 vehicles per hour per lane, curb lane widths of 3.4 meters (11 feet), and motor vehicle speeds of 72 km/h (45 mi/h). After the average of the three primary factors is found, the stress level of the facility can be subjectively rated based on the values of three specified secondary factors or on any other secondary factors that are felt to be important. The three specified secondary factors were:
Stress level 1 is associated with 5 percent heavy vehicles, 6 driveways per kilometer (10 driveways per mile), and no parking allowed. Stress level 5 is associated with 15 percent heavy vehicles, 31 driveways per kilometer (50 driveways per mile), and 20 parking movements per hour per block. Other secondary factors mentioned for possible consideration include bicycle volume, pavement condition, sight distance, bus routes, presence of drainage grates, intersection turning volumes, and street grade. If an analyst felt that one or more of these additional secondary factors were important, a subjective decision could be made as to the degradation contributed to the stress level of the facility. Several local and State transportation agencies have developed their own stress level methods for on-street bicycle facilities. These are generally based on or look very similar to the Northwestern University method described above, using similar primary and secondary factors with slightly different values. Simulation Models Analysts could obtain performance measures on shared-use paths from computer simulation models. However, to date, there is no widely used computer simulation software in the United States that is capable of describing user interactions on shared-use paths in a realistic manner. The earliest attempt was a numerical, microscopic simulation model by Botma and Papendrecht.(45) The model included three types of users: solo bicyclists, bicyclists riding in pairs, and mopeds (no pedestrians). It is essentially a Monte Carlo simulator of individual entities whose speeds follow the normal distribution with exponentially distributed headway. The model assumes no impedance between users and is used to capture the number of passing and meeting events of various users for a variety of volume and speed ranges. Given that much of the model outputs are already captured by Botma's analytical equations, the utility of such a model is questionable. There are obvious similarities between operations of nonmotorized traffic on shared-use paths, and motorized traffic on two-lane highways. Both facilities experience passing and meeting events, delayed passing, and conflicts with opposing traffic. In that respect, there may be lessons to be learned from simulation models such TWOPAS in the United States(48) and TRAAR in Australia.(49) The TWOPAS model was extensively used in developing a new two-lane highway procedure for the 2000 HCM.(4) Of specific relevance to this study is the comparison of desired versus actual passing, and how the frequency varies according to directional volumes and speeds. In fact, Morrall and Werner proposed using the ratio of actual versus desired passing as the measure of two-lane highway LOS. (50) This may be one way of overcoming the deficiency in Botma's method that was alluded to earlier in this report. A review of the most popular microscopic traffic simulation software, including CORSIM,(51) VISSIM,(52) and INTEGRATION,(53) showed that they will not help much for pedestrian and bicycle modeling. CORSIM does not model pedestrians explicitly. It basically adds vehicular delay based on the level of pedestrian impact. The pedestrian impact can be modeled in CORSIM as a statistical distribution. No bicycle impact is considered in CORSIM. CORSIM does allow users to customize the model for certain vehicle types and, therefore, could be "tricked" into modeling pedestrians, bicycles, and other users. However, the lack of an algorithm to make same-direction passings on a two-lane highway (CORSIM uses one-way links exclusively) would make modeling a two-way, shared-use path (by far the most popular type) untenable. Similarly, INTEGRATION does not consider bicycles or pedestrians. VISSIM can explicitly model both pedestrians and bicycles. Pedestrians and bicycles simply follow their routes. However, from its manual and our experience with the model, it appears that VISSIM does not model pedestrian and bicycle interactions. The conclusion from this review is that these popular existing microscopic traffic simulation models would not be helpful in this research. Setting the LOS Scale Capacity Many LOS scales in the HCM and elsewhere adopt capacity as the LOS E to F boundary. This is especially true of uninterrupted facilities such as shared-use paths. However, the capacity or saturation flow of bicycle facilities is rarely observed in practice, especially in the United States. The 1994 HCM(14) listed the following ranges of reported capacities:
Lane widths corresponding to the observations above were from 0.9 to 1.2 meters (3 to 4 feet). Current LOS Scales Versions of the HCM prior to 2000 did not have an LOS scale for shared-use paths. In 2000, the HCM presented hindrance as the MOE for shared-use paths, based on Botma's procedure. The 2000 HCM(4) also established LOS scales for bicycles and pedestrians on shared-use paths, again based on Botma's suggestions, as shown in tables 2 and 3. The LOS on a shared-use facility is not the same from the viewpoint of pedestrians and bicycles. As noted previously, for bicyclists, LOS F refers to a situation where an average user experiences hindrance more than one time in a 1.0-km (0.62-mi) trail segment. Perhaps the most important thing to note when viewing the bicycle LOS scale (tables 2) is that LOS F is not equivalent to capacity for the facility. An unacceptable number of events is always reached prior to capacity and, in some cases, capacity can be almost twice the volume at which LOS F is reached. The procedures in the 2000 HCM are based on frequencies of events and on perceived LOS, not on the carrying capacity of the facility. Simulation Models Analysts could obtain performance measures on shared-use paths from computer simulation models. However, to date, there is no widely used computer simulation software in the United States that is capable of describing user interactions on shared-use paths in a realistic manner. The earliest attempt was a numerical, microscopic simulation model by Botma and Papendrecht.(45) The model included three types of users: solo bicyclists, bicyclists riding in pairs, and mopeds (no pedestrians). It is essentially a Monte Carlo simulator of individual entities whose speeds follow the normal distribution with exponentially distributed headway. The model assumes no impedance between users and is used to capture the number of passing and meeting events of various users for a variety of volume and speed ranges. Given that much of the model outputs are already captured by Botma's analytical equations, the utility of such a model is questionable. There are obvious similarities between operations of nonmotorized traffic on shared-use paths, and motorized traffic on two-lane highways. Both facilities experience passing and meeting events, delayed passing, and conflicts with opposing traffic. In that respect, there may be lessons to be learned from simulation models such TWOPAS in the United States (48) and TRAAR in Australia. (49) The TWOPAS model was extensively used in developing a new two-lane highway procedure for the 2000 HCM. (4) Of specific relevance to this study is the comparison of desired versus actual passing, and how the frequency varies according to directional volumes and speeds. In fact, Morrall and Werner proposed using the ratio of actual versus desired passing as the measure of two-lane highway LOS.((50) This may be one way of overcoming the deficiency in Botma's method that was alluded to earlier in this report. A review of the most popular microscopic traffic simulation software, including CORSIM, (51) VISSIM, (52) and INTEGRATION, (53) showed that they will not help much for pedestrian and bicycle modeling. CORSIM does not model pedestrians explicitly. It basically adds vehicular delay based on the level of pedestrian impact. The pedestrian impact can be modeled in CORSIM as a statistical distribution. No bicycle impact is considered in CORSIM. CORSIM does allow users to customize the model for certain vehicle types and, therefore, could be "tricked" into modeling pedestrians, bicycles, and other users. However, the lack of an algorithm to make same-direction passings on a two-lane highway (CORSIM uses one-way links exclusively) would make modeling a two-way, shared-use path (by far the most popular type) untenable. Similarly, INTEGRATION does not consider bicycles or pedestrians. VISSIM can explicitly model both pedestrians and bicycles. Pedestrians and bicycles simply follow their routes. However, from its manual and our experience with the model, it appears that VISSIM does not model pedestrian and bicycle interactions. The conclusion from this review is that these popular existing microscopic traffic simulation models would not be helpful in this research. Setting the LOS Scale Capacity Many LOS scales in the HCM and elsewhere adopt capacity as the LOS E to F boundary. This is especially true of uninterrupted facilities such as shared-use paths. However, the capacity or saturation flow of bicycle facilities is rarely observed in practice, especially in the United States. The 1994 HCM(14) listed the following ranges of reported capacities:
Lane widths corresponding to the observations above were from 0.9 to 1.2 meters (3 to 4 feet). Current LOS Scales Versions of the HCM prior to 2000 did not have an LOS scale for shared-use paths. In 2000, the HCM presented hindrance as the MOE for shared-use paths, based on Botma's procedure. The 2000 HCM(4) also established LOS scales for bicycles and pedestrians on shared-use paths, again based on Botma's suggestions, as shown in tables 2 and 3. The LOS on a shared-use facility is not the same from the viewpoint of pedestrians and bicycles. As noted previously, for bicyclists, LOS F refers to a situation where an average user experiences hindrance more than one time in a 1.0-km (0.62-mi) trail segment. Perhaps the most important thing to note when viewing the bicycle LOS scale (tables 2) is that LOS F is not equivalent to capacity for the facility. An unacceptable number of events is always reached prior to capacity and, in some cases, capacity can be almost twice the volume at which LOS F is reached. The procedures in the 2000 HCM are based on frequencies of events and on perceived LOS, not on the carrying capacity of the facility.
Table 2. Bicycle LOS criteria for shared-use paths in the 2000 HCM. 4
Table 3. Pedestrian LOS criteria for 2.4-m- (8-ft-) wide sharred-use paths in the 2000 HCM. 4
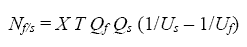
Regarding tables 2 and 3, it is also important to note that all service volumes given in the 2000 HCM for shared-use paths assume ideal geometric and traffic conditions. Lateral obstructions, extended sections with appreciable grades, and other local factors may reduce the LOS for a facility. Such factors have not been sufficiently documented to date to make a quantitative assessment of their effects. The key assumption in the LOS scale for pedestrians on shared-use paths is that pedestrians do not hinder other pedestrians. In Botma's discussion of his own work,(42) he questions this assumption. Botma's expression describing the total number of overtakings of pedestrians by bicyclists, Nf/s, is:
where:
X = Length of site, m Using an average pedestrian speed of 1.25 m/s (4.1 ft/s) and an average bicyclist speed of 5 m/s (16.4 ft/s), Botma developed an LOS table for pedestrians traveling on two-lane, two-way, shared-use paths. Table 3, substituting time period for frequency, showed Botma’s service levels. The 2000 HCM only provides LOS criteria for a 2.4-m- (8-ft-) wide (two-lane) path. Note that if one applied table 3 to an exclusive pedestrian trail, one would always have a service level of A, regardless of pedestrian volume, since the tables depend entirely on bicycle volume. Using existing walkway LOS standards based on space (presented below) certainly seems more reasonable than the use of Botma’s method for an exclusive or predominant pedestrian facility. For exclusive pedestrian walkways, as noted above, the 2000 edition of the HCM (as well as previous editions) uses space as the primary MOE.(4) At LOS A, the pedestrian has 5.6 m2 (60 ft2) or more of space. Under these conditions, pedestrians are capable of walking freely, without having to alter their path because of other pedestrians. The HCMdefines capacity and LOS F to be at 0.74 m2 (8 ft2) or less. Under these conditions, pedestrian walking speeds are greatly decreased. Pedestrians are merely capable of "shuffling" and there are frequent encounters with other pedestrians. Pedestrian mobility is severely lessened under these circumstances. Table 4 presents the levels of service for pedestrian walkways from the 2000 HCM. Speed and volume to capacity (v/c) ratios are used as supplementary LOS criteria.
Table 4. Average flow pedestrian walkway LOS criteria from the 2000 HCM.
Other Ways To Set the LOS Scale The experiences of past researchers may be helpful to this research team in recommending and establishing valid LOS criteria. Harkey, et al.,(6) and Landis, et al.,(7) both conducted surveys of bicyclists to develop LOS criteria for on-street bicycle facilities. Harkey, et al., conducted their surveys based on video images, while Landis, et al., conducted their surveys based on bicyclists riding sample facility segments. These are among the options available for gathering user perception of quality-of-service data. The stress levels discussed previously have been turned into levels of service by some agencies. However, in this regard, the LOS scales have typically been set quite arbitrarily. Past work by the TRB Highway Capacity and Quality of Flow Committee on setting LOS criteria has focused on the A through F scale, and primarily on finding a valid E/F boundary. For signalized intersections, this boundary was based on a large database collected for a National Cooperative Highway Research Program (NCHRP) study and on a judgment as to when delays became unacceptable. Criteria for other chapters were based on the chances that frustrated motorists would violate the traffic control and would endanger safety, relative to the chances at a signalized intersection. Pecheux, et al.,(59) explored the signalized intersection LOS criteria more systematically, exposing subjects in a laboratory study to red signal delays of various lengths and asking for reactions on a 1 to 10 scale. After analyzing the results, Pecheux, et al., concluded that their subjects had difficulty discerning more than two or three levels of service, basically merging levels A through C or D together.
SUMMARYThere are many sources of guidance for shared-use path designers. However, the current sources available to designers provide strictly qualitative guidance. The sources provide no guidance on how many of each different type of user will cause a path with given geometric conditions to provide a poor quality of service. Botma's procedure remains the best, thus far, to attempt to provide that quantitative guidance. As presented, Botma's models relating events to volumes are limited to shared-use paths serving pedestrians and bicycles only. However, his original micro-simulation model(5) could simulate multiple path users, including mopeds and tandem bicycles. The addition of other path users can be represented analytically in one of two ways. If a path user group (e.g., joggers) appears to have a similar mean speed to another group, then such groups can be lumped into one larger group that has a common mean and standard deviation. However, if a group is quite different from the others, then all events associated with this group must be described separately using equations 1 through 6 as appropriate. The second limiting assumption is that path users do not impede each other's movements. A good example is the predicted number of bicycle overtakings given by equation 1. This equation assumes that there is always adequate room to pass, with no change in speed or lateral positioning. This is true only if: (1) the path is wide enough, and/or (2) there is no opposing traffic during the passing maneuver. If passing is restricted, then there will be a number of "delayed overtakings." Virkler and Balasubramanian(43) used concepts of probability theory that were originally applied to two-lane highway operations to estimate the probability of delayed overtakings. The significance of this limitation cannot be overstated. When passing and meeting events become restricted, the procedure cannot predict that LOS will worsen when the number of events actually decreases. In summary, while the Botma procedure is based, in part, on field data, there are a number of reasons why the procedures should be validated for North American conditions:
The available literature provides some help; however, a substantial effort involving several types of field data collection was necessary to overcome the limitations in the Botma procedure and to calibrate an LOS scale that will help U.S. path designers.
FHWA-HRT-05-137 |
|||||||||||||||||||||||||||||||||||||||||||||||||||||||||||||||||||||||||||||||||||||||||||||||||||||||||||||||||||||||||||


 b). The desired frequency of passing events (per hour and unit length) experienced by the average bicyclist in a directional bicycle flow of Qb per hour can be estimated:(
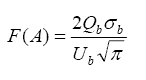

 40
40