Capacity Analysis of Pedestrian and Bicycle Facilities
Recommended Procedures for the "Signalized Intersections" Chapter of the Highway Capacity Manual
3. RESEARCH METHODOLOGY
After pertinent literature was reviewed, empirical data to describe the effect of pedestrians and bicycles on turning vehicles were collected. After conversations with professional and personal contacts from various areas, a few cities were identified for further study. For pedestrian analysis, Atlanta, Georgia; Chicago, Illinois; Eugene and Portland, Oregon; and Washington, D.C., were visited. For bicycle analysis, Davis, California; Eugene, Oregon; and Gainesville, Florida, were visited. The Atlanta, Chicago, and Washington, D.C., areas were visited in July 1995; the Davis, Eugene, and Portland areas were visited in March 1996; and Gainesville was visited in April 1996. A total of nine intersections were used for pedestrian data collection. Table 1 provides a summary of pertinent intersection parameters for the pedestrian data collection sites. In addition, a total of six intersections were used for bicycle data collection.
To quantify the impact of pedestrians on turning vehicles, study locations that isolated this effect from other factors that influence capacity were desired. Specifically, intersections with a significant volume of both pedestrians and turning vehicles, but with limited opposing traffic (for left turns from two-way streets) and permitted phasing were highly sought after. Central Business Districts (CBDs) provided the most likely sources of potential study locations with the preceding characteristics. Fortunately, intersections meeting these criteria were available throughout the United
States.
Wigan (1995) terms a pedestrian to be someone who is walking, usually in public places, and particularly on or adjacent to public rights of way for vehicles. This study generally followed this definition, in that walkers, runners, and people who use wheelchairs were counted as pedestrians. In addition, an individual pushing a baby in a stroller was counted as two pedestrians. Either a single or tandem bicycle was counted as one bicycle for the purposes of the study. While the preceding definitions are certainly open to discussion, they were selected as being reasonable, and allowed the study to proceed.
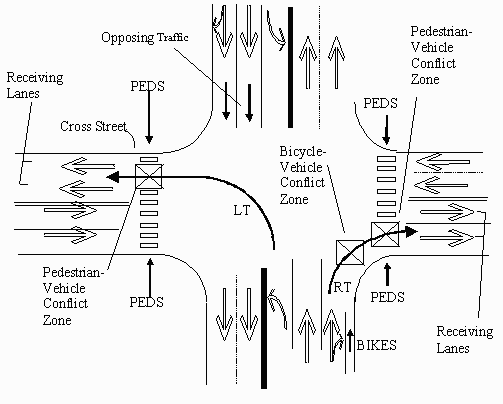
To simplify the analysis of the complex interaction between turning vehicles and pedestrians and/or bicycles, this study focused on the area where intersection users must compete for space, termed a conflict zone (Figure 5). After two unsuccessful attempts with alternative analysis methods, a modeling approach based on the occupancy of a conflict zone was selected. The problem was considered from the perspective of the turning driver. Under permitted phasing, she is searching for a usable gap in the nonmotorized traffic stream (Figure 6). In other words, she asks Can I make this turn? or, in regard to the pedestrians and other users in the crosswalk area, Is there a space open now for me to execute my turn? This space is the aforementioned conflict zone. In general, however, she does not ask, Is the entire crosswalk free of pedestrians? any more than a turning driver looking for a gap in an opposing vehicle stream expects the entire road ahead to be empty. In addition, from the perspective of the turning driver, it only matters if a conflict zone is occupied, not which users happen to occupy the conflict zone.
In general, a pedestrian cannot occupy a conflict zone at the same time as a vehicle, except under low speeds and at least one aggressive user. If the zone remains vacant long enough, one or more vehicles can execute a turn. Of course, factors such as lost time, opposing traffic, and unpredictability in user behavior ensure that vehicles will not use all of the vacant time, even with sufficient turning demand. Under this framework, the primary goal changes to finding the relationship between occupancy of a conflict zone and the adjustment to saturation flow.
A four-phase methodology based on conflict zone occupancy was developed to determine the effect of pedestrians and bicycles on lane groups containing turning vehicles. The first phase examines the relationship between pedestrian volume and the resulting occupancy of the conflict zone. The second phase, which applies only with opposing vehicular traffic (left turn from two-way street) or concurrent bicycle traffic (right turn from one-way street), determines the amount of that occupancy that actually affects the saturation flow of turning vehicles. A theoretical model was used for the left-turn case, while the results from a parallel research effort (Allen, 1996) were employed for the right-turn case. Therefore, no data collection was performed related to phase two.
 |
| Figure 5: Sample conflict zone location |
The third phase considers the actual relationship between conflict zone occupancy and turning vehicle saturation flow rate. Quantification of this phase-three relationship required intersections at which permitted turns departing from a queue interact only with pedestrians or other non-motorized traffic, such as bicycles. Although desired, no locations in which left turns from a two-way street encountered this situation could be found. Therefore, sites at which queued, turning traffic from a one-way street interacted with nonmotorized users (e.g., pedestrians, bicyclists, skateboarders, etc.) were employed.
 |
| Figure 6: Queued turning vehicles waiting for a gap in a pedestrian stream in Portland, Oregon |
The fourth and final phase applies this adjustment to a lane group, taking into account both the proportion of turning vehicles in the group and the proportion of turning vehicles using the protected phase. This phase merely involved an algebraic manipulation of formulas, so no data collection was performed for this last phase.
A total of 612 signal cycles were observed where bicycles crossed without substantial vehicular interference across 6 sites for the development of a bicycle volume-conflict zone occupancy model. A total of 935 cycles where pedestrians crossed without substantial vehicular interference across 8 sites were observed for the development of the pedestrian volume-conflict zone occupancy model. In addition, a total of 266 queues of 5 or more vehicles across 8 sites were observed for development of the model relating conflict zone occupancy to saturation flow. Spreadsheets were used to assist the development of the pedestrian volume-conflict zone occupancy model. Using a series of macros, the spreadsheet took the recorded conflict zone and signal status event information and computed parameters such as average occupancy per green phase. It also used the event information to develop a time profile of occupancy over the green phase. In addition, spreadsheets were also used to assist the development of the model relating conflict zone occupancy to saturation flow. Using a series of macros, the spreadsheet took the recorded conflict zone and discharging vehicle event information and computed parameters such as average occupancy per queue. Milazzo II (1996) provides more detailed information on the analysis of the field data.
TABLE 1 Data collection site characteristics
 |
 |
 |
 |
Approach Lanes Configuration (incl. de facto turn lanes) |
Receiving Lanes Configuration |
 |
 |
 |
 |
 |
 |
 |
 |
 |
 |
 |
 |
 |
 |
Approach Street Turning Signal Type |
 |
 |
 |
g/C |
| 1 |
1 |
2-way |
1-way |
LT-T |
(P)-3T |
1 |
2 |
3 |
32 |
40 |
20 |
Y |
~ 0 |
N |
N |
CBD |
40 |
90o |
Y |
Prot-Perm |
Y |
17 |
70 |
0.2 |
| 2 |
1,3 |
1-way |
2-way |
L-LT-R |
3T |
2 |
- |
3 |
35 |
78 |
28 |
Y |
~ 0 |
N |
N |
CBD |
25 |
90o |
Y |
Protected |
Y |
25. |
105 |
0.24 |
| 3 |
1,3 |
2-way |
1-way |
LT-T-(P) |
2T |
1 |
1 |
2 |
28 |
36 |
28 |
Y |
~ 0 |
N |
N |
N |
50 |
90o |
Y |
Per |
Y |
36. |
75 |
0.48 |
| 4 |
3 |
1-way |
1-way |
(P)-LR-(bic)-(P) |
(P)-T-(bic)-(bus) |
1 |
- |
1 |
11 |
33 |
21 |
Y |
+ 1 |
Y |
N |
CBD |
50 |
90o |
N |
(no signal) |
N |
60. |
60 |
1.00 |
| 5 |
1,3 |
1-way |
1-way |
(P)-LT-2T-(P) |
(P)-2T-(P) |
2 |
- |
2 |
20 |
36 |
22 |
N |
~ 0 |
Y |
N |
CBD |
30 |
90o |
Y |
Protected |
Y |
24. |
56 |
0.43 |
| 6 |
1,3 |
1-way |
1-way |
L-(bus) |
(P)-2T-(P) |
1 |
- |
2 |
20 |
36 |
22 |
N |
- 3 |
N |
Y |
CBD |
30 |
90o |
Y |
Protected |
Y |
24. |
56 |
0.43 |
| 7 |
1,3 |
1-way |
2-way |
L-4T-R |
2T-R |
1 |
- |
2 |
24 |
80 |
30 |
Y |
~ 0 |
N |
N |
CBD |
30 |
90o |
Y |
Protected |
Y |
25. |
70 |
0.36 |
| 8 |
1,3 |
1-way |
1-way |
L-LT-2T |
5T-(P) |
2 |
- |
5 |
47 |
56 |
46 |
Y |
~ 0 |
N |
N |
CBD |
25 |
90o |
Y |
Protected |
Y |
27. |
80 |
0.34 |
| 9 |
1,3 |
1-way |
1-way |
L-LT-3T-(P) |
2T-(P) |
2 |
- |
2 |
22 |
32 |
26 |
Y |
~ 0 |
N |
N |
CBD |
25 |
90o |
Y |
Protected |
Y |
39. |
80 |
0.49 |
|


