U.S. Department of Transportation
Federal Highway Administration
1200 New Jersey Avenue, SE
Washington, DC 20590
202-366-4000
Federal Highway Administration Research and Technology
Coordinating, Developing, and Delivering Highway Transportation Innovations
 |
| This report is an archived publication and may contain dated technical, contact, and link information |
|
Publication Number: FHWA-RD-98-108
Date: February 1998 |
Capacity Analysis of Pedestrian and Bicycle FacilitiesRecommended Procedures for the "Bicycles" Chapter of the Highway Capacity Manual
5. EXAMPLE PROBLEMSExample 1 - Uninterrupted, Exclusive Bicycle Path For this example, the following is assumed:
The first step is to convert the peak-hour volume to a peak flow rate as follows:
Ftotal= 0.5 [F meet] + [F pass] = 0.5 [2{V bike-op}] + [0.188{V bike-sm}] = 0.5 [2{(opp. dir. split)(peak flow rate)}] + [0.188{(same dir. split)(peak flow rate)}] NORTHBOUND: F total= 0.5 [ 2{(0.30)(150)}] + [0.188{(0.70)(150)}] = 65 events/h Using Table 1, this represents LOS Cfor the northbound direction. SOUTHBOUND: F total= 0.5 [ 2{(0.70)(150)}] + [0.188{(0.30)(150)}] = 113 events/h Using Table 1, this represents LOS Dfor the southbound direction. Example 2 - Uninterrupted, Mixed-Use Path For this example, the following is assumed:
The total frequency of events and LOS for each direction is then computed using Equation [6] which incorporates Equations [4] and [5]): F total= 0.5 [F meet] + [F pass] = 0.5 [5{V ped-op} + 2{V bike-op}] + [3{V ped-sm} + 0.188{V bike-sm}] = 0.5 [5{(opp. dir. ped split)(ped peak flow rate)} + 2{(opp. dir. bike split)(bike peak flow rate)}] + [3{(same dir. ped split)(ped peak flow rate)} + 0.188{(same dir bike split)(bike peak flow rate)}] EB: F total= 0.5 [5{(0.5)(80)} + 2{(0.4)(150)}] + [3{(0.5)(80)} + 0.188{(0.6)(150)}] = 297 events/h Interpolation between 100 and 200 bikes/h on Table 3 produces the same results. Using Table 4, this represents LOS Dfor the eastbound direction. WB: F total= 0.5 [5{(0.5)(80)} + 2{(0.6)(150)}] + [3{(0.5)(80)} + 0.188{(0.4)(150)}] = 321 events/h Interpolation between 100 and 200 bikes/h on Table 3 produces the same results. Using Table 4, this represents LOS Efor the westbound direction. Example 3 - On-Street Bicycle Lane For this example, the following is assumed:
Since the standard deviation of speeds of 4.5 km/h is different from the default value of 3 km/h, equations [1] to [3] cannot be used. Table 5 must be used to predict the number of passing events and LOS. First, the bicycle volume is converted to a peak flow rate as follows: Bicycle flow rate = Hourly Volume/ PHF = 150/0.75= 200 bikes/h Referring to Table 5, for 200 bikes/h, a mean speed of 18 km/h and standard deviation of 4.5 km/h, the predicted number of passing events is 113/h. This represents a LOS Don the facility. For comparison purposes, if the default values were used (18 km/h, 3 km/h standard deviation), the predicted number of events would drop to 75 events/h. This would incorrectly represent LOS Con the facility. Example 4 - Interrupted, Signalized Intersection For this example, the following is assumed:
First, the capacity is computed using Equation [7], with an assumed bicycle saturation flow rate ( s bike) of 2000 bikes/h of green: c bike= s bike(g/C) = 2000(20/50) = 800 bikes/h The average signal delay is then computed using Equation [8]: d= 0.5C [1 - (g/C)] 2/ {1 - (g/C)[Min (V bike/ c bike, 1.0)]} = 0.5(50) [ 1 - (20/50) ] 2/ { 1 - (20/50)[Min (120/800, 1.0)] } = 9.6 s Using Table 6, this represents LOS B. Example 5 - Combined Bicycle Facility For this example, the following is assumed:
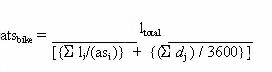
The average delays for each of the intersections are computed using Equation [8] (which incorporates Equation [7]) and an assumed bicycle saturation flow rate ( s bike) of 2000 bikes/h of green: d i = 0.5C [1 - (g/C)] 2/ {1 - (g/C)[Min (V bike/{ c bike}, 1.0)]} = 0.5C [1 - (g/C)] 2/ {1 - (g/C)[Min (V bike/{( sbike)(g/C)}, 1.0)]} d 1= 0.5 (100) [1 - (0.3) ] 2/ { 1 - (0.3) [Min (600/{(2000)(0.3)}, 1.0 ] } = 35.0 s d 2= 0.5 (100) [1 - (0.5) ] 2/ { 1 - (0.5) [Min (600/{(2000)(0.5)}, 1.0 ] } = 17.9 s d 3= 0.5 (100) [1 - (0.4) ] 2/ { 1 - (0.4) [Min (600/{(2000)(0.4)}, 1.0 ] } = 25.7 s Using an average uninterrupted travel speed (as i) of 25 km/h (15.5 mi/h) for all links, the average travel speed for the arterial is computed using Equation 9:
= 2 / [ { (0.5 + 0.2 + 1.0 + 0.3) / (25)} + { (35.0 + 17.9 + 25.7 ) / 3600 }] = 19.6 km/h Using Table 7, this represents LOS B. |