Final Report Phase 1 - Temporary Wet-weather Pavement Markings for Mork Zones
APPENDIX A-1: TASK 1 - INITIAL PRE-SCREENING OF CANDIDATE PAVEMENT MARKING SYSTEMS
Task 1, the initial pre-screening of candidate pavement marking systems, their installation on a test deck, and retroreflectivity data collection had been completed during this first reporting period.
The primary focus of the 3M research team in this quarter was to install the prototype s on the test deck and evaluate their durability in terms of retention of retroreflective properties over time under real-world traffic exposure conditions. A test deck for these evaluations was arranged in New Orleans, LA with the assistance and cooperation of the Jefferson Parish Sign & Marking Department of the Department of Engineering, Traffic Engineering Division. The test deck is the right hand lane of south bound Whitney between Carol Sue Avenue and Copper Road in Jefferson Parish ( Figure 1). The ADT on this road segment measured in May 2007 was 6200, the details of which are shown in Table 2.

Figure 1. Highways for LIFE New Orleans Test Deck
Twenty-two (22) experimental all-weather work zone pavement marking samples were installed on the test deck on November 28, 2007. Figure 2 through Figure 6 illustrates the test deck installation and measurement efforts. The composition of each prototype was carefully customized to generate a rich dataset from a wide range of candidate pavement marking samples. Variations in all-weather prototypes included paint thickness (mil), element size (three sizes), element proportion (percentage of 2.4 index elements and 1.9 index elements in the element mixture) and drop rate (gram/foot). In the samples, two types of elements (surrounded by either 2.4 or 1.9 index beads) were tested in addition to other types of common glass beads. A single type of high-build traffic paint was used for all the prototypes. In addition to the prototypes two commercially available pavement marking tapes were also installed on the test deck to serve as controls.
The markings were applied in a longitudinal CEN-style test deck configuration with a hand cart. Four inch by three foot (4" x 3') lines were installed at the centerline, left wheel track, right wheel track, and right edge line positions. We prefer this longitudinal configuration as opposed to transverse configuration (which is the common practice in many test decks), because these markings will eventually be installed in the longitudinal configuration, which is also the direction of traffic. This way, the tire hits are in the same direction as the retroreflectivity measurements, which is also congruent with the driver view. The test lines were sprayed through a mask and the drop-on elements, and a subsequent drop of glass beads were applied by hand using shakers.This is common industry practice for the installation of such multiple construction research test decks. Standard Retroreflectance (RL, cd/m2/lx) measurements were made using LTL-X handheld pavement marking retroreflectometers on November 29, the day after installation. The 3M team made follow-up measurements on December 10-11, December 17-18 with the final follow-up January 8-9. These represent measurements at effectively 0, 11, 18 and 41 days after installation. Table 3 shows the final set of selected and installed pavement markings on the test deck.
| Interval Begin |
Weekday Avg |
|---|---|
| 12:00 AM | 44 |
| 1:00 AM | 15 |
| 2:00 AM | 15 |
| 3:00 AM | 14 |
| 4:00 AM | 29 |
| 5:00 AM | 86 |
| 6:00 AM | 372 |
| 7:00 AM | 704 |
| 8:00 AM | 612 |
| 9:00 AM | 351 |
| 10:00 AM | 304 |
| 11:00 AM | 308 |
| 12:00 PM | 370 |
| 1:00 PM | 385 |
| 2:00 PM | 356 |
| 3:00 PM | 407 |
| 4:00 PM | 389 |
| 5:00 PM | 384 |
| 6:00 PM | 309 |
| 7:00 PM | 258 |
| 8:00 PM | 195 |
| 9:00 PM | 134 |
| 10:00 PM | 117 |
| 11:00 PM | 73 |
| Total: | 6233 |
| Prototype Number | Wet Paint Film (mils) | Element Size | Drop Rate (g/lineal ft) | 2nd Drop beads | Drop rate (g/lineal ft) |
|---|---|---|---|---|---|
| 1 | 15 | Small | 4 | M247 Type 1 | 12 |
| 2 | 15 | Small | 8 | M247 Type 1 | 12 |
| 3 | 15 | Small | 12 | M247 Type 1 | 12 |
| 4 | 20 | Small | 4 | M247 Type 1 | 12 |
| 5 | 20 | Medium | 4 | M247 Type 1 | 12 |
| 6 | 20 | Medium | 8 | M247 Type 1 | 12 |
| 7 | 20 | Medium | 12 | M247 Type 1 | 12 |
| 8 | 15 | Medium | 4 | M247 Type 1 | 12 |
| 9 | 20 | Medium* | 4 | M247 Type 1 | 12 |
| 10 | 20 | Medium** | 4 | M247 Type 1 | 12 |
| 11 | 20 | Medium*** | 4 | M247 Type 1 | 12 |
| 12 | 20 | Medium | 4 | MO Type P | 12 |
| 13 | 20 | Medium | 4 | M247Type 3 | 12 |
| 14 | 20 | Medium | 4 | 1.9 index Type 1@ | 12 |
| 15 | 25 | Large | 4 | M247 Type 1 | 12 |
| 16 | 25 | Large | 8 | M247 Type 1 | 12 |
| 17 | 25 | Large | 12 | M247 Type 1 | 12 |
| 18 | 20 | Large | 4 | M247 Type 1 | 12 |
| 19 | 15 | -- | -- | M247 Type 1 | 12 |
| 20 | 20 | -- | -- | M247 Type 3 | 12 |
| 21 | 15 | -- | -- | 1.9 index Type 1@ | 12 |
| Controls | |||||
| 23 | 3Mtm Stamarktm Wet Reflective Removable Tape Series 780 | ||||
| 24 | 3Mtm Stamarktm Extended Season Tape Series 380 | ||||
* = Only 2.4 index elements;
** = 50:50 blend of 2.4 index and 1.9 index elements;
*** = only 1.9 index elements;
@ = 1.9 index beads with the size distribution similar of M247 Type 1
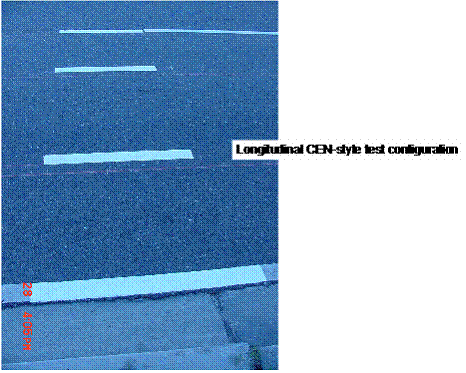
Figure 2. CEN-style test deck configuration on the New Orleans Highways for LIFE Test Deck.
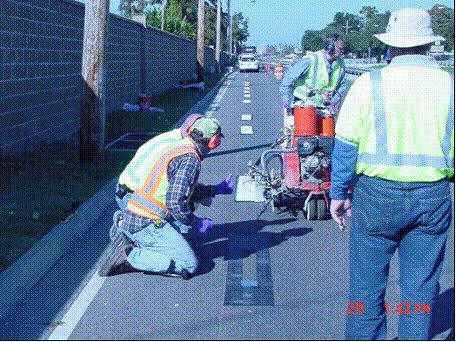
Figure 3. Illustration of test line installation procedure at Right Wheel track location.
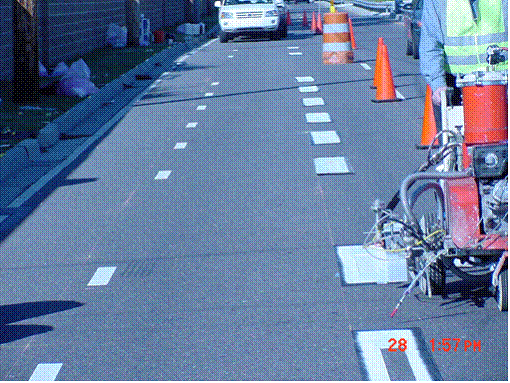
Figure 4. Illustration of paint line application showing masks used for 4" x 3' test lines
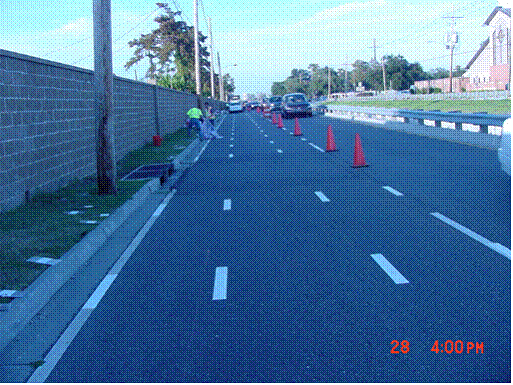
Figure 5. View of completed New Orleans test deck installation
The research team conducted initial and subsequent follow-up RL measurements on all of the test markings - prototypes and controls. The focus of the measurements was on the right wheel track location and the right edge line location. Our earlier similar installations indicate that these two locations represent the locations with the greatest and fewest number of wheel hits, respectively. RL was measured under dry, wet recovery and simulated rain conditions. Measurements were made following the procedures outlined in ASTM E1710 (dry), E2177 (wet-recovery), and E2176 (continuous wetting), as well as using a rain simulator designed to meet the requirements of EN1436. A view of our rain simulator is shown in Figure 6. Data collection efforts were in part designed to assess the measurement variability of different RL test methods, especially measurement of RL under continuous wetting method.
The data collection is completed. The analysis of the data will be conducted in the next reporting period.
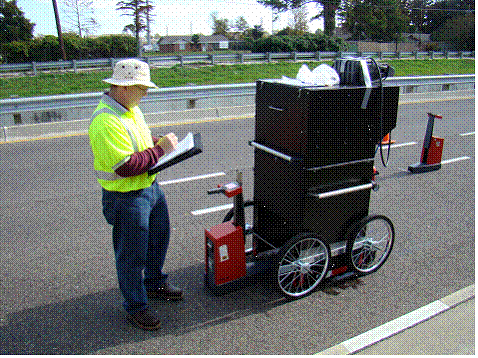
Figure 6. EN 1436 rain simulator
Planned Work for the Next Quarter
Within the next quarter, we have planned for the following tasks:
Retroreflectivity Data Analysis and Material Selection for the Field Experiment at TTI
The retroreflectivity data obtained in the New Orleans test deck had been analyzed in the succeeding quarter. We expected this analysis to provide us with insight on the durability characteristics of each pavement marking test sample. This data contained standard 30-meter retroreflectance [mcd/m2/lx] of each tested sample under dry and wet conditions (using a modified version of the standard continuous-wetting method with a more reasonable rain rate). The tests were conducted at different levels of traffic exposure, providing an outline for the degradation curve as a function of vehicle passes over the markings.
A comparison between sample markings at different exposure levels was performed and we expected some of the test markings to be found not suitable for further testing. We have chosen three test markings to be carried forward onto the field experiment.
Kick-off meeting with state agency representatives and TTI research team
The final execution of the subcontract will be immediately followed by a teleconference between 3M and TTI research team members. In addition, we will have a face-to-face meeting with TTI team in New Orleans at an American Traffic Safety Systems Association (ATSSA) meeting. The ATSSA venue will be timely and convenient to have the initial meeting not only with the TTI team, but also with state agency representatives. Two of the candidate states, Washington and North Carolina showed interest in participating in the project in Phase II, and will have representatives attending to the ATSSA meeting in New Orleans. This way, we intend to reduce our number of trips to each state for separate kick-off meetings. It is our understanding that some of the future work zones are already planned more than a year in advance, requiring us to get involved in the process early on.
Meeting with TTI research team at College Station for the development of the detailed experimental plan
3M team members will visit TTI facilities and team members to develop the detailed experimental plan for Task 2. Part of the plan development requires a set of test markings be installed in the rain range at TTI to assess feasibility of the conceived plan. It is our intent to evaluate a wide battery of test materials, yet we are limited in the available length of the rain range. An initial installation of viable test samples and a feasibility assessment from a visibility perspective is required for developing a sound and viable experimental plan.
For that purpose, we foresee a nighttime pilot experiment to determine the installation location of each test sample in the rain range to determine the maximum number of test samples that we can comfortably accommodate in the rain range, and the installation locations for the test samples for dry condition evaluation. This feasibility assessment took place during the week of February 18, 2008.
Problems Encountered
We have experienced delays in the contract execution for the project, which delayed the initiation of the project by nearly two months from the original plan. As a consequence, we could not perform the Task 1 test sample evaluations in Minnesota as originally planned due to typical early Minnesota snowfall. Instead, we decided to carry out the evaluation in a New Orleans test deck. Moving the operations to New Orleans required unplanned travel for personnel and shipping of equipment. However, relocating the work to New Orleans allowed us to maintain our overall 24 month timeline.
We initiated the subcontract process with TTI upon the execution of the primary contract with FHWA. Yet, the subcontract process also took longer than we expected. The contract with TTI did not get finalized until January 18. The discussions of Tasks and development of the detailed task plan could start only after the execution of the subcontract. As a result, the Task 2 test plan was delayed until February 29, 2008.
Overall, at this point, we had measurable progress toward project goals as planned, albeit with a nearly two-month shift in the overall project timeline.

