

Asphalt Binder Cracking Device to reduce Low Temperature Asphalt Pavement Cracking
APPENDIX D. ABCD USER'S MANUAL
- 12. Place samples into Cooling Chamber
- 12.1 Place the samples into the cooling chamber.
- 12.2 Connect the wires to the rings by lining up the red dot on the wire harness with the red dot on the ring.
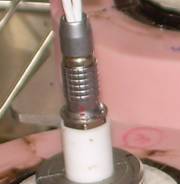
Step 12.2. Line up red dots on ring and wire harness.
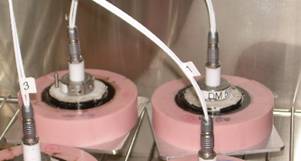
Step 12.2. Assemblies in chamber
- 13. Software for Data Collection
- 13.1 From the computer's desktop, double–click the "ABCD" icon. The "DAQ Configuration" screen (tab) should appear. DAQ means Data Acquisition.
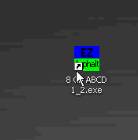
Step 13.1. Click on icon.
- 13.2 DAQ Configuration Tab
- 13.2.1 Make the screen full size by clicking on the Windows button in the upper right corner or grab the top of the window to bring the entire window into view.
- 13.2.2 Click the "Check Chamber Communication" button in the lower left corner. If the communication check fails, change the "Chamber Comm Port" from its dropdown menu. Click "Check Chamber Communication" again. Try again until the communication check returns a green light and the words "Communication was Successful" appear.
- 13.2.3 If not already the default, set the "Data Collection Update Rate" in the upper left corner to 10 seconds. This is the frequency of data collection (minimum value is 1 second).
- 13.2.4 Check that "Remove Initial Offset" is toggled toward "Yes".
- 13.2.5 Click the toggle for a 4–ring system or 8–ring system.
- 13.2.6 Check that "SG1 Scalar", "SG2 Scalar", etc. are set at 1.
- 13.2.7 Check that "SG1 Temp. Corr", "SG2 Temp. Corr", etc. are set at 0.
- 13.2.8 Check that "SG1 Load Corr.", "SG2 Load Corr.", etc. are set at 1.
- 13.2.9 Check that "RTD1 Offset", "RTD2 Offset", etc. are set at 0.
- 13.2.10 If you have 4 samples, "Display Plot" should have the green triangle on each toggle. If you only are testing 3 samples, then you can toggle off the 4th sample's plot. Likewise for an 8–ring system.
- 13.2.11If desired, edit other text fields such as "Project Name", "Sample ID", "Cooling Rate", "Operator", and "Ring Tag" identifiers. Note that editing the "Cooling Rate" field does not set the cooling rate. It is only used for the title block in the output.
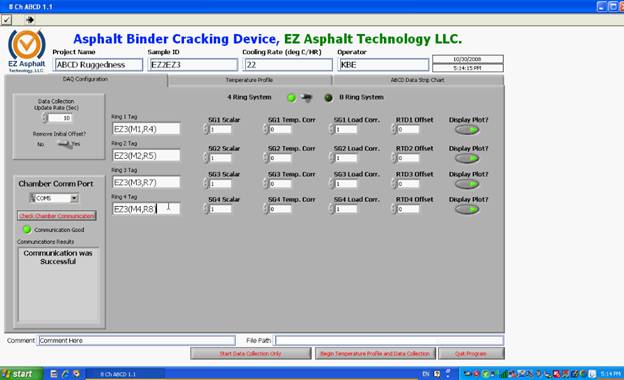
Step 13.2. DAQ (Data Acquisition) Configuration Tab. Binder being tested is the EZ3 binder. M1 is mold #1, M2 is mold #2 and so on. R4 is ring #4, R5 is ring #5 and so on. Your molds may have letters on them instead of numbers. This particular test was during the ruggedness testing and was conducted at a cooling rate of 22°C/hour instead of the standard 20°C/hour.
- 13.3 Temperature Profile Tab
- 13.3.1 Click on the Temperature Profile Tab.
- 13.3.2 Click the ?Get Temperature? button on the left side of the screen (in the Manual Operations section). The display will show the current temperature inside the chamber given by the chamber's temperature sensor. This is a different sensor than the sensors mounted inside each ABCD ring.
- 13.3.3 Underneath the "Set Temperature Set Point" button (located in the Manual Operations section on the left side of the screen), enter a temperature of 25 degrees C.
- 13.3.4 Click the "Set Temperature Set Point? button to accept the temperature you just entered.
- 13.3.5 Click the ?Modify Profile? button on the left side of the screen. Clicking this button will change its text to ?Accept Changes? and enable the fields below the profile chart to be editable. If the fields are already set as you want them (per the steps below), then you do not need to edit the fields.
- 13.3.5.1 The Amb Temp (Ambient Temperature) and Time Start fields cannot be changed.
- 13.3.5.2 Set Point 1 should be entered as 0 (i.e. zero °C). It is the temperature that the chamber will reach after the time set by Time Span 1.
- 13.3.5.3 Time Span 1 should be 0.5. This is 0.5 hours. It tells the chamber to achieve a temperature of 0C after 0.5 hours.
- 13.3.5.4 Set Point 2 should be entered as –60 (i.e. –60°C). It is the temperature that the chamber will reach after the additional time set by Time Span 2.
- 13.3.5.5 Time Span 2 should be entered as 3 (i.e. 3 hours). This is the time interval between Time Span 1 and Time Span 2. The chamber temperature of –60°C will be reached 3.5 hours into the test.
- 13.3.5.6 Set Point 3 should be entered as 25 (i.e. 25°C). It is the temperature that the chamber will reach after the additional time set by Time Span 3.
- 13.3.5.7 Time Span 3 should be entered as 0 (i.e. 0 hours). This tells the chamber to instantaneously raise the chamber temperature to 25°C after 3.5 hours.
- 13.3.5.8 Set Point 4 should be entered as 25 (i.e. 25°C).
- 13.3.5.9 Time Span 4 should be entered as 1 (i.e. 1 hour).
- 13.3.5.10 Set Point 5 should be entered as 25 (i.e. 25°C).
- 13.3.5.11 Time Span 5 should be entered as 0 (i.e. 0 hours). The chamber is warmed to 25°C after the test in order to reduce condensation on the rings when the chamber door is opened..
- 13.3.6 Click "Accept Changes" to lock the temperature and time settings you entered in steps 13.3.5.1 through 13.3.5.7. The chamber temperature profile will show graphically on the screen.
- 13.3.7 Click the ?Begin Temperature Profile and Data Collection? button located in the bottom right hand corner.
- 13.3.7.1 Type a data file name to be saved. The file extension ".xls" will automatically be added to the file name.
- 13.3.7.2 Click OK and the program will initiate the temperature profile and begin collecting data.
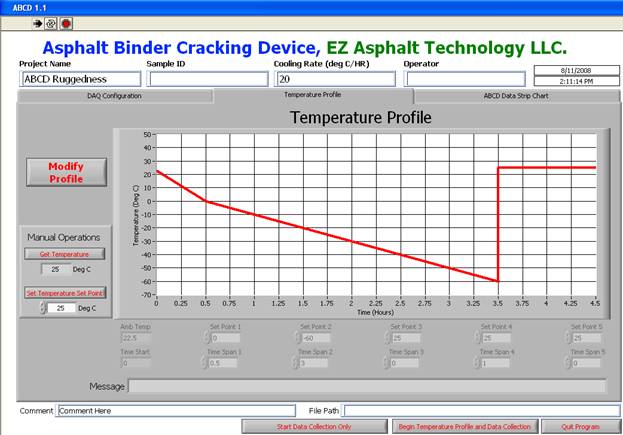
Step 13.3. Temperature Profile Tab for the standard 20°C/hour cooling rate. (–60°C over a 3 hour period as indicated by Set Point 2 and Time Span 2).
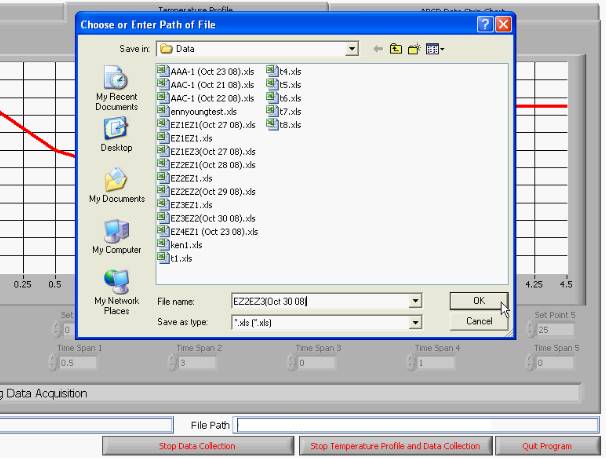
Step 13.3.7.1. Type file name. The ".xls" extension is automatically put on end of file name.
- 13.4 Click on the "ABCD Data Strip Chart" tab to monitor data collection.
- 13.4.1 The graphs are updated at the time interval entered in Step 13.2.3 above. The maximum value on the time scale on the x–axis automatically increases as more data is collected.
- 13.4.2 "SG1, RTD1" and so on are Strain Gage and RTD (Resistance Temperature Device) temperature values for each ring.
- 13.4.3 The data ranges on the left and right y–axis scales can be adjusted by clicking the maximum or minimum value and entering a different bound, but the defaults should be satisfactory.
- 13.4.4 The data collection will automatically stop when the temperature profile completes.
- 13.4.5 Stopping the program prior to performing the entire temperature profile.
- 13.4.5.1 Only done in unusual circumstances.
- 13.4.5.2 The program can be manually stopped at any time by clicking the ?Stop Temperature Profile and Data Collection? button located at the bottom right corner. The data up to that point has already been saved automatically.
- 13.4.5.3 The ?Quit Program? button is rarely used and will exit all ABCD programs and the temperature profile will stop. To restart, click arrow at the top left corner. You must then go to the DAQ Configuration tab and click the click the ?Check Chamber Communication? button again to be connected with the chamber.
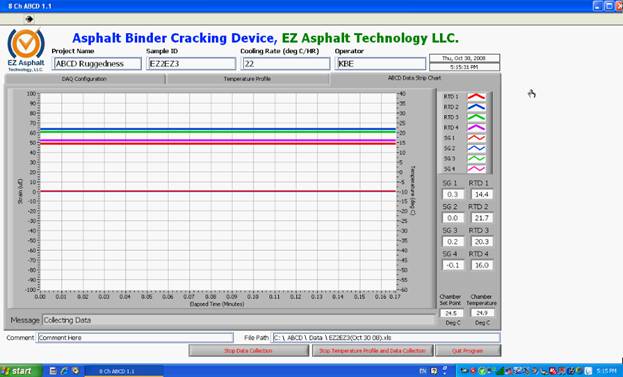
Step 13.4. ABCD Data Strip Chart tab at 0.17 minutes (10 sec) into a Test. The four ABCD ring strains all overlap at about 0 microstrains. The four ABCD ring temperatures are all slightly different at this early portion of the test, between 14.4 and 21.7°C. This particular test is conducted at a cooling rate of 22°C/hour. Your tests will generally follow the standard cooling rate of 20°C/hour.
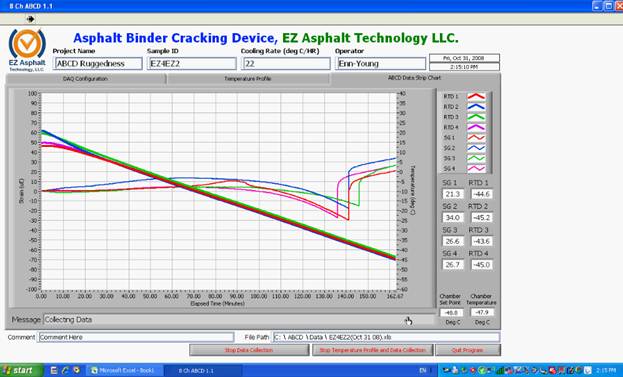
Step 13.4.4. ABCD Data Strip Chart tab at 162.67 minutes (2.71 hours) into a Test. The four binders all cracked between about 135 and 145 minutes into the test as indicated by the sudden strain jumps. The temperature of each of the four rings are indicated by the overlapping diagonal lines. The binders each cracked at around –33 to –36°C. The test should be continued until the entire temperature profile has completed so that the chamber temperature (and ring temperatures) rise to about 25°C. This helps to avoid condensation on the rings which occurs when the chamber door is opened while the chamber is still cold. Condensation on the rings reduces ring life.
- 14. Data Analysis
- 14.1 After the program has stopped running, it will automatically open an Excel spreadsheet containing all of the data collected.
- 14.2 Click the "ABC" icon located at the top of the window to run an analysis.
- 14.3 You will be prompted to enter a value for the strain jump.
- 14.3.1 A typical value is 5 (5 microstrains). However, a more appropriate value may be larger, such as 10 or 15. Discussion: The Strain jump is a sudden strain increase due to occurrence of cracking. The cracking temperature is determined to be the temperature at which the strain increase between two consecutive data points exceeds the user input value of "Strain Jump to Define Cracking" (default = 5 microstrain). Please check the reasonableness of the cracking temperature since data noise sometimes can be misinterpreted as the cracking temperature by the program. If this happens, you may need to analyze the data with a different strain jump. Or you may enter the cracking temperature manually.
- 14.3.2 Click OK and the analysis macro will run.
- 14.3.3 After analysis, the cracking temperatures, strain jumps, and graph of strain versus temperature will display.
- 14.4 The spreadsheet will automatically be saved in the location that was assigned in the Temperature Profile pane. You do not need to save it again even though it may ask.
- 14.5 File locations.
- 14.5.1 Raw data files have .xls extensions and are located in the "C:\ABCD\Data" folder which is accessed by double–clicking the ABCD folder icon on the computer Desktop.
- 14.5.2 Analyzed files have .xls extensions and are located in the "C:\ABCD\Analyzed Tests" folder which is accessed by double–clicking the ABCD folder icon on the computer Desktop.
- 14.5.3 The computers run Excel 2007 but the files are Excel 2003 format.
- 14.6 Please see Appendix for further discussion of data analysis.
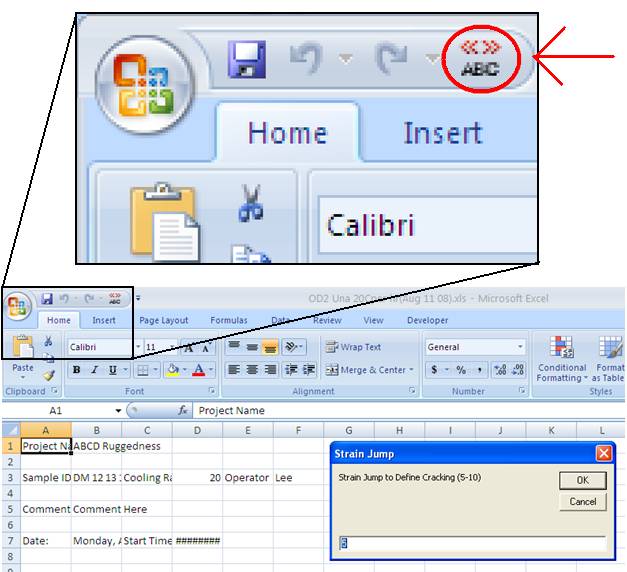
Steps 14.2 and 14.3. Excel spreadsheet. Location of "ABC" analysis icon. Srain jump pop–up window.
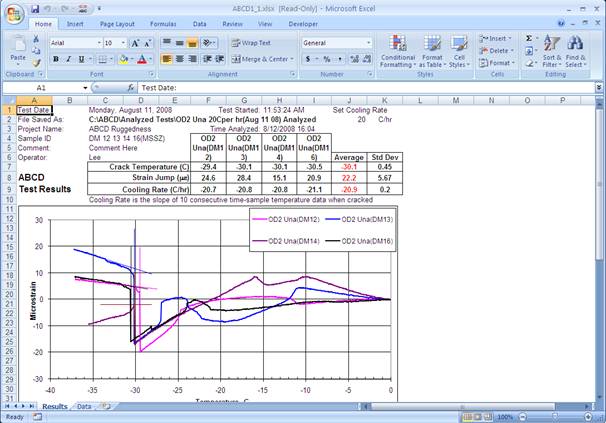
Step 14.3. Completed Data Analysis. Cracking temperatures, strain jumps, and graph of strain versus temperature. Note the temporary increase in strain for the blue curve at about –24°Cwhich is not the cracking temperature. The cracking temperatures are between –29.4 and –30.5°C as shown by the vertical profound strain jumps.