

Performance Evaluation of Various Rehabilitation and Preservation Treatments
Chapter 2. Inventory and Performance Data Collection
SELECTION OF TARGET STATES
To conduct this study, the team first identified target States from which to solicit data. The target States had to meet two critical criteria. The first criteria, and perhaps most important, is the State had to have a well developed pavement management system (PMS), or other information gathering system (e.g. Maintenance Management System) that has a majority of the necessary data in order to support this study. The second key criteria was to determine which of those States that have a robust information base also use a majority of the treatments presented in Table 1. Based on fixed project parameters, a maximum of six States were to be used for this study. These six States should have collectively used all of the treatments. Three projects for each type of treatment were desired from each of three States (total of 9 projects per treatment type). With twenty treatments, this equates to 180 projects. As much as possible, the projects were to be distributed across the four Long Term Pavement Performance (LTPP) climatic zones.
As a first step in narrowing down the target States, the project team conducted an extensive review of various reports and publications pertaining to the 20 treatment types. This literature review was conducted through searching online resources including, but not limited to, the Transportation Research Information Service (TRIS), Research in Progress (RIP) Database, American Society of Engineers (ASCE) library, Google, FHWA, American Association of State Highway and Transportation Officials (AASHTO) and State DOT web sites.
During this phase of the project, some of the key items the project team investigated were:
- Type of treatments used by a given State.
- The type and robustness of construction and pavement performance data available.
- Ability to determine life extension of the treatments as a function of pavement condition.
- Follow-up contacts.
It was observed that while there are many useful pieces of information in the literature regarding performance of these treatment types, they often did not contain enough specific information to be substantially useful for this study. Some of the challenges resulting from the literature review are contained in Table 2.
As a result, a shortlist of twelve target States was selected along with four backup States. The project team coordinated this effort with FHWA and narrowed this list to six target States and three backup States. Data collection from greater than nine States would have required a lengthy approval process. Of these nine States, six were able to provide information prior to the data collection deadline.
Figure 1 displays the geographic locations of the six target States (California, Kansas, Michigan, Minnesota, Texas, and Washington) from which data was received for this study.
| Data Collection Items | Issues Identified |
|---|---|
| Timing of application |
|
| Annual average daily traffic (AADT) and percent trucks on the pavement section |
|
| Distress types and values used to trigger treatments |
|
| Pavement condition rating before and after treatment has been applied |
|
| Extended pavement service life or structural life |
|
| Method used to determine the pavement life extension |
|
| Cost/lane mile that includes only pavement related activities |
|
| Source of information for "a" thru "g" (i.e. PMS, Maintenance database, flat files, etc.) |
|
| Experience of the contractor and DOT field personnel with this treatment |
|
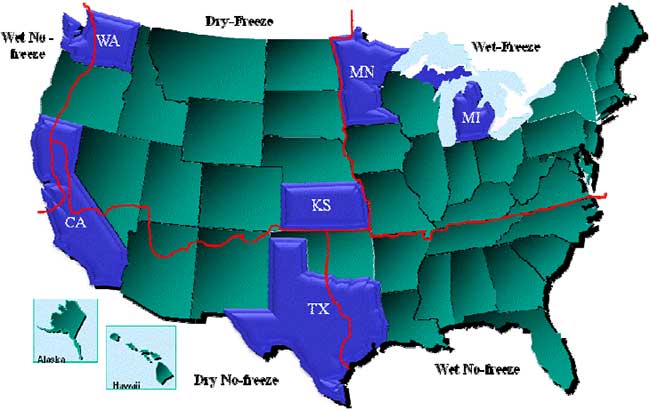
Figure 1. Drawing. Diagram of target states and LTPP climatic zone.
DATA COLLECTION METHOD
Based on the literature review and subsequent narrowing of the target State population, a data collection form and spreadsheet were developed to document the data needed from each State DOT. In order to effectively and efficiently collect required data from the targeted State DOTs, individuals that had knowledge about pavement preservation practices and procedures within each State were contacted to determine the State's interest in participating in this study (see table 3). Each State was receptive and offered to provide data for this project. The effort to pull this performance data from various data sources is not trivial and the study team extends its appreciation to those who contributed data. Appendix A provides an acknowledgement of the work of the individual States that participated in the study.
| State DOT | Contact Title |
|---|---|
| CA | Chief, Office of Pavement Preservation |
| KS | Pavement Management Engineer |
| MI | Pavement Management Engineer Capital Preventive Maintenance Engineer |
| MN | Preventive Maintenance Engineer |
| TX | Pavement and Materials Engineer |
| WA | Pavement Management Engineer |
To limit effort on the target States by asking an open-ended question such as, "Please provide us information on projects for these 20 treatments," pre-identification of projects with specific treatments in each State (to the extent possible) was conducted. Further, in order to obtain consistent responses from State DOTs the agencies were asked to complete a pre-formatted Maintenance and Rehabilitation Treatments Worksheet that contained a list of definitions and expected entries for the spreadsheet columns. The fields used for the worksheet are shown in Table 4.
A total of 256 projects from six target States collectively covering the specific 20 treatment types were collected which formed the basis for the performance evaluations in this study. Of the 256 projects submitted, seventy-one projects (28%) were subsequently not considered for further inclusion in the study due to a variety of factors, the most notable being the absence of extended service life information. Unfortunately, this resulted in the elimination of all California data. This resulted in a net of 185 projects. Each of these projects is identified by State, route number, and project length. The treatment year, pavement condition before and after treatment, etc. were reported, if available. The data collected from the States is contained in Appendix C. Figure 2 contains a summary of the number of States responding and the number of individual projects submitted by the States by treatment type.
| column Name | Definition | Typical Entry Example |
|---|---|---|
| Pavement Treatment Type | Treatments highlighted are known to have been actively used in your State and hence are requested. For other treatments, if relevant information is readily available, input those as well. | N/A |
| Route Number | List according to the definition in your State | SR 140, IS 95, etc. |
| Project Length Miles | If begin and end milepost are available, list as MPXXX~XXX; Otherwise directly list the length. | MP10.0 to MP 13.0 |
| Climatic Zone | Follow the definitions from the FHWA LTPP program, namely, Dry Freeze (DF), Wet Freeze (WF), Dry No-freeze (DNF), and Wet No-freeze (WNF). | DNF |
| Treatment Year | List the year, month would be preferred if available | 10-1995 |
| Last Rehab Year | The year when it was last rehabilitated, prior to this treatment being performed | 1986 |
| AADT/% Trucks | Preferably the traffic data at the treatment year. If traffic data is from other years, list the corresponding year (for example, 3260 (1996)). If AADT not available, use qualitative description (e.g. high traffic, low traffic) if applicable. | 11,000/8% |
| Distress Types and Values Used to Trigger Treatments | Textual description of reason for treatment. If specific values of distresses are not available, use qualitative description if applicable. Sometimes the treatment selections are based on research/business needs and project/funding availability, in this case, please specify. | Section experiencing severe rutting (> 2 inch). |
| PCR Prior | Pavement Condition Rating before treatment has been applied. Use performance index value(s) if available, otherwise use qualitative description. | 60 |
| Date of Survey | List the year for PCR prior, month would be preferred if available | 09-1994 |
| PCR After | Pavement Condition Rating after treatment has been applied. Use performance index value(s) if available, otherwise use qualitative description. | 85 |
| Date of Survey | List the year for PCR after, month would be preferred if available | 10-1996 |
| Extended Service Life | Extension of service life in terms of years of service associated with the treatment (service prior to next treatment - either maintenance or rehabilitation). If not available, use descriptive text regarding the performance improvement or estimate based on similarities observed on other projects. | 12 years |
| Method Used to Determine Pavement Life Extension | If no specific method is available, please specify whether it is visual observation/engineering judgment based, or no such pavement life extension definition exists in your State. | Performance Curve |
| Cost/Lane-mile, $ | Data is preferred on a lane-mile basis. For cost data that are in quantities, miles, or area based, if unable to be converted to $/lane-mile, list the original cost data as it is. | $100,000 / lane mile |
| Data Sources | Based on source of majority of information. Use five primary types of sources: PMS (Pavement Management System), MMS (Maintenance Management System), RP (Research Project), Flat File, or other (please explain if other). | PMS |
| Experience with Treatment | Experience of the contractor and DOT field personnel with this treatment (high, medium, or low). A high experience level is used for treatments that are consistently and routinely used in your State. A medium level of experience is used for treatments that are sometimes used in your State or treatments that have been used for five years or less, and low experience would be reserved for treatments not regularly used in your State or treatments in a pilot study mode. If available, list the approximate application history, i.e. how long the treatment has been used in your State. | High |
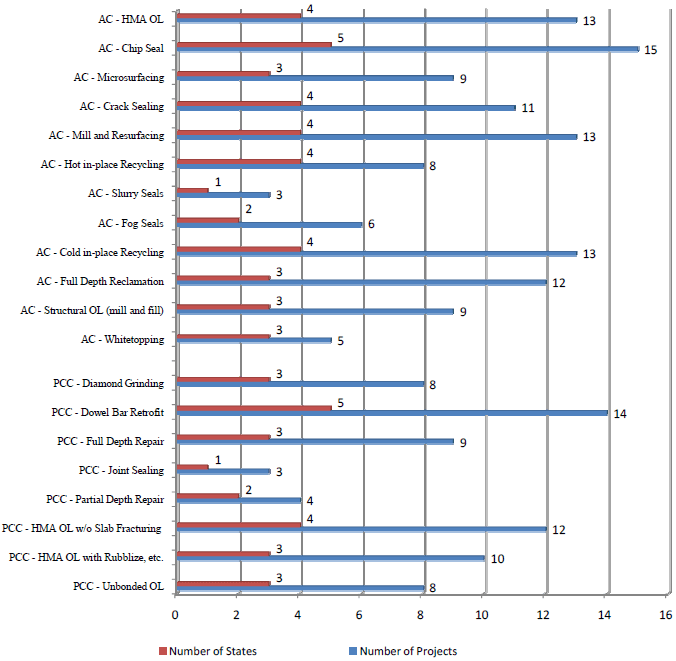
Figure 2. Chart. Number of States responding and number of projects identified.
It should be pointed out that, due to the limitation on the number of target States and the elimination of some submitted projects, other factors, several types of treatments did not have adequate data to meet the minimum three States with at least three projects per State criteria. This goal was met for 12 of the 20 treatments. Table 5 displays the resultant target State versus treatment data used in this study.
| Target State | Preventive Maintenance Treatments, Minor Rehabilitation and Major Rehabilitation for HMA and Concrete | |||||||||||||||||||
|---|---|---|---|---|---|---|---|---|---|---|---|---|---|---|---|---|---|---|---|---|
| H-P 1 | H-P 2 | H-P 3 | H-P 4 | H-P 5 | H-P 6 | H-P 7 | H-P 8 | H-P 9 | H-R 1 | H-R 2 | H-R 3 | C-P 1 | C-P 2 | C-P 3 | C-P 4 | C-P 5 | C-R 1 | C-R 2 | C-R 3 | |
| Kansas | 3 | 3 | 2 | 3 | 3 | 3 | 3 | 3 | 3 | 3 | 3 | 3 | ||||||||
| Michigan | 3 | 3 | 3 | 3 | 3 | 2 | 3 | 3 | 3 | 1 | 3 | 3 | 3 | 3 | 4 | 4 | ||||
| Minnesota | 3 | 2 | 3 | 3 | 3 | 3 | 3 | 3 | 1 | 3 | 3 | 3 | 1 | 3 | 3 | 3 | ||||
| Texas | 3 | 3 | 3 | 3 | 1 | 3 | 6 | 1 | 3 | |||||||||||
| Washington | 4 | 4 | 4 | 2 | 3 | 4 | 3 | 2 | 4 | 3 | 1 | |||||||||
| Code | Definition | code | Definition | code | Definition |
|---|---|---|---|---|---|
| H-P 1 | HMA Overlays | H-P 8 | Fog Seal | C-P 2 | Dowel Bar Retrofit |
| H-P 2 | Chip Seals | H-P 9 | Cold in-place Recycling | C-P 3 | Full Depth Repair |
| H-P 3 | Microsurfacing | H-R 1 | Full Depth Reclamation | C-P 4 | Joint Sealing |
| H-P 4 | Crack Sealing | H-R 2 | Structural Overlay (Mill and Fill) | C-P 5 | Partial Depth Repair |
| H-P 5 | Mill and Resurfacing | H-R 3 | Whitetopping | C-R 1 | HMA Overlay with Slab Fracturing |
| H-P 6 | Hot in-place Recycling | C-R 2 | Crack and Seat or Rubblize with Overlay | ||
| H-P 7 | Slurry Seal | C-P 1 | Diamond Grinding | C-R 3 | Unbonded Overlay |
Note 1: The gray shading in this chart denotes the treatment data used in this report. The number inside the shaded box denotes the number of projects utilized for a particular treatment/State combination.