U.S. Department of Transportation
Federal Highway Administration
1200 New Jersey Avenue, SE
Washington, DC 20590
202-366-4000
Conditions and Performance
Status
of the Nation's Highways, Bridges, and Transit:
2002 Conditions and Performance Report
|
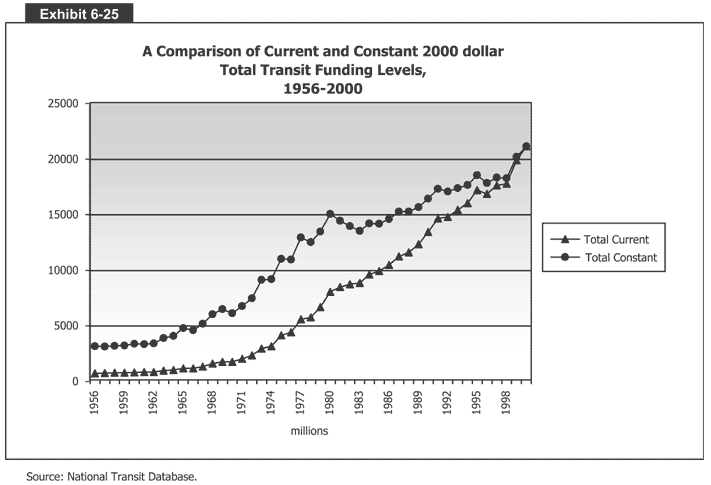
Exhibit 6-25:
A Comparison of Current and Constant 2000 Dollar Total Transit Funding Levels,
1956-2000
 Exhibit 6-25 is a chart that compares current and constant 2000 dollar total transit funding levels from 1956 to 2000. The vertical axis measures dollars from 0 to 25,000 million in increments of 5,000 million. The horizontal axis measures each year from 1956 to 2000 in increments of 3 years. The first line, for total constant dollars, starts out at about 3,000 million from 1956 to 1962, then rises gradually to about 15,000 million by 1980. There was a small decline to 13,000 million by 1983, but then it rises again gradually to a peak of 21,000 million by 2000. The other line, for total current dollars, roughly parallels the total constant line, but at smaller levels. It starts at about 2,000 million from 1956 to 1965, then rises gradually to 13,000 million by 1993. The only decline takes place in 1994, a marginal decrease, before rising again to a peak of 21,000 million in 2000.
Source: National Transit Database.
Back
to Chapter 6
Return to top
Page last modified on November 7, 2014
