


- Transit on Federal Lands
- Transit Requirements for USFS Lands
- Transit Requirements for DOI Lands
- Funding Sources
Transit on Federal Lands
Federal lands, which are composed of the U.S. Forest Service, the National Park Service, the Bureau of Land Management, and the U.S. Fish and Wildlife Service, account for about 27 percent of the land area of the United States, principally in the western part of the country. A brief description of each Federal land area is provided below, and where available, the number of visitors to each and the level and type of transit services in each area. As the number of visits to these sites increases, transit services will need to be put into place to preserve their scenic beauty and natural endowments. This chapter examines these transit investment needs. These investment requirements have been estimated outside the TERM framework and are not explicitly included in the investment needs reported in Chapter 7.
- U.S. Forest Service: The USFS (part of USDA) manages 151 national forests and 20 grasslands in 42 States, Puerto Rico, and the Virgin Islands. Forest service lands have a combined area of 192 million acres (Exhibit 20-1). The USFS was established to provide quality water and timber for the Nation's benefit, although parts of USFS areas are open for recreational use. Buses currently provide most of the transit services on Forest Service lands and are expected to continue to do so in the future.
- National Park Service: The NPS (part of DOI) currently manages 379 parks covering more than 81 million acres. More than 285 million people visit National Parks each year. In 2002, approximately 100 ATS were in operation in 90 NPS parks. These ATS include trolleys, rail systems, canal boats, ferries, tour boats, cable cars, snow coaches, trams, buses, and vans. Ten national parks are served by local public transit systems, and eight national parks own and operate their own public transit systems. Private operators manage the remaining transit services under contract to the NPS. In 2002, the NPS owned and operated about 600 vehicles used to provide transit services. Recent ATS projects on NPS lands include the introduction of a shuttle bus service to the most visited sites of Zion National Park in 2000 and theintroduction of historic touring buses in Glacier National Park in 2001. In FY 2002, the NPS and the FHWA set aside $11.7 million from the Federal Lands Highway Program (FLHP) for transit projects. Of the amount, $6.0 million went toward 23 planning projects and $5.7 million funded 12 implementation projects. In FY 2003, $14.1 million was set aside; $5.0 million went toward 17 planning projects and $9.10 million to 11 implementation projects.
| Millions of Acres |
Percent of Acreage | ||
|---|---|---|---|
| Total U.S. | Lower 48 States | ||
| U.S. Forest Service | 192 | 8.3% | 10.1% |
| National Park Service | 81 | 3.5% | 4.3% |
| Bureau of Land Management | 262 | 11.4% | 13.8% |
| U.S. Fish and Wildlife Service | 95 | 4.1% | 5.0% |
| Total | 630 | 27.4% | 33.2% |
- Bureau of Land Management: BLM (part of the DOI) holds 262 million acres located primarily in the western states and constituting one-eighth of the total U.S. land area. There are over 4,500 miles of National Historic, Scenic, or Recreational Trails, in addition to multiuse trails, through BLM lands. Visits to BLM sites are increasing as a result of the rapidly growing population in the west. Nearly two-thirds of the BLM-managed lands, located in the lower 48 states, can be reached by driving 1 hour or less from an urban area. In 2001, more than 62 million visits were made to BLM sites, 38 percent more visits than in 1991. Some BLM sites are experiencing traffic congestion and parking shortages at levels experienced by some major NPS sites. Particularly, the La Posa Long-Term Visitor Area along the Arizona-California border and its gateway community of Quartzite are severely congested as a result of the influx of northern retirees who visit these areas during the winter.
- U.S. Fish and Wildlife Service: The USFWS (part of DOI) manages approximately 95 million acres nationwide. This area is composed of over 570 national wildlife refuge and wetland management districts in the 50 states and territories. Most USFWS sites receive relatively few visitors, although the number of visits is increasing. There were 39 million visits to USFWS lands in 2001, compared with 27 million in 1995. In 2002, six transit systems and two ferry boats operated on USFWS lands. Some of the most heavily visited USFWS sites include the National Wildlife Refuge at Sanibel Island, Florida, and Santa Anna National Wildlife Refuge, Texas. Both of these sites offer transit services to improve accessibility and to reduce the negative environmental effects caused by excessive private vehicle travel.
Transit Requirements for USFS Lands
Transit services are needed in USFS lands because of increasing recreational demand and limited possibilities of expanding roadways and parking lots at a reasonable cost and without causing environmental degradation. USFS lands often surround National Parks and frequently surround or are adjacent to urban areas. This proximity offers the opportunities for transit services on USFS lands to connect with existing transit systems on other Federal lands or to be serviced by extending transit services from nearby urban areas. While transit systems on USFS lands could take advantage of the fact that urban transit systems require more vehicles during the week and USFS recreational areas require more vehicles during the weekend, vehicles used in urban areas are frequently unsuitable for use on USFS lands. Given the seasonal nature of transit service needs on USFS lands, the ATS study found that contracting these services from private providers was likely to be a cost-effective strategy. The ATS study concluded that the implementation of transit on USFS lands would
- Relieve traffic congestion and parking shortages;
- Enhance visitor mobility, accessibility, and safety;
- Enhance mobility and safety for local residents;
- Conserve sensitive natural, cultural, and historic resources;
- Provide improved interpretation, education, and visitor information services;
- Reduce pollution; and
- Diversify economics and help to improve economic development opportunities for gateway communities.
Transit investment needs include purchasing bus vehicles, trolley cars, tram vehicles, and waterborne vessels. They also include investment in maintenance facilities and ferry piers. Needed transit enhancements include parking facilities, connections with non-motorized trails, shelters and signage, and information services.
Thirty USFS sites were identified by the ATS study that would benefit from new or supplemental transit or transit enhancement investment. Six of these sites are located in Alaska, five are located in California, and two each are located in both California and Nevada. Three sites are located in the state of Washington, and one site was identified in each of the following states—Arizona, Colorado, Florida, Idaho, Illinois, Michigan, Montana, Nevada, New Hampshire, New Mexico, Oregon, Puerto Rico, and Wyoming. One site straddles Tennessee and Kentucky.
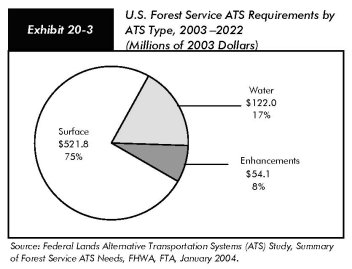
The ATS study estimated that, in 2003 dollars, a total of approximately $698 million ($687 million in 2002 dollars) is needed for the development of ATS in USFS lands between 2003 and 2022 (Exhibit 20-2). Of this amount, $522 million ($514 million in 2002 dollars) is estimated to be for surface transportation systems, $122 million ($120 million in 2002 dollars) for water transportation, and $54 million ($53 million in 2002 dollars) for transit enhancements, principally nonmotorized trails (Exhibit 20-3).
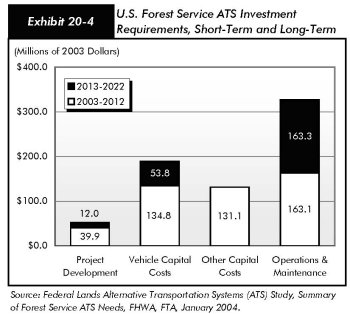
Estimated costs are $52 million ($51 million in 2002 dollars) for project development, $189 million ($186 million in 2002 dollars) for vehicle capital costs, $131 million ($129 million in 2002 dollars) for other capital costs, and $326 million ($321 million in 2002 dollars or $26.7 million annually) for operations and maintenance costs. Exhibit 20-4 shows these amounts broken down by time frame. Sixty-seven percent of this investment ($469 million) is estimated to be needed between 2003 and 2012, and 33 percent ($229 million) is estimated to be needed between 2013 and 2022.
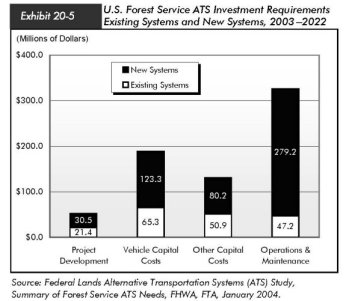
Exhibit 20-5 shows these future ATS investment needs allocated between existing and new systems. Twenty-six percent ($185 million) is estimated for existing systems and 74 percent ($513 million) for new systems.
| (Millions of 2003 dollars) | Short-term Costs | Long-term Costs | Total Costs |
|---|---|---|---|
| Surface Transit | $320.0 | $201.8 | $521.8 |
| Project Development | 21.6 | 6.1 | 27.7 |
| Vehicle Capital Costs | 95.6 | 40.6 | 136.2 |
| Other Capital Costs | 47.9 | 47.9 | |
| Operations & Maintenance | 154.9 | 155.1 | 310.0 |
| Water Transit1 | 102.9 | 19.1 | 122.0 |
| Project Development | 13.4 | 5.9 | 19.3 |
| Vehicle Capital Costs | 39.3 | 13.2 | 52.5 |
| Other Capital Costs | 50.2 | 50.2 | |
| Operations & Maintenance | |||
| Transit Enhancements | 46.0 | 8.1 | 54.1 |
| Project Development | 4.9 | 4.9 | |
| Vehicle Capital Costs | |||
| Other Capital Costs | 33.0 | 33.0 | |
| Operations & Maintenance | 8.1 | 8.1 | 16.2 |
| Total | 468.9 | 229.1 | 698.0 |
| Project Development | 39.9 | 12.0 | 51.9 |
| Existing Systems | 14.5 | 6.9 | 21.4 |
| New Systems | 25.4 | 5.1 | 30.5 |
| Vehicle Capital Costs | 134.8 | 53.8 | 188.7 |
| Existing Systems | 45.7 | 19.6 | 65.3 |
| New Systems | 89.1 | 34.2 | 123.3 |
| Other Capital Costs | 131.1 | 131.1 | |
| Existing Systems | 50.9 | 50.9 | |
| New Systems | 80.2 | 80.2 | |
| Operations Maintenance | 163.1 | 163.3 | 326.4 |
| Existing Systems | 23.6 | 23.6 | 47.2 |
| New Systems | 139.5 | 139.7 | 279.2 |
Transit Requirements for DOI Lands
As reported in the 2002 edition of this report, 136 of the 207 DOI sites visited for the first ATS study were identified as having transit investment needs. These were composed of 118 NPS sites, five BLM sites, and 13 USFWS sites. Transit needs include improving or expanding existing transit services and implementing new services. In most cases, transit needs were found to be modest and able to be served by a small number of vehicles operating on a seasonal basis.
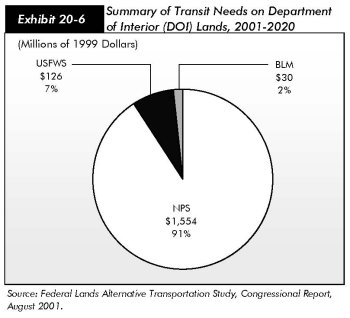
These 136 DOI sites were estimated to have 20-year transit investment requirements of $1.71 billion in 1999 dollars ($1.82 billion in 2002 dollars). NPS will require the largest transit investment, estimated at just under $1,554 million ($1,586 million in 2002 dollars), followed by USFWS with estimated needs of $126 million ($134 million in 2002 dollars), and BLM with $30 million ($32 million in 2002 dollars) (Exhibit 20-6). Of this amount, $1,337 million was estimated for investment in buses and rail/guideway (a very small percentage for rail/guideway), and 217 million for water transit services. While bus transit is, and will continue to be, the most common form of transit service on Federal lands, future water transportation needs also are expected to be significant. The majority of BLM transit needs, for example, are for waterborne systems. Chapter 27 of the 2002 C&P Report provides a more detailed summary of estimated ATS investment requirements on DOI sites. (Note: 1999 and 2003 dollars have been converted to 2002 dollars with the Gross Domestic Product chained price index reported in the Budget of the United States, FY 2005.)
Funding Sources
The majority of funding for transit services on Federal lands is allocated through State and local transportation authorities, but is not specifically targeted for transit programs on Federal lands. Transit programs on Federal lands are required to compete with other transit projects in the same State or local jurisdiction for Federal funds. A smaller percentage of funds is allocated to transit projects on Federal lands through the Federal Lands Highway Program (FLHP), which distributes funds exclusively to Federal Lands Management Agencies (FLMA). In the past, the bulk of FLHP funds has been used for future roadway and bridge projects and not for transit. As the funds needed to maintain roadways and bridges on Federal lands are likely to continue to exceed available FLHP funds, a limited amount of funding for transit programs is expected to come from this source in the future.
The ATS studies have identified a number of additional potential revenue sources for transit services on Federal lands. These include user fees, special use permits, private sponsorships, advertising, fund raising and contributions, and loans from State Infrastructure Banks.