

- Transit Investment Analysis Methodology
- Transit Economic Requirements Model
- TERM Investment Scenarios
- Description of Model
- Asset Rehabilitation and Replacement Module
- Asset Expansion Module
- Performance Enhancement Module
- Benefit-Cost Tests
- Projected Investment Estimate for Rural and Specialized Transit Service Providers
- Asset Deterioration Curves in TERM
- Vehicles
- Maintenance Facilities
- Rail Stations
- Rail Train Control, Electrification, and Communications Systems
- Guideway
Transit Investment Analysis Methodology
This appendix contains a technical description of the methods used to determine transit asset conditions (see Chapter 3) and to project transit investment estimates for the "Maintain" and "Improve" scenarios (see Chapter 7). This includes a description of the Transit Economic Requirements Model (TERM), the methodology used to estimate investment for rural transit and special service transit for the "Maintain" and "Improve" scenarios and the processes used to determine asset decay curves and the findings of the surveys undertaken since the 2004 C&P report.
Transit Economic Requirements Model
TERM estimates the physical conditions of U.S. transit assets, as reported in Chapter 3, and the total annual capital expenditures to be undertaken in all urbanized areas from Federal, State, and local governments to maintain or improve the physical condition and level of service of the U.S. transit system infrastructure. TERM also determines the allocation of projected investment among transit asset categories: vehicles; maintenance facilities; guideways; stations; and train control, electrification, and communication systems—over a 20-year period—and the sensitivity of the investment projections to variations in the rate of future growth in the demand for transit services.
TERM Investment Scenarios
TERM estimates projected transit capital investment separately for condition-related and performance-related investments. The main scenarios presented in this report are as follows:
- Maintain Conditions
- The Maintain Conditions scenario assumes that transit assets are replaced and rehabilitated over a 20-year period with the target of reaching an average asset condition at the end of the period (2024) that is the same as the asset condition that existed at the beginning of the period (2004). The model does not necessarily maintain the weighted-average condition of the assets in each year over the 20-year period because actual replacement and rehabilitation needs vary from year to year over this forecast period. Specifically, assets are rehabilitated and replaced as their condition falls below industry standards. These minimum condition levels vary according to asset type, and there are no constraints on the level of reinvestment in existing assets in any given period. With TERM, the average condition of the asset base improves significantly during the initial year of investment because the model addresses current backlog needs and then fluctuates between this improved level and the initial condition level, which is reached at the end of the 20-year period.
- Maintain Performance
- The Maintain Performance scenario assumes that investments are made in new vehicles and related fixed assets (maintenance facilities, stations, trackwork, etc.), as required to support the projected growth in the demand for transit services over the next 20 years. Here the model uses the projected increase in passenger miles traveled (PMT) as forecast by metropolitan planning organizations (MPOs) representing 92 of the Nation's largest metropolitan areas. TERM adds assets at a rate necessary to accommodate the increase in PMTs to achieve the base year (2004) level of average vehicle utilization and average vehicle speed at the end of the 20-year period (2024).
- Improve Conditions
- The Improve Conditions scenario assumes that the rehabilitation and replacement of transit assets is accelerated to improve the average condition of each asset type in the existing asset base to an average level of 4, or "good," by 2024. Assets are replaced at the same or a higher condition level than under the Maintain Conditions scenario, meaning that they are not allowed to depreciate as much before they are replaced. This scenario eliminates any backlog of deferred investments that are needed to reach a "good" condition level. Asset conditions make their most significant improvement in the first year and then trend downward gradually, with year-to-year variations, to an overall condition of "good" by 2022.
|
|
|
Do all assets reach a condition of 4 at the end of the 20-year investment period?
The capital investment estimated by TERM to be needed to improve conditions closely approximates 4 for all assets averaged together at the end of the 20-year investment period. Given the uneven age distribution for existing transit assets, some asset types may reach an average condition level of slightly less than 4 and some may reach a level of slightly more than 4. As discussed in Chapter 7, the average asset condition reached for the Improve Conditions scenario is estimated to be 3.7 across all asset types. To achieve a higher average condition level would require replacing vehicles and guideways too early in their useful lives.
|
- Improve Performance
- The Improve Performance scenario simulates capital investments that increase average operating speeds as experienced by passengers and lower average vehicle occupancy to threshold levels by the end of the 20-year period (2024). To improve the nationwide average operating speed, TERM replaces investments in bus vehicles and bus-related infrastructure with investments in rail vehicles and rail-related infrastructure or bus rapid transit (BRT) and related infrastructure in urbanized areas with average operating speeds below a specified minimum threshold. This minimum threshold is set as the average operating speed of all urban transit operators, less a specified fraction of the standard deviation of these operators' average operating speeds. TERM continues to shift from bus to rail or BRT investments until each of the operators in these urbanized areas has an average transit speed at or above this minimum threshold. To lower the nationwide vehicle occupancy rate, TERM makes investments by adding vehicles and supporting infrastructure by agency and by specific mode (e.g., motor bus) when these agency-specific modal services have vehicle occupancy rates above a maximum acceptable threshold level. This maximum is set individually for each mode at the national average occupancy rate for that mode, plus a specified percentage of the standard deviation of the occupancy rate for that mode for all operators. Investments are continued until there are no operators with occupancy rates above the maximum threshold levels. By expanding the level of investment in new fleet vehicles, investments to reduce occupancy also support increases in the frequency of transit service for high occupancy agencies.
Description of Model
TERM comprises four distinct modules:
- Asset Rehabilitation and Replacement Module. Reinvests in existing assets to maintain or improve their physical condition.
- Asset Expansion. Invests in new assets to maintain operating performance given projected increases in the demand for transit services; i.e., projected PMT.
- Performance Enhancement. Invests in new assets to improve operating performance as measured by speed and capacity utilization.
- Benefit-Cost Tests. Only investments with a cost-benefit ratio greater than 1.0 are included in the total amount of TERM's estimates of national transit investment. This process roughly corresponds to the "Maximum Economic Investment" concept in the National Bridge Investment Analysis System (NBIAS).
Asset Rehabilitation and Replacement Module
The Asset Rehabilitation and Replacement Module uses statistically determined decay curves to simulate the deterioration of the Nation's transit vehicles, facilities, and other infrastructure components. As these assets are used and as they age, their condition declines and eventually leads to investment for rehabilitation and replacement. (There is a section on describing the asset deterioration curves used by TERM in more detail starting on page C-9 at the end of the Appendix.)
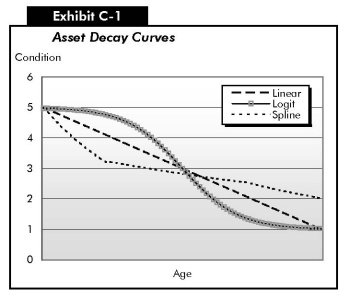
The vehicle, maintenance facility, station, and system decay curves in this module have been estimated on the basis of data collected by the Federal Transit Administration (FTA) through on site engineering surveys performed between 1999 and 2005. The surveys found that most assets depreciate rapidly in early years, followed by slower decay for an extended period through the asset's mid-life and, finally, a more rapid decline in asset condition toward the end of the asset's useful life. These newly estimated decay curves for vehicles, maintenance facilities, stations, and systems are in the form of "spline" regression models. [Exhibit C-1 compares the basic forms of a linear, spline, and logit function.] Data on the age of and for some assets on maintenance and use, collected by the National Transit Database (NTD) or FTA asset surveys, are used in conjunction with these curves to estimate their current and future conditions. Surveys of systems undertaken in 2005 achieved a 75 percent level of statistical accuracy. These surveys will continue through 2006. The 2008 C&P report will provide average condition estimates for each system asset based on a larger and more statistically significant sample of system assets. These decay curves are discussed in more detail in the last section of this Appendix.
The decay curves for guideway use "logit" function curves estimated using extensive data sets collected by the Regional Transportation Authority in Northeastern Illinois and the Chicago Transit Authority in the mid-1980s and 1990s.
These decay curve relationships are applied to a comprehensive inventory of the transit assets of the Nation's transit agencies. This asset inventory was initially developed in the 1990s when all major transit operators were asked to submit detailed listings of their transit capital assets. Since that time, the inventory has undergone periodic updates, primarily through vehicle data collected for the NTD. Over the period 2002 through 2005, the asset inventory was further updated using data collected through NTD's Asset Condition Reporting module and directly from transit agencies. In these recent surveys, transit operators were asked to list the assets they have in operation, as well as the type, age, purchase price, and—when available—quantity of each. The data that are received from each agency are reviewed for completeness and mapped and compared with the existing data in TERM. All data that are deemed reasonable are incorporated into TERM. This information has been converted to a 2004-dollar basis for use in this report.
TERM generates data estimates for agencies with missing data records on the basis of these agencies' characteristics, such as the number of vehicles, stations, track miles, and original years of construction. In 2005 this process was enhanced by developing a methodology to compare TERM's current asset inventory with the number of stations, facilities, and track miles by grade (at-grade, elevated, and subway) as reported to the NTD. This process takes NTD data on route miles, track miles, the number of crossings, maintenance facilities and stations for each agency mode reporting and develops a "base list" of assets that each transit mode must include to make operation feasible. This base is checked against the most recent generated assets data. Generated assets are assigned a "date built" value based on the asset, if known, or the initial date of service for each agency/mode and the asset's expected life.
TERM uses varying replacement scenarios for each of the five major asset categories. Multiple iterations of TERM are run until the "target" condition for each asset type is achieved at the end of the 20-year investment horizon. Under the Maintain Conditions scenario, the target condition for each of the five asset types is set to its initial level. In the Improve Conditions scenario, the target condition for each asset type is set to "good" (condition level 4). The user may also constrain TERM so that assets are not replaced before they have deteriorated to the point where they need replacement. These replacement thresholds are provided in Exhibit C-2. The minimum replacement threshold for guideway was raised to a rating level of 1.75 from a rating level of 1.5 used in earlier reports.
|
|
|
Why is the replacement threshold for guideways lower than for the other assets?
The replacement threshold for guideways is low due to their high estimated condition overall. This high average condition is the result of the very long life of these assets and the increase in rail investment in the 1970s. Guideway deterioration curves are based on the original set of data from Chicago and are the only assets with a decay curve in the form of a logit function. A great deal of the Nation's guideway elements, i.e., the investments undertaken since the 1970s, is located on the higher portion of the decay curve. This contributes to the higher estimated condition, which necessitates a lower replacement threshold. FTA is investigating the possibility of collecting more information on guideway condition and reestimating their decay curves. If the current guideway decay curves were replaced with a spline function, the functional form found to best approximate the decay of other transit assets, it is very likely that the condition of the Nation's guideways would drop, and the replacement threshold would be lowered.
|
| Maintain | Improve | |
|---|---|---|
| Facilities | 2.75 | 2.75 |
| Guideway | 1.75 | 1.75 |
| Stations | 2.75 | 2.75 |
| Systems | 2.75 | 2.75 |
| Vehicles | 2.64 | 2.75 |
Asset Expansion Module
The Asset Expansion Module identifies the level of investment that would be required in each major asset category to continue to operate at the current level of service as transit travel (PMT) increases; i.e., to maintain performance. TERM adds assets at a rate necessary to maintain current vehicle occupancy rates over the 20-year analysis period. Investments undertaken by the Asset Expansion Module during the first part of the 20-year forecast period are depreciated, rehabilitated, and replaced by the Asset Rehabilitation and Replacement Module as required.
TERM uses the most recent PMT projections from a sample of the Nation's MPOs, including those from the nation's 33 largest metropolitan areas. These are the most comprehensive projections of transit travel growth available. Projected passenger trips are used when projected PMT is not available and projected vehicle miles traveled (VMT) is used to estimate projected PMT for areas that forecast neither PMT nor trips. Although, intuitively, transit and passenger vehicles are substitutes; empirically, a positive relationship between VMT and transit travel exists. PMT is projected by adjusting VMT growth by a factor of 1.16 based on a regression analysis of 49 areas, projecting both VMT and transit travel. Transit travel growth rates for the urbanized areas for travel projections that were either unavailable or not collected were assumed to be equal to the average growth rate of an urban area of an equivalent population size located within that FTA region. The weighted-average transit PMT growth rate calculated from the MPO forecasts and used in TERM was 1.57 percent (compared with 1.5 percent in the 2004 C&P report), based on a survey of 92 agencies (compared with 76 agencies for the 2004 C&P report). Twenty-two of these agencies provided PMT projections, 27 provided projected passenger trips, and 43 provided projected VMT only. Ten urbanized areas used the same travel projections that were used for the 2004 report.
Performance Enhancement Module
The Performance Enhancement Module simulates investments that improve performance either by increasing average transit operating speed or reducing average vehicle occupancy rate. To raise speed, additional investment is undertaken in heavy rail if an area already has an existing heavy rail service. Otherwise, for areas with populations of over 1 million, additional investment is undertaken in light rail, if light rail exists. If there are bus services only, investment is shifted from bus to light rail. In areas with populations under 1 million, performance enhancements are made by shifting investment from regular bus to BRT unless there is already a rail operator. To reduce occupancy levels, additional infrastructure is purchased for areas and modes with vehicle utilization rates (occupancy levels) above the threshold level.
Benefit-Cost Tests
All investments identified by TERM are subject to a benefit-cost test. The Rehabilitation and Replacement and Asset Expansion modules apply a benefit-cost test to all investments on a by-mode and by-agency basis; i.e., these modules consider the value of investing in a particular transit mode by a particular agency, but do not evaluate the benefit of purchasing each piece of equipment separately or on the basis of the location where the investment will be made within each agency's operating area. In the case of transit, where investments comprise a wide range of capital goods, it is more practical to evaluate transit investments as a package.
In the Performance Enhancement module, investments to decrease vehicle utilization also are evaluated by agency and by mode, but investments to increase operating speeds are evaluated on an urbanized area basis rather than on an agency and modal basis to take into account the shift from bus to rail investments. TERM calculates and compares for each mode in each agency or, in the case of speed improvements for each urbanized area, the discounted stream of capital investment and operating and maintenance expenditures combined with the discounted stream of anticipated benefits accruing from the particular type of transit service investment being evaluated during a 20-year period. If the benefit/cost ratio is greater than 1.0, i.e., the discounted stream of benefits exceeds the discounted stream of costs, the model's estimate of the capital investment is included in the overall national investment needs estimate. If the benefit/cost ratio is less than 1.0, the investment is excluded.
The Benefit-Cost module identifies three categories of benefits:
- Transportation System User Benefits
- Travel-time savings, reduced highway congestion and delay, and reduced automobile costs (fuel, insurance, maintenance, depreciation, and parking) and taxi expenses.
- Social Benefits
- Reduced air and noise emissions, roadway wear, and transportation system administration.
- Transit Agency Benefits
- Reductions in operating and maintenance costs.
Whenever possible, the total level of benefits associated with each investment type is modeled on a per-transit PMT or per-auto VMT basis. Most of the benefits from transit investment are estimated by TERM to be transportation system user benefits and accrue to both new and existing passengers under both the Asset Expansion and the Performance Enhancement modules. Transit agency benefits—reduced operating and maintenance costs—are used to evaluate investments recommended by the Rehabilitation and Replacement and Asset Expansion modules, while social benefits—reduced air and noise emissions, roadway wear, and transportation system administration—are used to evaluate both Asset Expansion and Performance Enhancement investments.
Two revisions have been made to the benefit-cost data since the last report. First the benefit-cost test for performance enhancing investments was customized to provide a better reflection of the unique cost and ridership experience of each transit agency. The benefit-cost input parameters that are used to evaluate performance-enhancing investments (e.g., operating and maintenance costs, average fare and mode speed) are now specific to each agency mode. Prior to this change, the analysis used national modal averages for these parameters. These changes led to no changes in the Maintain Conditions and Performance scenario and led to a decline of roughly 10 percent in investments to improve performance. Secondly, the congestion delay cost used by TERM was reduced to accord more closely with the 1997 Highway Cost Allocation Study and the level of congestion by population stratum. Prior to this revision, the benefit-cost analysis had assumed a single measure of congestion for all agencies. These revisions led to a decrease in the amount of investments crossing the benefit-cost hurdle and a 22 percent reduction in investments to improve performance.
The benefit-cost analysis performed by TERM uses elasticities to measure the effect of changes in user costs on transit ridership that result from shifting from a private vehicle to transit or from reducing travel time by expanding the transit asset base either to increase speed or reduce occupancy levels (by increasing service frequency). This is only a first-order response. Any subsequent decreases in performance from the increased ridership and subsequent investments to meet this ridership are not considered. TERM assumes that these cost elasticities range from 0.22 to 0.40, depending on the mode. User cost elasticities are negative, reflecting an inverse relationship between ridership and costs. As ridership costs decrease, ridership increases.
Projected Investment Estimate for Rural and Specialized Transit Service Providers
Projected investment for rural providers is based on data collected in 2000 by the Community Transportation Association of America (CTAA). These data include the number and age of rural transit vehicles, according to vehicle type, such as buses (classified according to size) or vans. Projected investment is estimated by determining the number of vehicles that will need to be replaced in each year over the 20-year investment period, totaling them and multiplying by an estimated average vehicle purchase price based on information reported to FTA by transit operators for vehicle purchases in 2004. (These average prices are also used in TERM.) The number of rural vehicles that will need to be purchased to maintain/improve conditions is calculated by dividing the total number of each type of bus vehicle or van by its replacement age, with different assumptions made of the replacement ages needed to maintain or improve conditions. The replacement age to maintain conditions is assumed to be higher than the industry recommended replacement age because surveys have revealed that transit vehicles are often kept beyond their recommended useful life. The Maintain Conditions replacement age is calculated by multiplying the industry-recommended replacement age for each vehicle type by the ratio of the average age to the industry-recommended age of large buses. The Improve Conditions replacement age is assumed to equal the industry-recommended age, and small vehicles are all assumed to be replaced with higher-cost vehicles accessible to the disabled. The Improve Conditions scenario also assumes additional vehicle purchases in the first year to eliminate the backlog of overage vehicles. The number of vehicles necessary to improve performance was estimated by increasing fleet size by an average annual rate of 3.5 percent over the 20 year projection period. A 1994 study by CTAA, and more recent studies examining rural transit investment considerations in five states, identified considerable unmet rural transit needs in areas where there is either no transit coverage or substandard coverage. The assumed 3.5 percent growth in the rural vehicle fleet is less than half the 7.8 percent average annual increase in the number of rural vehicles in active service between 1994 and 2000. The rural investment estimates to improve performance provided in the 2002 and 2004 C&P reports also assumed a 3.5 percent average annual growth in the rural fleet.
Rural maintenance and administrative facilities investment needs are based on data collected in 2000 by the CTAA. These data include the information on the total maintenance facilities and percent of operators surveyed planning to expand their facilities, planning to replace their facilities, and planning to acquire facilities; data are also provided on the number of administration facilities, the percent that own their own facilities, and the percent that own their facilities and are dissatisfied with them. The amount needed to maintain the conditions and performance of rural maintenance facilities is calculated by multiplying the number of facilities that are planning to replace (maintain conditions) and expand (improve conditions) by an estimate of the cost. The amount needed to improve the performance of maintenance facilities was estimated as the number planning to acquire new facilities multiplied by an estimate of the cost. Maintenance facility replacement and acquisition costs are assumed to be the same and based on per-foot facility cost information from TERM. Maintenance facility expansion costs are assumed to equal 50 percent of replacement costs. The amount to improve the conditions of administrative facilities is calculated by multiplying the number of operators who own their facilities and are dissatisfied with them by an estimate of average administrative facility cost. Projected investment does not include amounts to maintain the conditions or improve the performance of rural administrative facilities. These needs will be relatively small.
Projected investment for special service vehicles, comprised principally of vans, is based on methodology similar to the one applied to estimate investment for rural vehicles. A replacement age of 7 years was assumed to maintain conditions and 5 years to improve conditions. The Improve Conditions scenario also assumes additional vehicle purchases in the first year to eliminate the backlog of overage vehicles. No projections were made for performance enhancements. The inventory of existing special service vehicles as estimated by FTA increased from 28,664 in 2000 to 37,720 in 2002. This study has not been updated; the 2002 value is used as a proxy for 2004 in this report. Investment projections for special service administrative and maintenance facilities have not been made due to a lack of information. These needs will be relatively small.
Asset Deterioration Curves in TERM
Vehicles
The FTA has found that the condition of transit vehicles can vary considerably even if they are the same age. Vehicle conditions depend on how well vehicles are maintained and the location in which they operate. Vehicles that are well maintained are generally in better condition for their age than vehicles that are not. Vehicles that operate in coastal areas or in areas where salt is extensively used to melt ice during the winter deteriorate more rapidly than vehicles that do not operate under these conditions.
As shown in Exhibit C-3, between 1999 and 2003, FTA inspected 1,110 transit vehicles. Each of these vehicles was assigned an overall level of condition based on a weighted average of the condition of its subcomponents. For example, in the case of commuter rail, for which the most recent inspections were made, the subcomponents that were examined included the couplers, frame, bolster, gearbox, pneumatic piping, and wiring and connections. Vehicle exterior and interior subcomponents also were rated.
| Vehicles | Number of Agencies | |
|---|---|---|
| Buses | 895 | 43 |
| 1999 | 572 | 31 |
| 2001-2002 | 323 | 12 |
| Commuter Rail | 93 | 9 |
| 2003 | 93* | 9 |
| Heavy Rail | 94 | 6 |
| 2000 | 92 | 5 |
| 2001 | 2 | 1 |
| Light Rail | 100 | 11 |
| 2000 | 28 | 5 |
| 2001 | 72* | 6 |
| Total Number of Vehicles Inspected | 1,182 |
and the number of light rail vehicles inspected has been reduced to 72 (from 74 in the 2004 C& P report).
Maintenance Facilities
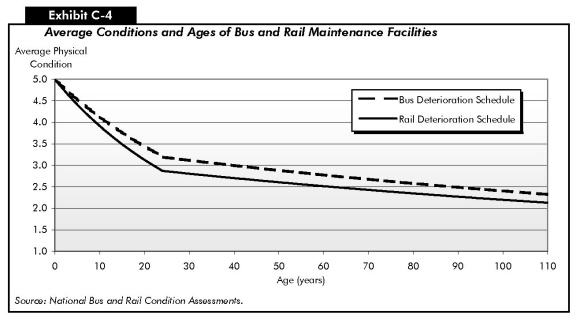
The deterioration schedules for maintenance facilities are based on 165 on-site maintenance facility surveys conducted at 45 rail and bus agencies between 1993 and 2003. Facility conditions were determined by the conditions of a range of facility components and subcomponents including roof structure, heating and ventilation systems, mechanical and plumbing systems, electrical equipment, specialty shops, and work bays and their subcomponents. Bus and rail maintenance facilities have similar, but not identical, deterioration schedules. The conditions of both decline mostly rapidly in the first 23 years of these assets' lives. During this time, facilities undergo relatively little major rehabilitation. After 23 years, they begin to undergo periods of rehabilitation, which leads to a very gradual deterioration over their remaining years. Bus maintenance facilities are, on average, in slightly better condition than rail maintenance facilities of the same age [Exhibit C-4].
Rail Stations
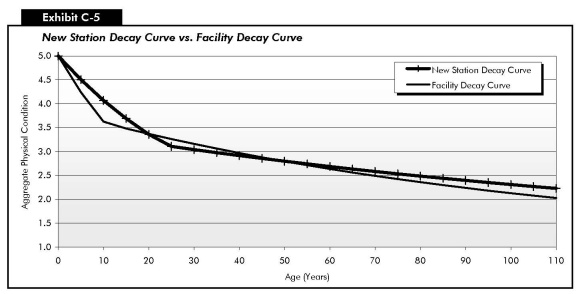
The deterioration schedules for rail stations have been revised based on on-site inspections of 94 heavy rail stations at 10 agencies and 41 light rail stations at 7 agencies conducted in 2004. Condition data were collected for up to 16 different categories of station assets (e.g., parking lots, building structure, electrical equipment) and between 4 and 20 different subcategories. The final station inspection samples provide a level of statistical accuracy close to 90 percent for heavy rail and close to 95 percent for light rail.
This station survey found that the deterioration schedules for stations was similar to the decay curve for maintenance facilities, which had been used to estimate station conditions in the prior two editions of this report [Exhibit C-5].
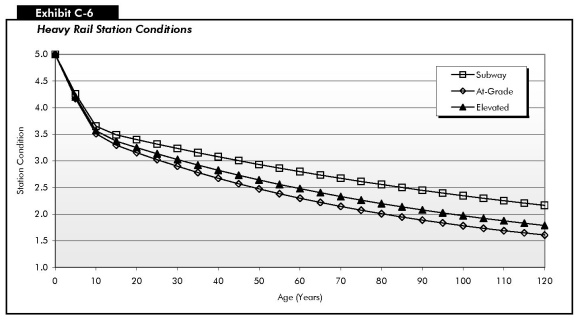
The on-site inspections revealed that the average condition of heavy rail stations was worse than the average condition of light rail stations, reflecting the lower average age of the Nation's light rail investments. Light rail stations were found to decay more slowly than heavy rail stations in the first 20 years of life and to be, on average, in better condition than heavy rail stations at any given age. However, average heavy rail conditions were found to be slightly better than previously estimated and average light rail station conditions slightly worse than previously estimated. After 10 years of age, subway stations are, on average, in better condition than elevated stations, and elevated stations are in better condition, on average, than stations at grade This is true both for light rail and for heavy rail. These relationships are shown for heavy rail in Exhibit C-6.
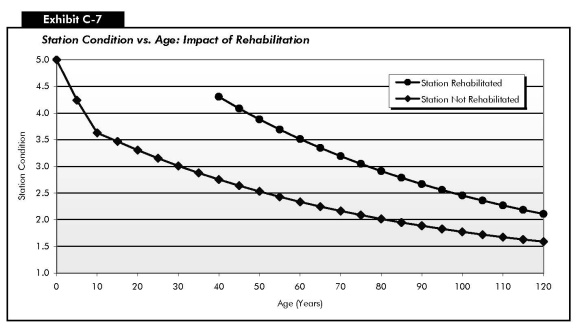
Stations more than 50 years old that had been rehabilitated were, on average, in considerably better condition than stations of the same age that had not been rehabilitated [Exhibit C-7].
No surveys were made of bus stations. Bus stations are assumed to have the same deterioration schedule as light rail stations.
Rail Train Control, Electrification, and Communications System
The deterioration curves for rail train control, electrification, and communications systems are based on on-site inspections conducted in 2005. Inspectors collected condition data for 41 track segments ranging from 0 to 100 years old from 7 different transit agencies. These inspections were conducted for each system—train control, electrification, and communications—by category and by segment. Train control centers were categorized as either a central instrument house or wayside equipment. Central instrument house components include the structure, power, environmental control, fire suppression relays, wiring, terminations, controller, event recorders, and data/voice communications systems. Wayside equipment includes signal, train stop, train ID, bond, loops, wiring, termination, and cable. Electrification systems were categorized as substations, third rail, and catenary. Substation components include the substation structure, high tension cables, AC breakers, and power: third rail has one component, the rail contact, and catenary has one component, the wire contact. Electrification systems were segmented into power transmission, transformation, rectification, control/indication, and track delivery. Communications systems were segmented into fiber optics, copper optics, wireless optics, equipment wiring, terminations, enclosures and environmental control. The surveys conducted in 2005 have a level of statistical accuracy of about 75 percent. These surveys are continuing in 2006 to raise this accuracy level.
Guideway
The condition of other guideway is estimated on the basis of decay curves relating condition to age; the decay curves for elevated structures and trackwork relate condition both to age and to use. This information is based primarily on rail asset information collected by the Chicago Transit Authority during the 1980s and 1990s for an Engineering Condition Assessment.