


Finance: Transit
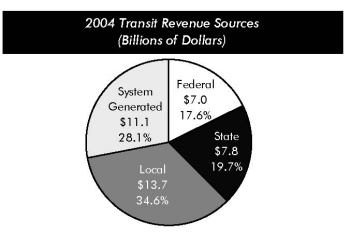
In 2004, $39.5 billion was available from all sources to finance transit capital investments and operations, compared with $36.5 billion in 2002. Transit funding comes from public funds allocated by Federal, State, and local governments and system-generated revenues earned by transit agencies from the provision of transit services. In 2004, Federal funds accounted for 18 percent of all transit revenue sources, State funds for 20 percent, local funds for 35 percent, and system-generated funds for 28 percent.
Eighty percent of the Federal funds allocated to transit are from a dedicated portion of the Federal motor-fuel tax receipts, and 20 percent are from general revenues. Federal funding for transit increased from $6.3 billion in 2002 to $7.0 billion in 2004, and State and local funding increased from $20.3 billion in 2002 to $21.5 billion in 2004.
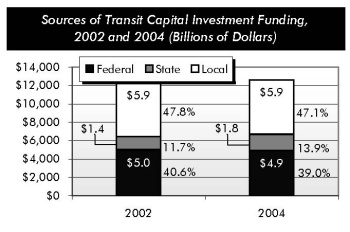
In 2004, $12.6 billion, or 32 percent of total available transit funds, was spent on capital investment. Federal capital funding was $4.9 billion, or 39 percent of total capital expenditures; State capital funding was $1.8 billion, or 14 percent of total capital expenditures; and local capital funding was $5.9 billion, or 47 percent of total capital expenditures. Between 2002 and 2004, Federal capital funding decreased by 1.3 percent and State and local capital funding increased by 5.4 percent.
In 2004, $4.0 billion or 32 percent of total capital expenditures was for guideway; $3.4 billion or 27 percent of the total was for rolling stock, $2.1 billion or 16 percent of the total was for systems, and $1.1 billion or 9 percent of the total was for stations.
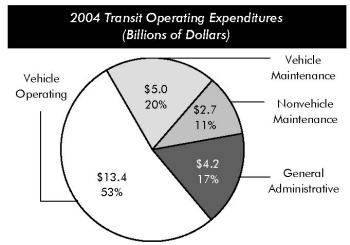
In 2004, actual operating expenditures were $25.4 billion. Vehicle operating expenses were $13.4 billion, 53 percent of total operating expenses and 35 percent of total expenses; vehicle maintenance expenses were $5 billion, 20 percent of total operating expenses and 13 percent of total expenses; nonvehicle maintenance expenses were $2.7 billion, or 11 percent of total operating expenses and 7 percent of total expenses; and general administrative expenses were $4.2 billion, or 17 percent of total operating expenses and 11 percent of total expenses.
In 2004, $26.9 billion was available for operating expenses, accounting for 68 percent of total available funds; the Federal government provided $2.0 billion or 8 percent of total operating expenses; State governments $6.0 billion or 22 percent of total operating expenses; local governments $7.9 billion or 29 percent of total operating expenses; and system-generated revenues $10.9 billion or 41 percent of total operating expenses.