


Sensitivity Analysis: Transit
Chapter 10 examines the sensitivity of projected transit investment to variations in the values of exogenously determined model inputs including passenger miles traveled (PMT), capital costs, the value of time, and user cost elasticities.
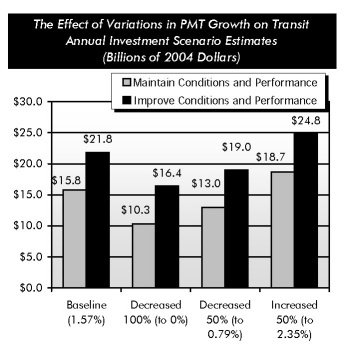
Sensitivity to Changes in Passenger Miles Traveled
The Transit Economic Requirements Model (TERM) relies on forecasts of PMT in large urbanized areas to determine estimates of projected investment in the Nation's transit systems for the "Maintain Performance" scenario (i.e., current levels of passenger travel speeds and vehicle utilization rates) as ridership increases and the "Improve Performance" scenario (i.e., increase passenger travel speeds and reduce crowding).
PMT forecasts are generally made by metropolitan planning organizations (MPOs) in conjunction with projections of vehicle miles traveled (VMT). The average annual growth rate in PMT of 1.57 percent used in this report is a weighted average of the most recent MPO forecasts available from 92 of the Nation's largest metropolitan areas. Transit investment estimates in the 2004 report were based on a projected PMT growth rate of 1.5 percent, based on projections from 76 MPOs. (PMT increased at an average annual rate of 2.29 percent between 1995 and 2004 and by 0.65 percent between 2002 and 2004.)
Varying the assumed rate of growth in PMT affects estimated transit investment both for the "Maintain" and "Improve" scenarios. A 50 percent increase/decrease in growth will increase/decrease the cost to maintain conditions and performance by 18 to 19 percent and the cost to improve conditions and performance by 13 to 14 percent. Investment estimated by both the "Maintain" and "Improve" scenarios would decrease significantly if PMT was assumed to remain constant.
Sensitivity to a 25 Percent Increase in Capital Costs
Given the uncertainty of capital costs, a sensitivity analysis was performed to examine the effect of higher capital costs on the projected transit investment. A 25 percent increase in capital costs increases the investment estimated by the Maintain Conditions and Performance scenario by 18 percent and increases the investment estimated by the Improve Conditions and Performance scenario by 15 percent.
Sensitivity to Changes in the Value of Time
The value of time is used to determine the total benefits accruing to transit users from transit investments that reduce passenger travel time. Variations in the value of time were found to have a limited effect on the investment estimates, since changes in the value of time have inverse effects on the demand for transit services.
Sensitivity to Changes in the User Cost Elasticities
TERM uses user cost elasticities to estimate the changes in ridership that will result from changes in fare and travel time costs, resulting from infrastructure investment to increase speeds, decrease vehicle occupancy levels, and increase frequency. A doubling or halving of these elasticities was found to have almost no effect on projected investment.