Chapter VII. Trip Purpose
The purpose of a trip—for example, traveling to work or visiting friends—greatly influences travel behavior and mode choice. This brief chapter discusses trip purpose, which provides the background for the two chapters on mode choice that follow.
All three versions of the national travel surveys that we analyze in this report ask respondents about the purpose of their trips. The 2001 and 2009 NHTS ask the respondent to select from one of thirty-seven options, including highly specific purposes like “meals: coffee/ice cream/snacks.”23 Respondents may also choose multiple purposes for a trip.
However, the 1990 NPTS is much less precise. First, it only gives respondents ten options for trip purpose, and also asks respondents for the main purpose of their trips. If a person travels to work and runs several errands along the way, the trip is recorded as a work trip only. Moreover, the 1990 survey classifies trip purpose based on the destination outside the home, regardless of origin or destination. For example, a person’s trip home from work is recorded as a work trip—again, even if the person ran several errands as well on the trip.
While the 1990 trip purpose data omit useful information, the data remain useful for comparing travel behavior over time. The 2001 and 2009 NHTS data files contain a recoded trip purpose variable compatible with the trip purpose variable in the 1990 NPTS. If a trip has multiple purposes listed, the place where the person spent the most time (e.g., the office) determines the purpose that appears in the recoded variable.
For purposes of our analysis, we designed four major trip purpose categories relevant for youth: family-related, shopping, work, and social. Table 26 lists the trip purposes used in the 1990 NPTS and our classification for each.
| 1990 Trip Purpose | Reclassified Trip Purpose |
|---|---|
| To/From Work | Work |
| Work-Related Business | Work |
| Shopping | Shopping |
| Other Family/Personal Business | Family |
| School/Church | Family |
| Medical/Dental | Family |
| Visit Friends/Relatives | Social |
| Other Social/Recreational | Social |
| Vacation | Not used in the analysis |
| Other | Not used in the analysis |
| N/A or Refused | Not used in the analysis |
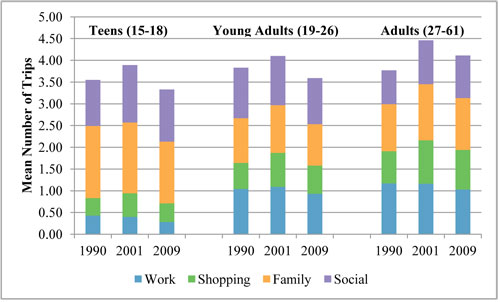
Some trips may fall into more than one major category. If a teenager travels to the mall and spends time with friends, for example, the trip will be a “shopping” trip despite the obvious social component. Likewise, some trips to school and church may be social trips if a teenager is participating in a group activity. Unfortunately, the limitations of the survey data make these analytical issues impossible to resolve. Table 27 and Figure 27 below illustrate average daily trips by age group classified by trip purpose. Family-related trips account for the largest share—roughly 50 percent of all trips for children and teenagers and 30 percent for others. Social travel is another important category—roughly 20 percent of all trips for adults and 30 percent for others. Work trips account for 25–30 percent of trips among young adults and adults and 10 percent of trips for teenagers and seniors. Finally, roughly 15–20 percent of trips are shopping trips, although that number rises to 30 percent for seniors.
While the number of trips has changed over the years—both due to changes in the economy and changes in the survey methodology—the relative share of trips for each category has remained remarkably stable over time. The main exception is the share of work trips for adults, which has declined from 31 percent in 1990 to 25 percent in 2009, in part because the share of social trips increased from 21 to 24 percent. Social trips have also increased from 30 percent to 36 percent for children.
| Work | Shopping | Family | Social | |||||
|---|---|---|---|---|---|---|---|---|
| Teen (15–18) | ||||||||
| 1990 | 0.43 | 12% | 0.40 | 11% | 1.66 | 47% | 1.06 | 30% |
| 2001 | 0.40 | 10% | 0.54 | 14% | 1.63 | 42% | 1.32 | 34% |
| 2009 | 0.28 | 8% | 0.43 | 13% | 1.42 | 43% | 1.20 | 36% |
| Young Adult (19–26) | ||||||||
| 1990 | 1.04 | 27% | 0.60 | 16% | 1.03 | 27% | 1.16 | 30% |
| 2001 | 1.09 | 27% | 0.78 | 19% | 1.10 | 27% | 1.13 | 28% |
| 2009 | 0.93 | 26% | 0.65 | 18% | 0.95 | 26% | 1.06 | 30% |
| Adult (26–61) | ||||||||
| 1990 | 1.17 | 31% | 0.74 | 20% | 1.08 | 29% | 0.78 | 21% |
| 2001 | 1.16 | 26% | 1.00 | 22% | 1.29 | 29% | 1.01 | 23% |
| 2009 | 1.03 | 25% | 0.91 | 22% | 1.19 | 29% | 0.98 | 24% |
Figure 27: Average Daily Trips by Age Group (1990, 2001, and 2009)