U.S. Department of Transportation
Federal Highway Administration
1200 New Jersey Avenue, SE
Washington, DC 20590
202-366-4000
Under subcontract to Battelle Memorial Institute
Subcontract no. 208937 to work order BAT-03-21
for the
Federal Highway Administration
U.S. Department of Transportation
October 2007
PDF Version of This Report [146KB] ![]()
PDF Files may be viewed with Adobe Acrobat Reader
The study reaches two conclusions using several different national income accounting measures:
National income accounting measures do not include spillovers, multiplier effects, or the use of highways by other than business or the government. Accordingly, the contribution estimates produced in the report are small compared to many alternative estimates. However, they can be directly compared to Bureau of Economic Analysis (BEA) contribution estimates.
This is the first time the contribution of highways to economic growth has been estimated using this method. In a report released in January of 1999, Barbara Fraumeni estimated productive highway capital stocks from 1929-1995.1 The current study presents revised and updated the productive highway capital stocks through 2005 and estimated the contribution of highways to economic growth.
The study presents two conclusions about the revised and updated productive highway capital stocks:
An experimental bridge stock is estimated. It results in a small, although significant, difference in the rate of growth of the productive highway structure capital stock.
Volume II of this report is a "cookbook" which describes in detail how the stock and contribution estimates are constructed.2
The productive highway capital stocks measure potential productive capacity. There is no stock utilization adjustment except in construction of pavement curves. (Utilization and other factors might affect the rate of return to the stock.)
Highway capital outlays are disaggregated into:
by
and by
The split of outlays differs year-by-year reflecting changes in how capital outlays are spent.
Net efficiency pavement curves, constructed from pavement curves, measure how productive pavements could be. This productive capacity is reduced if pavement conditions reduce speed or increase motor vehicle operating cost.
The report constructed productive highway capital stocks with a perpetual inventory method. State and Local Systems have a 1921 benchmark. Interstates have a 1958 benchmark from highways transferred from the State System. ROW has an infinite life; therefore zero depreciation. Pavement has a design life of 20 years and depreciation from the net efficiency curves. Grading has an 80-year life and one-Hoss-Shay depreciation. Structures have a life of 50 years and a geometric depreciation rate of 1.82 percent. (The structure assumptions are the BEA's assumptions for government non-defense, non-industrial buildings.)
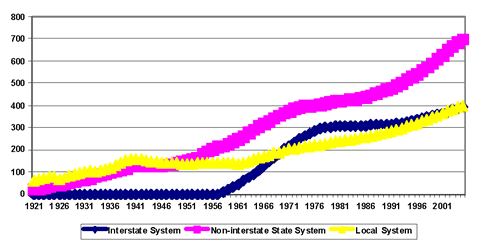
The following graphs the productive highway capital stocks for the Interstate, Non-interstate State, and Local Systems. By 2005, in 2000 dollars the total stock is close to $1.5 trillion.
The report estimate three types of contributions:
Each of these contributions is an approximate contribution.
Approximate contributions are a weighted rate of growth. The weights are nominal shares of:
The rates of growth are rates of growth of 2000 dollars for:
The first listed weight is multiplied times the first listed rate of growth to produce the first listed contribution; the second listed for the second, and so forth. In the majority of years, the weights and the rates of growth are small; accordingly the contributions are small.
Highway capital outlays in 2000 dollars are highly variable and their rate of growth is less than the rate of growth of GDP. The following graph begins in 1950 as in some earlier years the rate of growth of highways capital outlays are almost 70 percent and -90 percent, swings that hide more normal variations.
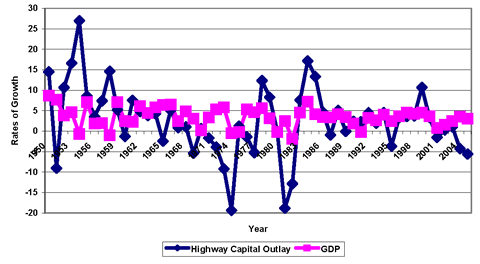
Over the period shown the average annual rate of growth of highways capital (2000 dollars) outlays is 2.5 percent and the annual rate of growth of GDP is 3.5 percent.
Nominal capital input is equal to the sum of net return and depreciation. Net return is equal to the net own rate of return times lagged capital stock. For highways, net own rate of returns for all government (4.4 percent) and all private assets (11 percent) are derived from BEA's recent report on R&D.3 The study estimates three rate of return scenarios:
BEA and the Bureau of Labor Statistics (BLS) assume that the net own rate of return for all government assets is zero. Accordingly the estimated capital input and gross output contributions, GDP and U.S. gross output are adjusted upwards. (BLS is the source for the U.S. gross output data.)
Highway gross output is equal to the sum of highway capital input and other than capital outlays on highways.
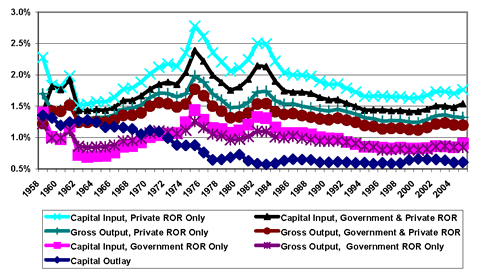
The following graphs the shares in the weighted rate of growth contribution formula.
The table below shows that the rate of growth of GDP is higher than any measure of the growth in highways (all in 2000 dollars). The table and graph below begin in 1959 as all measures are available for these years.
| Capital Outlay | 1.28 |
| Capital Input (Capital Stock) | 3.00 |
| Gross Output Government Net Own ROR only |
1.85 |
| Gross Output Government & Private Net Own ROR |
2.17 |
| Gross Output Private Net Own ROR Only |
2.25 |
| GDP | 3.34 |
The final chart graphs the highway contribution estimates. The analysis excludes the contribution of capital outlay to GDP growth from the graph because its high degree of variability makes the graph difficult to read.
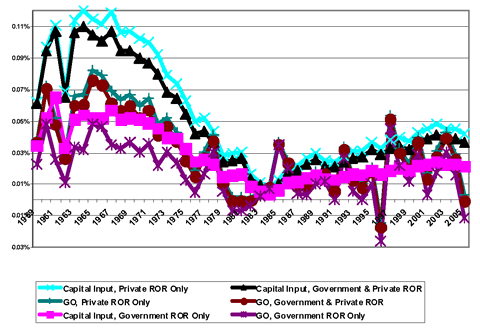
The contribution of highway capital input to adjusted GDP using a private net own rate of return for all assets is largest in most years. The contribution of highway gross output to adjusted U.S. gross output using a government net own rate of return for all years is smallest in most years. In all years the contributions are small except in the few years when the rate of growth of capital outlays is high. (These years are not shown.) The contribution estimates are small because the shares and rates of growth are small.

