U.S. Department of Transportation
Federal Highway Administration
1200 New Jersey Avenue, SE
Washington, DC 20590
202-366-4000
Receipts from the federal taxation of motor fuel, along with other highway-user taxes, are deposited in the federal Highway Trust Fund. Taxes on highway users benefit them by providing for the improvement of highway facilities. The Highway Trust Fund has provided a stable funding source for highway programs since it was established in 1956.
Table 6-1: Federal Highway User Fees
| Gasoline | 18.4 |
| Gasohol | 18.4 |
| Diesel and Kerosene | 24.4 |
| Special Fuels | |
| Liquefied Petroleum Gas | 13.6 |
| Liquefied Natural Gas | 11.9 |
| Other Special Fuels | 18.4 |
| Tires | Tax is imposed on tires sold by manufacturers, producers, or importers at the rate of 9.45 cents (4.725 cents in the case of a bias ply or super single tire) for each 10 pounds of the maximum rated load capacity over 3,500 pounds. |
| Truck and trailer sales | 12 percent of retailer's sales price for tractors and trucks over 33,000 pounds gross vehicle weight (GVW) and trailers over 26,000 pounds GVW. The tax applies to parts and accessories sold in connection with the vehicle. |
| Heavy use vehicles (annual fee) | Trucks 55,000–75,000 pounds GVW, $100 plus 22 for each 1,000 pounds (or fraction thereof) in excess of 55,000 pounds. Trucks over 75,000 pounds GVW, $550. |
Data Source: FHWA OHPI, Highway Statistics
The federal Highway Trust Fund includes federal fuel tax revenue and other fees. The federal gas tax rate last changed in 1996.
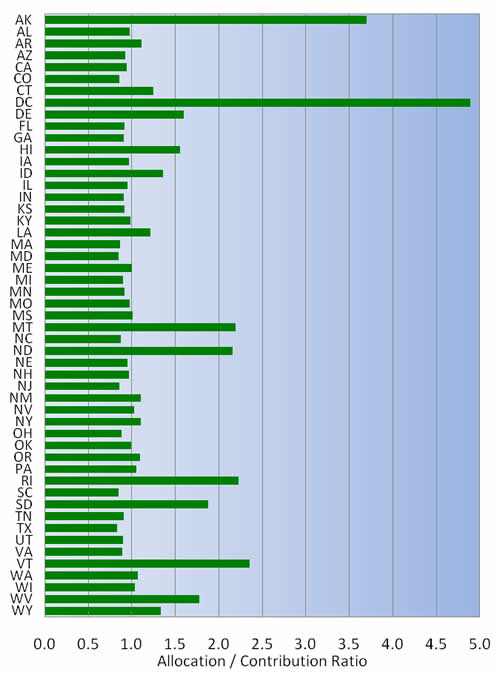
Figure 6-1: Ratio of Relative Trust Apportionments / Allocations to Relative Trust Fund Payments: 2009
Data Source: FHWA OHPI, Highway Statistics
Each state's highway users contribute to the federal Highway Trust Fund (HTF) by paying motor fuel taxes. These are subsequently allocated to each state from the HTF. A ratio may be calculated that compares the funds paid by motorists within each state with the state's total apportionments and allocations from the HTF.
With this calculation a ratio of 1.0 indicates that a state receives the same amount of apportionments and allocations from the HTF as its highway users contribute in motor fuel taxes. A ratio of less than one indicates that the state receives the less in apportionments and allocations from the HTF than its highway users contribute in motor fuel taxes, while a ratio of greater than one indicates that the state receives the more in apportionments and allocations from the HTF than its highway users contribute in motor fuel taxes.
In 2009 the range of allocation-to-payment ratios for all states is between 0.84 and 3.7 (excluding the District of Columbia). Twenty seven states have ratios less than 1.0, with the remaining 23 states having ratios greater than or equal to 1.0. The median allocation-to-payment ratio for all states is 0.98.
Note: The District of Columbia contributes to the Highway Trust Fund, though territories do not.
Figure 6-2: Highway Trust Fund Receipts: 1970-2009
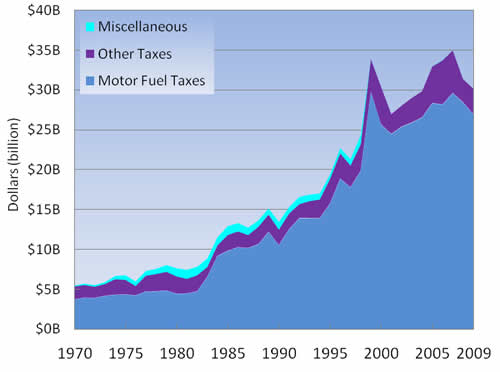
The Highway Trust Fund (HTF) revenue comes from fuel, truck, and tire sales taxes. Tax rates have changed several times since the fund was established. Federal motor fuel taxes are collected by the Internal Revenue Service at the fuel terminal, and vary with changes in the volume of fuel sold.
Total federal HTF receipts are $30.1 billion in 2009. This is a decrease of $1.2 billion (4 percent) from 2008 receipts. Of the amount collected in 2009, $27 billion (89 percent) comes from motor fuel taxes and $3.2 billion (11 percent) comes from other taxes, such as on truck and tire sales. Between 1970 and 2009 HTF receipts increased at a compounded annual rate of 5.1 percent, though since 2007 HTF receipts have decreased.
Figure 6-3: Highway Funding and Expenditures by Local, State, and Federal Government: 1970–2008
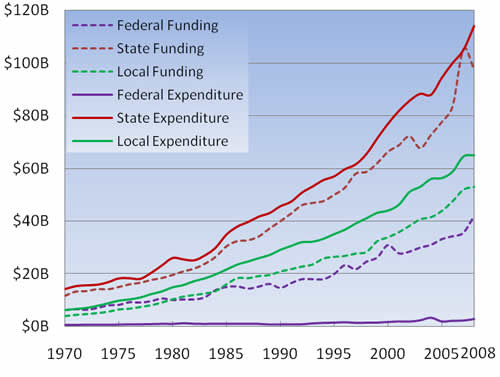
Data Source: FHWA OHPI, Highway Statistics
Total highway funding by all units of government–federal, state, and local–reached nearly $193 billion in 2008, the latest year for which data are available. The vast majority of federal funds are transferred to state highway agencies as part of the federal-aid highway program. Approximately $2.9 billion in federal expenditures are spent on roadways within national parks, military installations and on other federally owned land.
States disbursed a total of $143.8 billion for highways in 2009. State disbursements for highways track closely with population. The states with the highest disbursements for highways–which also have the largest populations–are California, Florida, Illinois, New York, Pennsylvania, and Texas, each spending over $5 billion in 2009. Combined these six largest states account for 40 percent of total state highway disbursements.
Capital outlays–which include costs associated with land acquisition, design, construction, reconstruction, resurfacing, rehabilitation, restoration, and installation of guard rails, fencing, signs, and signals–account for the largest category of disbursement in most states, a total of $71.2 billion (49 percent of total state highway disbursements). Maintenance costs total $21.7 billion (15 percent of total state highway disbursements), while transfers of funds to local governments total $18.7 billion (13 percent of total state highway disbursements). Service costs associated with borrowing funds for highway, road, and street projects total $14.4 billion (10 percent of total state highway disbursements); research and administration disbursements total $9.5 billion (7 percent of total state highway disbursements); and enforcement and safety disbursements total $8.3 billion (6 percent of total state highway disbursements).
Figure 6-4: State Disbursements for Highways by Type: 2009
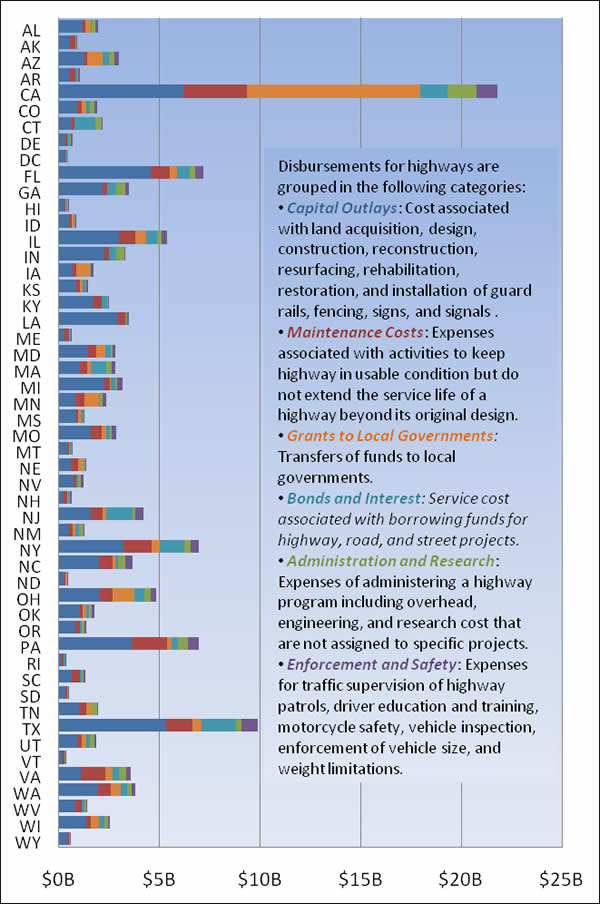
Figure 6-5: State Disbursements for Highways by Type as Percentage of Total: 2009
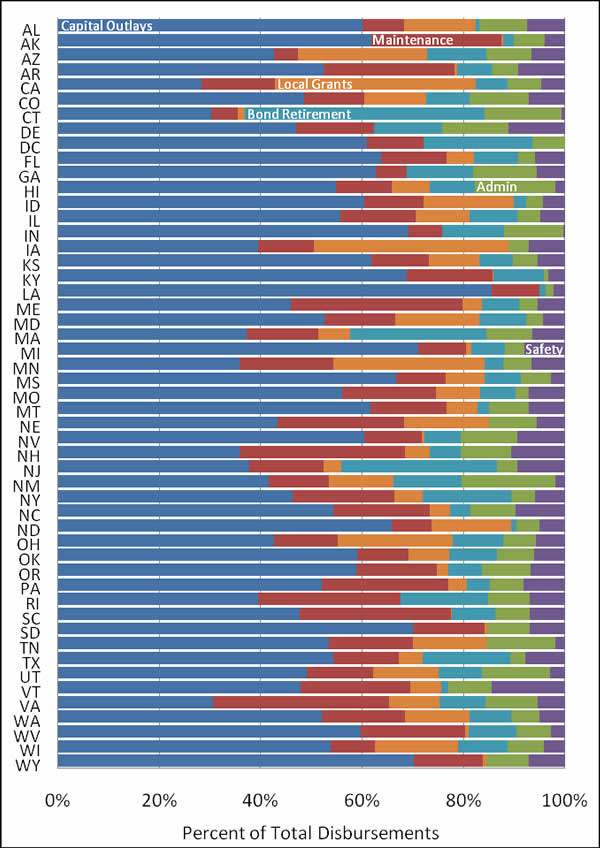
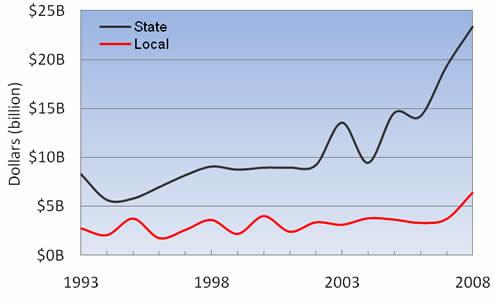
Figure 6-6: Toll Facility Revenue: 1993-2008
Data Source : FHWA OHPI, Highway Statistics
Toll revenue is typically the only funding source used to repay money borrowed to construct a toll facility and to provide for its ongoing maintenance and operations. In 2008, the most recent year for which data are available, $29.8 billion in state and local toll revenues were collected. Of this $23.4 billion (79 percent) were from state tolls and $6.4 billion (21 percent) were from local tolls.
State and local combined toll revenue in 2008 is $6.8 billion higher than in 2007, an increase of 29 percent. Over the last 15 years, toll revenue has increased at a compounded annual rate of 6.8 percent.
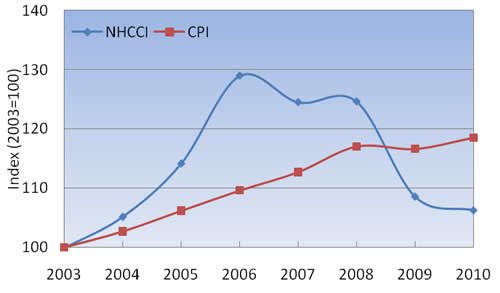
Figure 6-7: Highway Construction Price Trends and Consumer Price Index: 2003-2010
Data Source: FHWA OHPI. Note: The Consumer Price Index is compiled by the Bureau of Labor Statistics and is based upon a 2003 Base of 100.
The Consumer Price Index (CPI) is a measure of price changes over time. Computed by the Bureau of Labor Statistics, it is a key indicator of inflation, comparing changes in the costs of goods and services. FHWA has a similar approach to generating a construction cost index, the National Highway Construction Cost Index (NHCCI). NHCCI is intended to assess the change over time in prices paid for roadway construction materials and services.
From 2003 to 2006 the NHCCI increased 29 percent, faster than inflation. From 2006 to 2010 the NHCCI decreased 18 percent. Cumulative inflation from 2003 to 2010 is 12 percent higher than the cumulative NHCCI for this period.
| << Prev | Contents | Next >> |

