U.S. Department of Transportation
Federal Highway Administration
1200 New Jersey Avenue, SE
Washington, DC 20590
202-366-4000
This case study describes innovations in the application of QA/QC systems at the Virginia Department of Transportation (VDOT) as part of the best practices of planning for, and building in, high quality in traffic monitoring, data collection, and the analysis of raw data. By utilizing private contractors for field installation and maintenance, selecting equipment with advanced classification and binning options, and specially tailored in-house software, VDOT was able to develop an end-to-end solution for processing large volumes of high quality site data efficiently. The automated software tools allow staff to efficiently review data, and quickly assess site performance, including diagnostic assessment of sensor performance as exhibited through classification patterns over time. This information is used to quality grade data and provides preliminary diagnostic information for service call dispatch of private sector contractors.
Virginia has developed a custom classification algorithm (Binning ClassTree), with the support of the equipment vendor, which uses loop logic and makes decisions based on empirical sensor factoring knowledge to accept the data from sites into 22 defined types, which is a superset of the commonly used FHWA 13 vehicle category classification system.
An additional benefit of the process is the ability to continue to extract high quality useable data as sensors age, degrade or fail in the field, greatly extending the useable life of the site. When combined with a rigorous approach to site installation practices, VDOT has been able to deploy, operate and maintain over 600 traffic monitoring sites, with over 95% of sites generating useable data for multiple applications, using a combination of traditional sensors (loops and piezos), and non-intrusive radar sensors. The quality control procedures described in this appendix facilitate the assessment of the permanent telemetry sites using traditional in-pavement sensors.
Virginia has a very extensive traffic monitoring program. In order to process the large volume of data collected each year, VDOT has invested in a processing system to automate the flow of data and the necessary quality checks that are applied to the data. This effort has resulted in the development of a catalog of rules (currently over 95 rules-available on request) used in the Traffic Monitoring System Raw Data Error Review Process. As a part of the review analysis, quality ratings are assigned to the raw total volume data, the classification data, and the speed data. Per vehicle weight records of WIM data are processed separately, but classification, speed, and volume data that is collected concurrently from the same sites is included in the quality analysis software processing. The quality ratings determine the use of the raw data in reporting and processing activities that lead to the creation of AADT and VMT estimates and other special studies such as speed analysis.
Each permanent telemetry site is polled nightly by a process that contacts each site and downloads and processes the available previous day’s data. VDOT TMS analysts review the results each morning and then manually contact any sites that did not automatically download. If problems are identified, a service call maybe initiated, with contractually specified service response times.
Data files that were automatically downloaded are loaded into management software as part of the Quality Analysis procedure. Manually collected files, which include portable coverage counts and other data file formats can be manually loaded using one of the several acceptable formats. The preferred and fastest method uses a manufacturer’s proprietary binary format via a vendor DLL that is imbedded in the VDOT software. The other formats are typically ASCII text or PRN file readers and allow acceptance of all equipment generated data files in use in Virginia at this time. VDOT also has the ability to manually generate a special study data file as a text document that can then be system processed. This is occasionally done for data received from other sources, such as cities or consultants that are not normally part of the VDOT system.
Once data is loaded into the system it can be processed by the automatic review software. This review process runs as a series of comparisons. Based on the results of the comparisons, a tentative quality rating is assigned for the volume data and for the classification data, and where appropriate, messages are created for review by the analyst. The analyst uses the same software to review the messages and to determine the validity. Spreadsheets can be produced from the analysts console for outside review.
The analyst uses the information provided by the software and where appropriate can apply other information such as known site conditions (construction for example) to determine if the tentative ratings as determined by the software should be retained or if different quality ratings would be more appropriate. Due to the rigorous installation and maintenance practices followed, the default level is set at 5 as acceptable for all uses. The analyst may accept the system recommendations or may input a different rating based on other knowledge and experience with the site. Ratings are subject to review by contract administrators and in some cases by the service contractor to facilitate maintenance activity.
A key element of the raw data quality review software is the creation of messages that provide advice to the analyst in data review. At this time there are 96 individual messages corresponding to rules in the software that are displayed when conditions are met. The messages are established at levels of guidance for the analyst with displayed icons for quick recognition.
| Level one icon is a question mark in a circle, an advisory of a questionable nature. |  |
| Level two icon is the letter I in a circle, an informational advisory. |  |
| Level three icon is an exclamation mark in a triangle, which is a warning level message. |  |
| Level four is an X in a circle, which is an error level message. |  |
Source: Virginia Department of Transportation.
Below is a screen image of the VDOT Quality Analysis Software
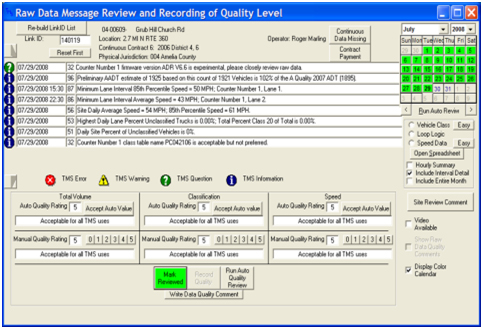
Source: Virginia Department of Transportation.
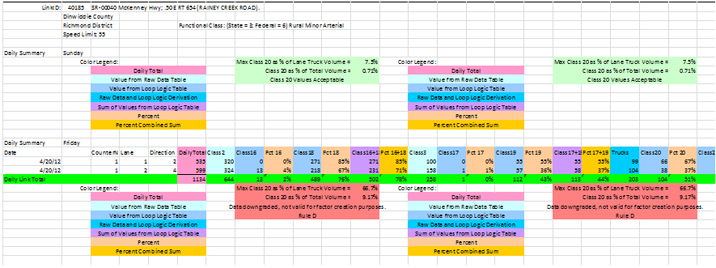
The following image is a VDOT display screen in spreadsheet analysis mode. As you look at the image, you will quickly note the upper interval of data has information boxes displayed in “Green is Good” mode, while the three lower intervals (which are subsequent days) are displaying the “Orange is Bad Mode” intended to catch the analyst’s eye that something has changed or is out of tolerance.
At the top is header information that identifies the site, followed by a banner bar for a day of data in columns from left to right. Column A is the date, and continuing as Counter Number, Lane, Direction, Daily Total, and then the volume per vehicle class starting with Class 2. Notice the classes do not directly progress as 2, 3, 4, etc., but are grouped by analysis of relationship within the 21 bin scheme, described more fully below. That is, that a Class 2 is followed by classes 16 and 18 and calculated percentages and class 16+1 and the percentage of class 16 plus 18. These are defined by the rules as empirically determined by the department.
Below the banner bar are blocks of explanatory color codes. Text of explanation inside the block instructs what rule has been activated. In this example there was a dramatic change from “Max Class 20 as % of Lane Truck Volume = 0.0%”, and “Class 20 as % of Total Volume = 0.00%” (i.e., good) to the following unacceptable call out.
Source: Virginia Department of Transportation.
Note: This display image has been edited to fit the page in this document.
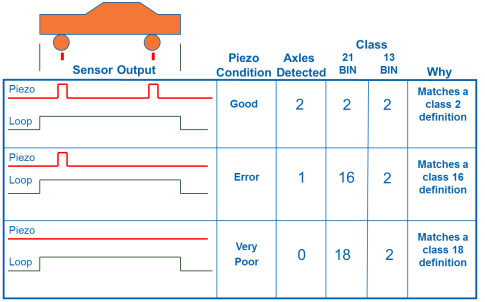
Manufacturers typically supply a default classification table based on an interpretation of the 13 FHWA class definitions and sensor characteristics. The 13 categories defined for vehicle types have some limitations for what to do with vehicles that either do not fit into the definitions, or due to missed sensor activations that can occur on the road, may be determined to be in error or incomplete. The cause of an error in sensing may be as simple as a vehicle changing lanes in the area of the sensors or may be a result of a defective sensor, vehicle characteristics, or rough pavement. The irregular sensor pattern, which may represent a valid vehicle, must be assigned to a class.
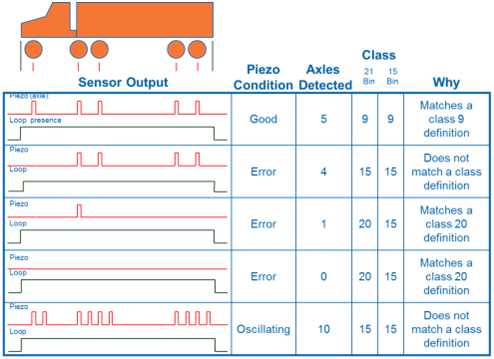
One approach is to combine all the error vehicles into Class 2 that are normally the numerically largest class as it contains all standard passenger cars. Another is to provide additional bins in the default scheme, for example a set up for 15 bins of vehicle types with type 14 being unused, and type 15 being the bucket into which all errors are tossed. VDOT takes advantage of the deployed equipment’s capability to provide more definitions and use additional criteria in the determination of vehicle class type. After empirical study of the pre vehicle raw data, VDOT determined that a specialized classification table could be used to apply logic based on the magnetic length of vehicles to the determination of what to do with irregular patterns that would otherwise be thrown into an unclassified category. This diagnostic classification algorithm adds six additional diagnostic data bins to the default 15-class scheme. At permanent sites, it is an excellent indicator of piezo health. The gradual degradation of piezo health and performance as the roadway ages and the surface wears is captured and can be traced over the life of a site, and allows for extended operation of the site before maintenance is required. Typically, missed axles tend to occur on lighter vehicles first, and are particularly noticeable on small front wheel drive cars where the second axle maybe missed by the electronics as a low output signal is often produced. It was determined that loop logic could be incorporated to identify a real vehicle that had an appropriate length as measured by the loops, and be placed in to a normal classification bin with confidence, as described in the following figures.
Source: Virginia Department of Transportation.
Source: Virginia Department of Transportation.
| ADR Advanced Loop Logic-21 Bin Table Explanation | |||||||||||||||||||||
|---|---|---|---|---|---|---|---|---|---|---|---|---|---|---|---|---|---|---|---|---|---|
| Vehicle Bins Displayed on TOPS and ADR Screen | 1 | 2 | 3 | 4 | 5 | 6 | 7 | 8 | 9 | 10 | 11 | 12 | 13 | N/A | 15 | 16 | 17 | 18 | 19 | 20 | 21 |
| Vehicle Class After TMS Translation | 1 | 2 | 3 | 4 | 5 | 6 | 7 | 8 | 9 | 10 | 11 | 12 | 13 | N/A | 15 | 2 | 3 | 2 | 3 | 15 | 15 |
| Piezo Axle Performance | Normal Valid Vehicle Classification Axle Rules Apply No Loop Logic Rules Apply All Vehicles Have 2 or More Axles Unchanged | 1 Axle Vehicle Detected, Loop Logic, Rules Apply | 1 Axle Vehicle Detected, Loop Logic Rules Apply | 0 Axle Vehicle Detected, Loop Logic Rules Apply | 0 Axle Vehicle Detected, Loop Logic Rules Apply | 0-1 Axle Vehicle Detected, Loop Logic Rules Apply | |||||||||||||||
| Vehicle Magnetic Length Rules | Normal Valid Vehicle Classification Axle Spacing Rules Apply No Loop Logic Rules Apply Unchanged | 7’ to 16’ | 16’ to 19’ | 7’ to 16’ | 16’ to 19’ | 19’ to 100’ | All Others, Including Vehicles Less than 7’ Vehicle Length, Lane Changers, Etc. | ||||||||||||||
Source: Virginia Department of Transportation
Table E-2 defines the relationship between the 21 bin classification scheme of Virginia and the FHWA 13 Per Vehicle Raw field data defining when a vehicle is assigned to one of the 21 bins that are subsequently post processed by analysis to a correlating FHWA 13 class. At this time, please notice the bin 18, which is a vehicle with zero detected axles and an overall detected length of 7 to 16 feet. Based on empirical study, this is a real vehicle, and based on the detected length is most likely a class 2, passenger car.
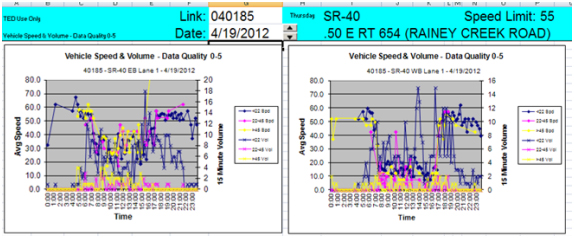
Figure E-5 illustrates a graphic tool available to VDOT analysts responsible for checking the data. This particular visualization confirms that there is a serious problem at the site and that it was not just for an hour or for a single recording interval.
Source: Virginia Department of Transportation
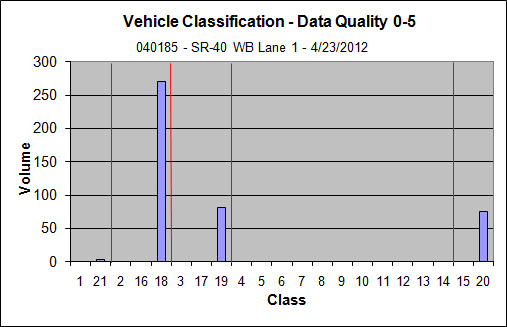
Previously it was pointed out that Bin 18 contains vehicles detected as valid, with a length of 7 to 16 feet but with no detected axles. Notice that on this day there were approximately 275 vehicles in Bin 18.
Source: Virginia Department of Transportation.
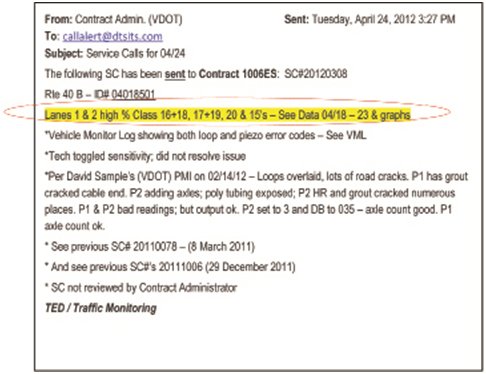
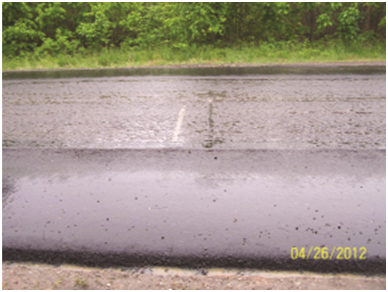
Example: In processing routine data files, a VDOT traffic data analyst initiates a service call because the VDOT quality analysis software “alarmed” at processing classification data from a site that was previously working. A typical service call is shown below, and the primary information is circled. Note the 21-Bin classification data provides additional diagnostic information for the technician.
Source: Virginia Department of Transportation
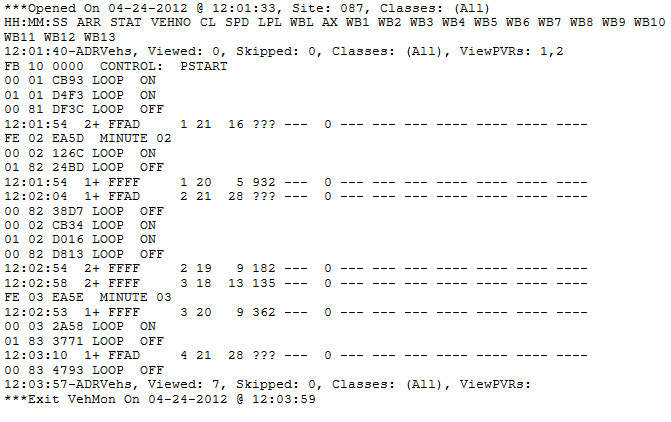
As an additional diagnostic aid, the following is a partial print-out of the VML (Vehicle Monitoring Log) as referenced above in the service call. The VDOT analyst originating the service call created this log by telemetry contact from his office to the remote site using the equipment manufacturer’s supplied software to monitor the site in operation. The question marks indicate that the equipment could not calculate the length of the vehicle, and there are error (status) codes present. FFFF is a correctly detected vehicle, while FFAD indicates a vehicle that missed the piezo sensors.
FIGURE E-8 VML PRINT-OUT
Source: Virginia Department of Transportation.
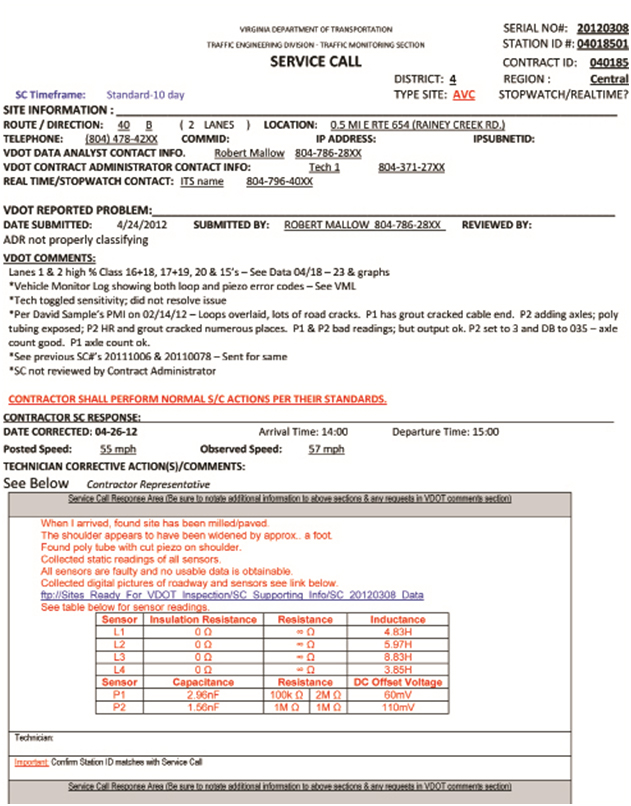
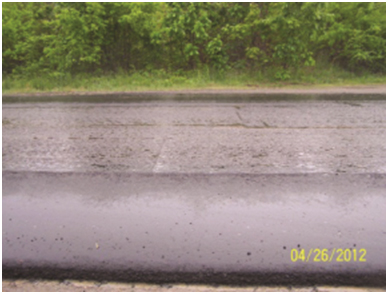
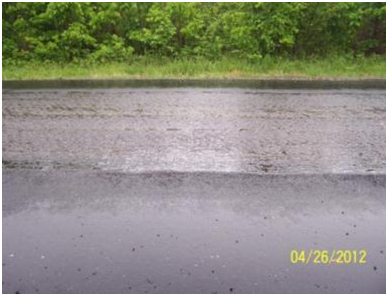
In response to the emailed service call and its supportive information, the private contractor routed a technician to investigate the site. Excerpts from the service report containing his readings and observations is shown on the following pages along with photographs that he took while at the site.
Source: Virginia Department of Transportation.
Source: Virginia Department of Transportation.
Roadway has been completely milled, and the westbound lane has been widened and initial base asphalt has been placed. The entire road is expected to receive additional surface asphalt and then will be re-marked.
Source: Virginia Department of Transportation.
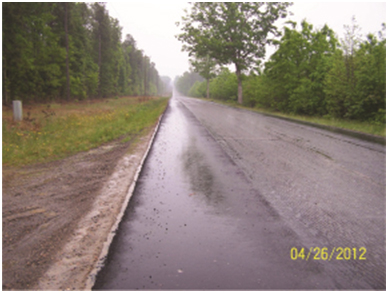
DTS Technician found that milling did not reach the sensors and they were not exposed. Destruction of the sensors requiring replacement is due to the widening process that ripped out the lead wiring that was under the shoulder apron.
Source: Virginia Department of Transportation.
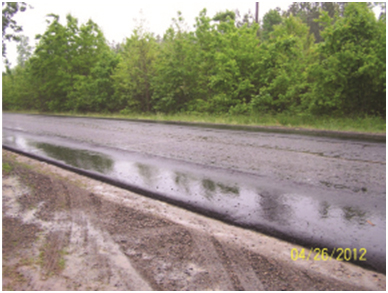
Piezos (old style) are visible but not exposed, and do not appear to be damaged in the roadway. Electronic test measurements indicate no connection to the cabinet.
Source: Virginia Department of Transportation.
Source: Virginia Department of Transportation.
Loops do not appear to be exposed or damaged by the milling in the roadway. Test measurements taken at the cabinet indicated the connecting wires are shorted. The technician also reported that he/she found long pieces of connecting wire and tubing in the grass at the side of the road.
This case study discusses the quality control systems used for traffic data in the State of Vermont. Vermont has 3,900 road centerline miles on Federal aid routes and 10,200 road centerline miles on local roads. The Vermont Agency of Transportation (VTrans) Traffic Research Unit uses a combination of permanent in-house staff and summer temporary employees to collect traffic count data on Federal aid routes and on local roads.
VTrans is currently operating 60 continuous volume counters, 21 WIM, and 2 continuous vehicle classification counters.
The coverage count program includes 2,200 short-term ATR counts on Federal aid routes and 2,400 short-term ATR counts on local roads. The counts are done on either a three or a six-year cycle, depending on the route. Each year VTrans collects around 500 week long ATR counts on Federal aid routes, including interstate ramps and other grade separated ramps, and 400 weeklong ATR counts on local roads. Counts performed on the Federal aid routes are typically vehicle classification and speed while the local road counts are volume only.
VTrans conducts 12-hour manual turning movement counts at 1,300 intersections over a four-year period. Either counts are done on a two or four-year cycle, with about 450 counts annually. VTrans is in the process of implementing a bicycle and pedestrian manual count program. VTrans collected trip generation data over the past several years and has submitted 675 counts to ITE to be considered for the ITE Trip Generation Manual. VTrans intends to continue to collect trip generation data on an every other year basis, alternating with the bicycle/pedestrian count program.
VTrans currently uses an Oracle based consultant designed traffic monitoring system to manage traffic count data but is planning to implement a new system within the next two years. Various off-the-shelf products are under consideration, as well as possibly another consultant designed system.
The VTrans Traffic Research Unit does not have a formal QA/QC program but does have quality checks built into the data collection and data review procedures as described briefly herein.
VTrans field technicians check the CTC sites on a monthly basis while downloading data at the site. The field technician checks batteries and hardware as well as verifies that the counters are recording correctly.
Monthly traffic is reviewed for daily directional distribution. If the percent of traffic in the lower volume direction is less than 48% the data is reviewed more closely for a potential problem.
Using an Excel based routine that pulls data from the Traffic Monitoring System, graphs are produced on a monthly basis that show a particular day of the week, for each occurrence of that day of the week over the month. For example, Sundays are reviewed and differences between Sundays may indicate where the counter has stopped working on any one lane, or where there has been a period of resonation shown by surges in the volume.
Monthly reports are generated that compare the current year’s average daily volumes with last year’s average daily volumes. Differences of more than 10% are reviewed more closely.
On a monthly basis, the WIM Technician visually inspects each WIM site and runs diagnostic reports. VTrans relies largely on auto calibration to maintain calibration at the WIM sites but on occasion has used a test vehicle or portable scales to recalibrate the systems.
WIM counts are converted to volume counts and compared alongside the other CTC counts (see above).
As each count is set out, the Field Technician checks to see that the recorder is collecting data and that the data is accurate. When the count is picked-up, the field technician downloads and reviews the data on a laptop computer and resets the count as needed.
Each ATR count is reviewed individually. The minimum duration is 48-hours of weekday data. The estimated AADT is compared to historical volumes to ensure that it is not unreasonable. The following table shows specific quality checks performed on vehicle classification counts.
| Checks | Criteria requiring additional review |
|---|---|
| Class 14s | >5% for the count as a whole |
| Directional ADT | DAY SPLIT > 53% for the count as a whole |
| Cycles | > 2% |
| Cars | <70% |
| Pickups | >22% |
| Buses | > 1% |
| 8s vs. 9s | 8s > 9s, N/A for local streets, weekdays only |
| Multi trailers | CL 11-13 > 1% |
| Med vs. Heavy | med < heavy (med - heavy < 0) |
| Sat %ADTT | > 75% of weekday ADTT |
| Sun %ADTT | > 75% of weekday ADTT |
| Peak hr trucks | > weekday ADTT |
| Misclassification | Class 3s can be misclassified as 5s – look for high class 5s; High cycles can indicate problems with classes 2-5 |
Source: Vermont Agency of Transportation
Vehicle classification data is also reviewed for daily directional distribution by vehicle classification. Differences of greater than 10% indicate a potential problem requiring additional review.
VTrans records speed as well as vehicle classification for most ATR counts, however the speed data files are not loaded into the database but are stored separately in their raw format and are used only occasionally. If the vehicle classification data for a count is rejected, the speed data for the same count is also rejected.
Regarding site location, the field technicians are able to load GPS coordinates directly into the traffic recorder and the coordinates appear in the header of each count file. The coordinates are checked using a GIS application to verify that the count was set in the correct location.
The turning movement count program is very well supervised with a Field Technician, as well as a senior temporary employee, circulating among the count staff answering questions, helping to find the correct intersection, verifying that safety measures are in place, filling out field sheets correctly, and providing breaks over the day. A one-day training program is provided at the start of the season.
The turning movement counts are reviewed by the Field Technicians at the end of the count season. Information provided on the field sheets is used to enter the street names, orient the count, etc.
Using GPS to locate the ATR sites has been very beneficial. The Field Supervision for the turning movement count program has also been very worthwhile, with very few counts rejected over the season and very few safety related problems.
The VTrans Traffic Research Unit does not have a well documented QA/QC procedure. This is due in large part to having a very experienced staff with quality checking routines in place and little need to refer to documentation. However, as staff members move on it will be more difficult to train new employees in QA/QC without written guidelines. This was made apparent when it was discovered well into the season that a new employee was setting up ATR counts incorrectly and the vehicle classification was inaccurate.
This case study discusses the quality assurance and quality control processes for both short term traffic count data and permanent traffic count data at the Pennsylvania Department of Transportation (PennDOT). PennDOT is responsible for collecting, analyzing, and reporting traffic data on approximately 40,000 miles of road. This data collection includes short term and permanent traffic volume, classification, and weight data. Speed data is collected only at permanent traffic sites. PennDOT has 89 permanent traffic counting sites and over 42,000 short term count locations, including ramp locations.
The short term traffic count data go through a series of quality assurance edit checks. The raw count data are first submitted through PennDOT’s Internet Traffic Data Upload System (iTDUS). This web based application subjects the counts to basic checks (site number, file type, header file format, 24 hours, duplicate data, and same data for both directions) before configuring the count in a format acceptable for the mainframe computer system, the Roadway Management System (RMS). Once the counts have passed the iTDUS checks, a text file is created from the iTDUS application and loaded weekly to the RMS. The short term traffic count data is run through a series of automated error checks.
The raw traffic count data first goes through the 15 error checks contained in Table E-4. If the count fails one or more of the edits, it will appear on the 650 Traf Raw Count Load Error Report.
Upload File Empty
Invalid Record Type
Header Sequence Error
Invalid Jurisdiction Code
Segment Not Found On Database
Key Does Not Exist On LFA DB
Offset Exceeds Segment Length
Invalid Count Type
Limit ID Not Found
Opposite Side Key Not Found
Duplicate Class Count Exists
Duplicate Volume Count Exists
Parallel Count Types Not Equal
Incomplete Count < 24 Hours
Invalid Count Date
If the raw traffic count data passes the 650 edit checks, it moves on to the next set of edits as illustrated in Table E-5. If the count fails one or more of the 28 edit checks, it will appear on the 660 Traf Raw Count Error Extract Report.
Record not found on database
Traffic Offset greater than segment length
Parallel Road: Traffic opposite key = 0
Non-Parallel Road: Traffic opposite key > 0
Parallel road, Raw traffic opposite record not found
Errors encountered when processing opposite side data
Raw traffic volume count date greater than run date
Day of the week is Saturday or Sunday
Manual: Count not in 6am – 6pm range
Less than 6 consecutive hours of count data
Invalid hour range less than 24 hours
Zero volume for peak hours
6 or more non-consecutive hours with zero volume
Same volume has occurred 4 consecutive hours
Manual: Count of zero volume for 1 hour period
Midnight hour volume greater than noon hour volume
Machine: 2 axle truck count greater than car count
Distribution is greater than 60/40 for all count
Current traffic record not found
Current traffic count date greater than raw traffic count date
Machine: lane count invalid
Count dates not equal
Could not find child segment
Type of count not same for primary/opposite side
Parallel counts on same side of road
Peak hour comparison greater than percentage range
Cannot process data not numeric
Opposite side traffic factor julian date is greater than zero
If the count passes the 28 edit checks in Table E-5, the count moves on to the final set of automated edit checks illustrated in Table E-6. If the count fails one or more of the edits in Table E-6, it will appear on the 661 Traf Extrapolation Report.
AADT AND TRUCK PERCENT VARIANCE EDITS
0 – 2,000 AADT= 50% Variance
2,001 – 10,000 AADT = 20% Variance
10,001 – 25,000 AADT = 10% Variance
25,001 – 999,999 AADT = 10% Variance
Machine: Motorcycle count greater than 9.9%
Machine: Bus count is greater than 10%
Machine: 6 axle-single trl count greater than 9.9%
Machine: 5 axle-multi trl count greater than 9.9%
Machine: 6 axle-multi trl count greater than 9.9%
Machine: 7 axle-multi trl count greater than 9.9%
Machine: Car class greater than 99,000 vehicles for one side
Count date is less than 01/01/2008
If the count passes all checks, the data will be loaded automatically into the database.
Counts appearing on an error report are reviewed by a traffic analyst who will determine if the count is acceptable by reviewing historical data in RMS, traffic volume maps that allow them to see the flow of traffic in the area, viewing PennDOT’s Video Log, and even calling Planning Partner contacts in the area of the count. Data considered to be acceptable will be manually processed into the system. Counts that are rejected are requested to be retaken and run through the whole process again once new data is submitted.
PennDOT has 89 (42 ATR, 34 CAVC, and 13 WIM) permanent traffic counting sites. The ATR and CAVC sites are subject to the Quality Assurance Program. This program entails field staff performing a 4 hour manual classification count at each CAVC and ATR site. The manual count data is then compared to the permanent traffic counter data for the same 4 hour timeframe. All of the data is entered into PennDOT’s Quality Assurance application that is part of the Automatic Traffic Information Collection Suite (ATICS). The application compares the data by lane, direction, and classification. The Quality Assurance application generates reports that show the comparisons of the data.
The short term traffic data collection program quality assurance/control program has been in place since 1985. Prior to 2008, the department grouped vehicles into 11 vehicle classes. This presented a problem for users trying to retrieve data for a specific classification because most of the requested classes were grouped together. There were adjustments made to the vehicle classes in 2008 when PennDOT went from 11 vehicle classes to 13 vehicle classes to comply with motorcycle data collection and the FHWA Scheme F format. The new vehicle expansion in RMS shows a more accurate vehicle breakdown that provides users better quality data. During the expansion, error checks were added to incorporate the new classes. This change took over a year to implement.
The permanent traffic data collection program quality assurance/control program was automated for ATR and CAVC data within the ATICS portal. Prior to the use of automation, the data was collected and stored in spreadsheets.
When dealing with changes to the RMS mainframe system, patience is needed. The mainframe requires changes to be made using Common Business-Oriented Language (COBOL) programming language. Due to the multiple areas within PennDOT that utilize RMS, changes must be carefully done so that other mainframe applications are not affected. Any changes, whether major or minor, take time and have to be subjected to extensive testing.
When the opportunity presents itself, it is advisable to automate workflow processes. Automated processes save time. When automating a process, plan extra time for unexpected issues to arise. Even with the best planning, issues come about when converting a manual process (whether large or small) into an automated one.
E.3.6 FUTURE ENHANCEMENTS
The current processes have been working well. Without being able to update the mainframe system (RMS), the short term traffic count program edit checks will remain the same. If the short term count duration is eventually extended to 48 hour counts, the edit checks within RMS would have to be reconfigured for the longer timeframe and the iTDUS application would have to be enhanced to handle 48 hours of data.
The permanent traffic count program QA reviews will be put on a cyclical basis. In 2011, all permanent ATR and CAVC sites were reviewed that provided a baseline. In previous years, only a handful of sites were reviewed each year. Starting with 2012, the sites will be put on a rotating basis to have a more consistent QA process of PennDOT’s permanent traffic counting devices
This case study will discuss the quality assurance and quality control processes for both short term traffic count data and permanent traffic count data for the Statewide Travel and Collision Data Office (STCDO) of Washington State DOT. STCDO conducts an extensive traffic data collection, analysis and reporting program to gather information on usage of the approximately 7,060 miles of roadway composing the State highway system. The purpose of this program is to develop transportation data that will enable the department to construct, operate, and maintain the most efficient and cost-effective transportation system possible.
STCDO is responsible for collecting, processing, analyzing, and reporting historical/archived traffic data for the State highway system and does not contract out for any services. The five major sections in STCDO that perform this work are Electronics, Short Duration Traffic Count Field Operations, Automated Data Collection, Short Duration Traffic Count Processing, and Travel Analysis. Each of these sections perform quality assurance (QA) and quality controls (QC) using their own procedures from site evaluation prior to collection of the traffic data to scrutinize the collected data for accuracy and consistency prior to dissemination to customers. The following paragraphs provide an overview of the procedures, experiences, and lessons learned over the history of WSDOT’s traffic data program. The data collected is made available to WSDOT’s customers through a Traffic Datamart, which includes traffic volume, classification, speed, and weight information.
The following paragraphs describe specific quality control procedures that are used to evaluate WSDOT’s traffic data and to correct errors as they are identified.
Machine Malfunctions: Machine malfunctions are a common cause of invalid traffic count data. TRIPS edits detect some machine malfunctions. Most machine malfunctions are detectable by the field person and documented on the Recording Counter Field Sheet. Sources of malfunction include road tubes (or other roadway sensors), system electronics, power supplies, and data transfer links.
Equipment Limitations and Improper Set-up: Factors such as traffic congestion, parking, counter/road tube placement, and total number of lanes being counted can influence data validity.
Typical Traffic Statistics: Peak hour percentages, truck percentages, and individual daily volume as a percentage of average daily volume generally fall within certain parameters considered to be “normal” for a short-duration count. Each count is reviewed in order to determine if the statistics from the count fall within these parameters. If not, the data is investigated more closely in order to determine ITS validity.
Atypical Traffic: Holidays, sporting events, parades, and traffic incidents can result in atypical traffic conditions. If a count is conducted entirely during abnormal conditions, such as the week of a major holiday, the count data will likely be inconsistent with data collected historically for that count location. If the atypical traffic conditions are more limited in duration, as can happen with a traffic accident, the data collected during the period of atypical traffic will often be inconsistent with the data collected during the same period of other days of the count.
Data Context: Data context is both the history of traffic at the same location and traffic characteristics at other points along the same roadway. Comparing a count to historical count data or counts that have been taken in the same vicinity at the same time can identify questionable data for further review. This type of editing can also help identify equipment malfunctions. Particularly careful scrutiny in relation to data context should be given to any count that is in question.
Count Duration: A count should be a minimum of 48-hours in each direction. Counts that are less than 48-hours are difficult to validate because there is insufficient data available for comparisons. Therefore, traffic counts that have statistics calculated from less than 48-hours of data in each direction are labeled accordingly.
The following is performed prior to accepting and updating summarized volume counts:
The following seven steps are performed prior to accepting and updating summarized classification counts. Professional judgment should be used prior to accepting the data, and the data should be appropriately labeled if questionable:
Step 1. Class unknown for each direction should be less than 10% of the directional AWD volume. If the class unknown is not less than 10%, then look at the distribution of class unknown. If the distribution is even, then write on the left of the field sheet that both directions of data must be deleted from the class count file. If the distribution is one direction only, then write that the one direction of data must be deleted from the class count file. If the distribution is limited to a certain number of hours, rework the count so that those hours are not used in any calculations and then write that those hours of data should be deleted from the class count file.
Step 2. Summary single unit trucks should be less than 10% of the AWD volume. Single units are most commonly distributed as follows: bus low, medium high, heavy medium to high, and 4+ low. If the distribution and percentage of single unit trucks does not meet these criteria, then look at the distribution of singles. If the distribution is even or one direction only, follow the procedure outlined in step 7. If the distribution is limited to a certain number of hours, rework the count so that those hours are not used in any calculations and then write that those hours of data should be deleted from the class count file.
Step 3. Summary double unit trucks should be less than 10% of the AWD volume. Double units are most commonly distributed with 4- low, 5 high, and 6+ medium. If the distribution and percentage of double unit trucks does not meet these criteria, then look at the distribution of doubles. If the distribution is even or one direction only, follow the procedure outlined in step 7. If the distribution is limited to a certain number of hours, rework the count so that those hours are not used in any calculations and then write that those hours of data should be deleted from the class count file.
Step 4. Summary triple unit trucks should be less than 6% of the AWD volume. Triple units are most commonly distributed with 5- low, 6 medium, and 7+ high. If the distribution and percentage of triple unit trucks does not meet these criteria, then look at the distribution of triples. If the distribution is even or one direction only, follow the procedure outlined in step 7. If the distribution is limited to a certain number of hours, rework the count so that those hours are not used in any calculations and then write that those hours of data should be deleted from the class count file.
Step 5. Summary total truck percentages will vary depending on the count location. Rural counts will normally be higher than urban counts. Counts taken in Eastern Washington will commonly be higher than those in Western Washington. Professional judgment should be used prior to accepting the data and the data should be appropriately labeled if questionable.
Step 6. Review directional data using the steps outlined for data.
Step 7. If truck data does not meet the criteria above: 1) Review the hourly data more closely to verify that the counter was classifying properly; 2) Look for other counts taken nearby during the same time period, as well as historical data collected at the same location, to see if the classification data is similar; and 3) If the variability cannot be substantiated in this manner, but two out of three days are consistent with each other, use only those two days. If none of the days are consistent, the data should be appropriately labeled, not used, and noted as requiring deletion from the class count file.
WSDOT has not implemented any significant changes to their QA/QC procedures in the last several years. They have been using the same procedures for the last 15 years. The processing software was re-written to be compatible with Windows 7.
Data for short-duration traffic counting is never estimated. For example, if a traffic count contains 47-hours of usable count data, the missing hour will not be estimated. However, in order to arrive at 24 or 48 hours of valid data for use in calculating statistics for a count, missing or invalid weekday data may be replaced in the calculations with valid data from the same time period of a different weekday. This can only be done if the valid data is not thereby included twice in the calculations.
If an HPMS or ATR count did not have 48 hours of valid data in each direction from which to calculate an average weekday traffic figure, a recount note is written at the top of the field sheet and a copy is given to the Travel Data Field Operations Supervisor. This individual should also be notified of any equipment malfunctions not documented by the field person on the Recording Counter Field Sheet, regardless of the purpose of the count.
The database infrastructure and reporting software currently in use is old and outdated. As funding becomes available, updated database infrastructure and reporting software will be purchased.
This case study examines the QA/QC systems used by the New York State Department of Transportation (NYSDOT) for traffic data analysis and presents current practices and lessons learned that can benefit other State DOT’s traffic monitoring programs. NYSDOT is responsible for managing a State and local highway system of more than 113,000 highway miles and more than 17,400 bridges. This extensive network supports annual travel of over 130 billion vehicle miles. Also included in the New York State transportation network is an extensive 3,500-mile rail network over which 68 million tons of equipment, raw materials, manufactured goods, and produce are shipped each year. Over 485 public and private aviation facilities are part of the transportation network that more than 80 million people travel each year. Included are over 130 public transit operators that serve more than 80 million passengers each day. Lastly, this extensive network also includes 12 major public and private ports. The responsibility for collecting, processing, and disseminating the traffic data at NYSDOT resides with the Highway Data Services Bureau. Managing the collection of traffic data for such an extensive network is challenging, however, NYSDOT uses a variety of counters and classifiers with over 170+ continuous count stations used to collect the volume data and 24 sites for collecting weigh-in-motion (WIM) data. The following information, documented in the report Change in Traffic on NYS Bridges, Thruway and Roads (January 2010), provides an overview of the use of continuous count stations statewide.
The New York State continuous count stations vary in volume size (ranging from low to high volume), differing geographic location and areas of population density, and facility type (functional classification of the roadway). The individual continuous count sites are also subject to occasional equipment failure, removal, and addition of new sites. The continuous count sites are grouped by Highway Performance Monitoring System (HPMS) volume group and urban type (urban, small urban and rural) categories. The vehicle miles traveled (VMT) is estimated through HPMS and as such, it relies on expanded samples and multi-year short count volume measurement adjusted to the current year. Equally important is how bridges and tunnels are considered. Often these represent constriction points within the network and may or may not be a fair representation of overall travel if no other toll or free alternatives exist. Figure E-15 provides an illustration of the New York State Thruway network and the continuous count sites.
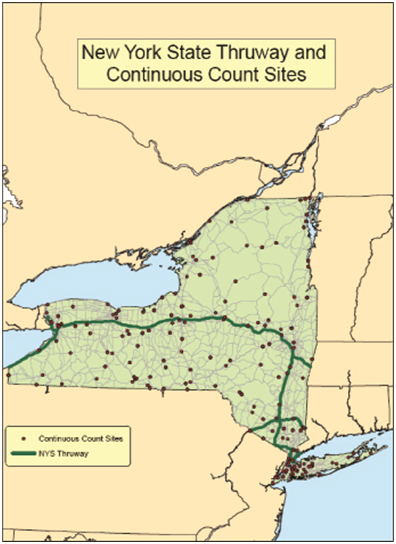
Source: New York State Department of Transportation.
Weight data are also collected at several WIM sites throughout the State. NYSDOT uses the following guidance in establishing their WIM sites. Each site should exhibit the following characteristics:
The QA/QC procedures presented in this section provide a high-level overview of these processes, with more detailed information documented in Appendix F of the TMG. Quality control of traffic data at NYSDOT begins with field staff inspections of traffic data collection sites on an annual basis. All physical components of the data collection equipment are checked thoroughly and recorded on a site specific spreadsheet by the field staff to ensure that all components are in proper working order. How in-depth the checks are depends upon the level and type of data being collected at the site. The following paragraphs present an overview of the quality checks used at NYSDOT.
In the case of volume data only, a process of assuring that the loops are activating and each vehicle is counted as one vehicle will typically suffice. Sites that collect speed data are checked for accuracy by a radar gun. Sites that collect classification data are checked to make sure that there are no missing, or extra axles on the vehicles. On a normal site inspection, data validation may range from watching just ten vehicles to watching a few hundred vehicles. At a minimum, the test will last until all lanes have been validated.
Validation of weight data at NYSDOT typically follows these steps (FHWA, Andrew Haynes, 2010):
Several of the lessons learned in implementing the QA/QC procedures for traffic data at NYSDOT are listed below. These lessons are presented to offer guidance to other State traffic monitoring program managers who are responsible for the collection and quality control of their State’s traffic data:
The most prominent enhancement to NYSDOT QA/QC procedures is the addition of TRADAS. The traffic monitoring group intends to use TRADAS to QC continuous data of all types using automated checks with parameters tailored to individual sites. This will provide the staff with additional time for a more in-depth analysis of problematic sites that require closer scrutiny of problems.
Current practices also put a lot of emphasis on monthly processing, which means that some errors are not identified until they have been occurring for many weeks. The implementation of TRADAS should allow NYSDOT to analyze more up to date data, and therefore catch problems sooner.
WIM data is currently monitored at a very high level and the WIM data that is disseminated is nearly always raw data. With less time spent converting data, NYSDOT has more time for a thorough review of data on a weekly basis. This will allow technicians to more closely monitor calibrations and provide better data to the customers.

