U.S. Department of Transportation
Federal Highway Administration
1200 New Jersey Avenue, SE
Washington, DC 20590
202-366-4000
Federal Highway Administration Research and Technology
Coordinating, Developing, and Delivering Highway Transportation Innovations
| REPORT |
| This report is an archived publication and may contain dated technical, contact, and link information |
|
| Publication Number: FHWA-HRT-10-069 Date: September 2011 |
Publication Number: FHWA-HRT-10-069 Date: September 2011 |
The primary purpose of the laboratory slab study was to evaluate the long-term performance of ECE in an environment where the impact of other influential variables could be controlled or documented for a more accurate analysis. SHRP Contract C102-A included a laboratory evaluation of ECE. Twelve test slabs were fabricated in July and August 1988 and treated in May, June, and October 1989 using varying current densities and electrolytes. After treatment was complete, the slabs were exposed to Northern Virginia climate and monitored for 35—40 months. This study was completed in 1992, and results and findings were published in 1993.(1)
From 1989 to 1999, the slabs were continuously exposed to the Northern Virginia climate. During the interim period between the end of the SHRP study in 1992 and the start of this study in 1995, the slabs were briefly monitored for several months in 1993 by another entity. Since the start of this study, the slabs have been monitored on a quarterly basis up to the second quarter of 1998, and the final chloride data were collected in December 1999.
This 10-year exposure and monitoring provided significant insight into the ability of ECE technology to protect against corrosion of steel embedded in concrete. The findings and results are discussed below.
The test slabs were fabricated using concrete confirming to the Ohio Department of Transportation's class C concrete. The test slabs were 24 by 24 by 7.9 inches (610 by 610 by 200 mm) thick and contained two mats of reinforcing steel. The top mat comprised of two rebars with diameters of 7.5 and 5.1 inches (19 and 13 mm). The 7.5-inch (19-mm) bars were placed on top of the 5.1-inch (13-mm) bars, and the clear concrete cover over the 7.5-inch (19-mm) bars was 1.9 inches (48.26 mm). The bottom mat consisted of 6.2-inch (16-mm) crossing rebars. The clear concrete cover over the bottom mat of steel was 1 inch (25.4 mm). All bars were located on 7.1-inch (180-mm) centers.
The test slabs were fabricated using three lifts of concrete, and different amounts of chloride ions were added to each lift. No chloride ions were added to the first lift (3.1 inches (78.7 mm) thick); however, they were added to the second (3.1 inches (78.7 mm) thick) and third lifts (1.6 inches (40.4 mm) thick) at a rate of 1,722 and 3,875 ppm, respectively.
Both ends of all rebars protruded out of the slab. The steel in each mat was made continuous by welding a bar across one end of the rebars in each direction and connecting the external bars together. The two mats of the rebars were made electrically continuous through an external resistor and a switch. The resistor allowed a measurement of macrocell current between the top and the bottom mat, and the switch allowed disconnection of the mats for AC resistance and driving volt measurements.
During the study, numerous cores were collected from these slabs. Reinforcing steel was extracted in many of these cores. To ensure that the collection of the cores did not impact the study, continuity disrupted by coring was reestablished, and sides of the core holes were epoxy coated. Many of the continuity connections between bars in core holes and the ends of bars with insufficient epoxy in core holes corroded with time. A section of the rebars that was 0.50 inches (12.7 mm) long projecting out of the concrete on the sides of the slabs was especially prone to corrosion as the epoxy coating weathered. This section of the rebar is termed the “external section” of the rebar for the purpose of this report.
Twelve slabs were fabricated for this study. One was designated as a spare (slab 6, which was not measured), and the remaining 11 were used. Of those 11 slabs, slab 1 was used to determine the maximum current density limit. The remaining 10 slabs were included in the long-term evaluation. The variables associated with each slab including the anodes and electrolytes used, applied current density, and total charge passed for each slab are listed in table 1.
1 mA/m2 = 0.093 mA/ft2 |
The pH of the electrolyte was maintained at a fixed level during application of ECE on slabs 3—5 and 10—12 (ph–ECE slabs), whereas no control was exercised for slabs 7—9 (n–ECE slabs). After the chloride removal process was complete, the top surface of each slab was lightly sandblasted, and a siloxane-based sealer was applied to the surface.
To obtain a complete analysis of performance of ECE in mitigating corrosion, data obtained during the SHRP study interim monitoring in 1993 and data collected in this study were combined.(1,2) With the exception of depths from which powdered samples were collected for chloride ion content analyses, all other data were collected using the same procedures and equipment utilized in SHRP and interim monitoring.
At the end of the study in December 1999 (10.25 years after ECE treatment), one core was collected from each slab, and chloride ion content analyses were performed on powdered samples from the cores. Concrete samples were collected from five nominal depths of 0.50, 1.50, 2.50, 3.50, 4.50, and 7.00 inches (12.7, 38.1, 63.5, 88.9, 114.3, and 177.8 mm). Concrete from 0.50 inches (12.7 mm) above and 0.50 inches (12.7 mm) below each nominal depth was powdered and mixed to prepare a sample representing that nominal depth. The collected powdered samples were analyzed for total chloride ion content, and the results are presented in figure 1.
Prior to the application of ECE, the average chloride ion content measured in the bottom 3.1 inches (78.7 mm) of the slabs (first lift) was 151 ppm. Additionally, the average chloride ion measured in the middle 3.1 inches (78.7 mm) of the slabs (second lift) was 1,851 ppm, while the average chloride ion content measured in the top 1.6 inches (40.6 mm) of the slabs (third lift) was 3,475 ppm (see figure 1 for comparison purposes). Comparison of the chloride profile for slab 2 to the chloride profile for original chloride ion content shows the effect of diffusion at the end of 10.25 years. Over time, the chloride ions in slab 2 were diffused to reach a uniform distribution at all depths. The total quantity of chloride ions in slab 2 was calculated using the profile of chloride distribution assuming that the chlorides were uniformly distributed in the horizontal plane at each depth. Based on this calculation, the total quantity of chloride ions present in the slab after 10.25 years was approximately 3.5 oz (100 g). The calculated quantity (based on initial quantities of chlorides in each lift) of chloride ions added to the slab at construction was 9.38 oz (268 g), and the removal of cores from the slab accounted for 2.38 oz (68 g) of chloride ions. The difference of 3.5 oz (100 g) can be explained by the leaching of chloride ions from cracks and the delaminations along the top mat rebar and in the core holes.
All ECE slabs showed a distribution of chloride ions similar to that of slab 2, albeit at a lower but somewhat uniform concentration. Slabs 3 and 4, which received the least amount of ECE treatment (59.9 A-h/ft2 (645 A-h/m2) compared to over 186 A-h/ft2 (2,000 A-h/m2)) for other slabs), had a higher level of chloride ion concentration than the other ECE slabs at all depths in the second and the third lifts of concrete. To ascertain if this distribution of chloride ions in the ECE slabs resulted from diffusion of chloride ions and/or the application of ECE, chloride profiles from various time periods needed to be compared for each ECE slab. Limited profile data were available. Immediately after ECE application, chloride ion content from several depths of one core from slabs 5 and 12 were analyzed. Comparison of those profiles with profiles after 10.25 years of exposure suggests that some amount of diffusion occurred in the third lift of concrete for these two slabs (see figure 2).
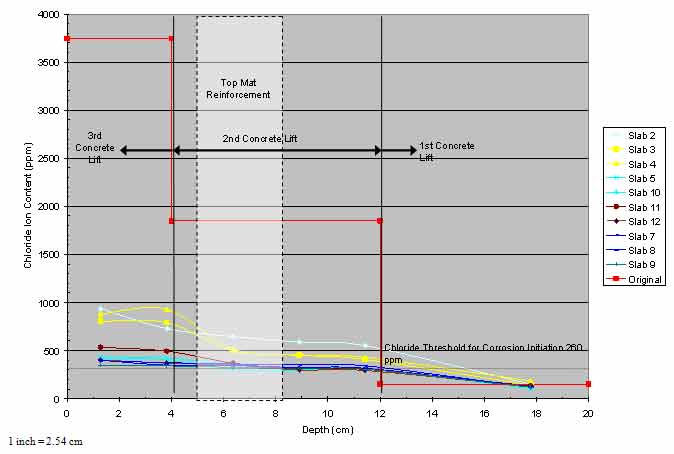
Figure 1. Graph. Chloride ion content versus depth.
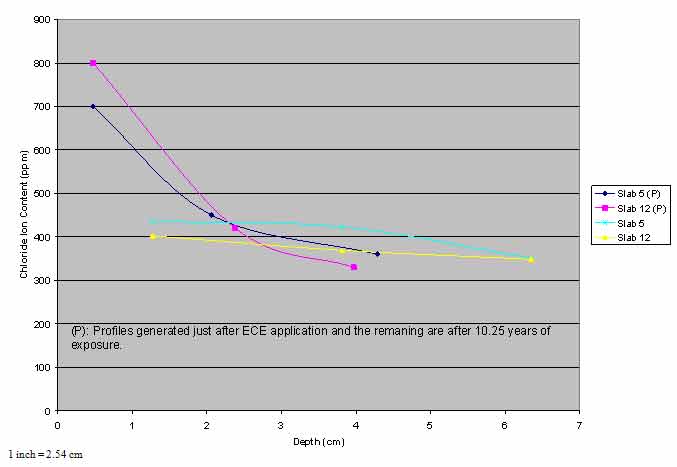
Figure 2. Graph. Comparison of chloride profiles.
Several times during the SHRP study, chloride analyses were performed on concrete samples collected from the top and bottom trace of crossing and single rebars of the top mat. This analysis was performed to study the migration of chloride ions in the vicinity of the reinforcement. Based on the data obtained, it was concluded that diffusion of chloride ions in the control slab (slab 2) was occurring as predicted by Fick's laws of diffusion, while no diffusion was occurring in the ECE treated slabs. By combining the top trace data for crossing bars from the SHRP study with data from the nominal depth of 1.5 inches (38.1 mm) in this study, figure 3 was developed. Although chloride content at the nominal depth of 1.5 inches (38.1 mm) was not from the trace of the top crossing bar, it represents chloride content of 1 inch (25.4 mm) of concrete above the top rebar and agrees reasonably well with the chloride ion content from the top crossing bar traces.
Figure 3 shows the diffusion of chloride ions with time from the top trace of the top mat rebar of slab 2. A similar but much lower magnitude trend is discernable in the ECE slabs, which is in agreement with data presented in figure 2. The chloride ion content above the top rebar trace in slabs 3 and 4 was higher than the other ECE slabs.
The chloride ion content at the top mat of reinforcing steel in all slabs was over the threshold required to initiate corrosion (260 ppm), and the chloride ion content at the bottom mat of reinforcing steel was below the threshold. Thus, all slabs had sufficient chloride ion concentrations at the top mat reinforcing steel to initiate corrosion and a sufficient difference in chloride ion concentration between the top and bottom mats to set up a macrocell corrosion cell between the two mats.
Several visual and delamination surveys were performed during this study. Photographic documentation of observations was made when necessary. Because the slabs were small and thin, conducting delamination surveys using sounding techniques was difficult. Sand was placed on the surface of the slabs, and the movement of the sand upon striking a hammer on the surface was used to detect delaminations.
Due to degradation of the epoxy, rust stains on the external sections of the rebars were noted at the start of this study. All bars exhibiting rust stains were cleaned, and new epoxy was applied. Many of the resistors and switches connecting the top to the bottom mat reinforcing steel were repaired and replaced as necessary.
The SHRP study reported that the corrosion of reinforcing steel remained active throughout the 40-month study, and a crack had formed along a top mat rebar. This crack grew over time, and by May 1998, the crack tracked down the side of the slab and terminated on top of the rebar. The condition of the crack in August 1994 can be seen in figure 4 and figure 5. Figure 6 shows the crack's termination on the rebar in 1998.
From August 1994 to the last survey in May 1998, additional cracks were observed on the top surface and the sides of the slab. A few hairline cracks were observed in 1995 on the top surface of the slab, which were not associated with any reinforcing steel.
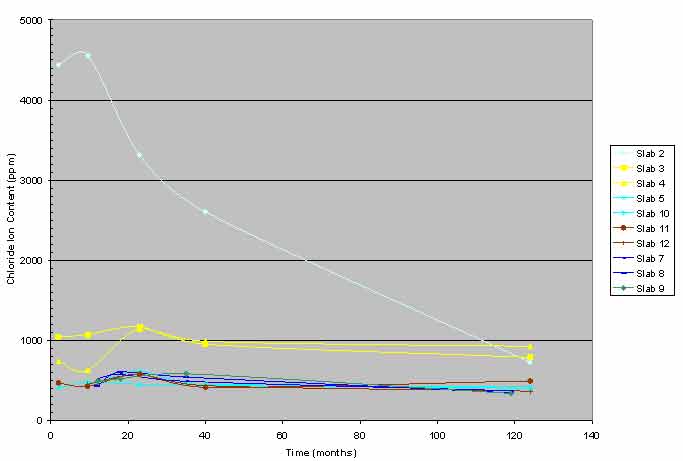
Figure 3. Graph. Chloride content versus time.
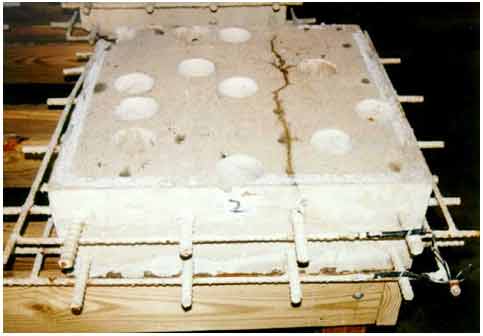
Figure 4. Photo. Condition of crack on the top surface of slab 2 in August 1994.
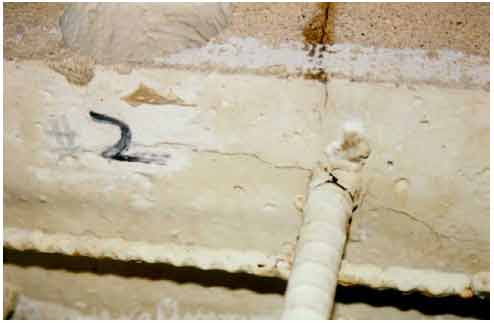
Figure 5. Photo. Termination of the top crack and other cracks on the front side of slab 2 in August 1994.
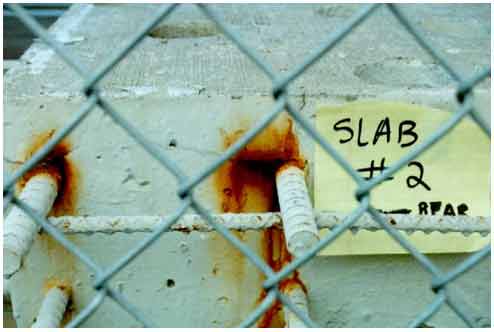
Figure 6. Photo. Cracks and corrosion products on the rear side of slab 2 in August 1998.
Cracks were also noted on the inside of core holes, and these cracks exhibited rust staining (see figure 7). Cracks in the core holes were determined to be at the level of the reinforcing steel. Corrosion of the ends of the rebars exposed in core holes was also noted (see figure 8). The cracks on the sides of the slabs continued to form and grew wider over time. They primarily originated at the external section of the rebars. On one side of the slab, a crack either connected or just passed over all four rebars protruding out of the concrete (see figure 9). Rust staining was observed on some of these cracks.
Delaminations detected on the surface of the slab increased, and by the end of the study, approximately 66 percent of the slab surface was delaminated. The presence of the crack along the rebar, cracks in the core holes, and cracks on the sides of the slab correlated with the delaminations that were detected. An autopsy of the single core collected from the slab in December 1999 indicated ongoing corrosion in localized areas of the extracted rebar. Expansive corrosion is shown figure 10.
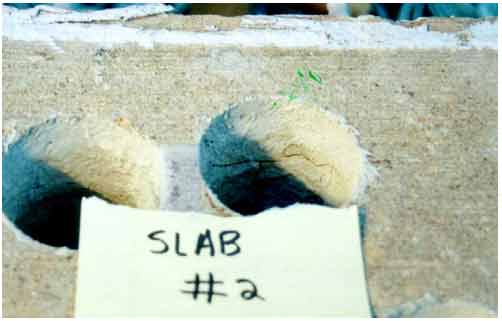
Figure 7. Photo. Cracking and rust staining at the level of reinforcing steel in core holes of slab 2.
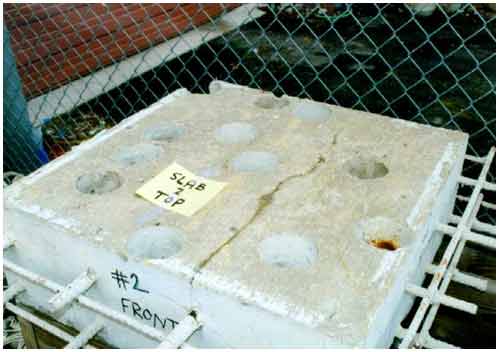
Figure 8. Photo. Corrosion on the ends of rebars exposed in core holes of slab 2.
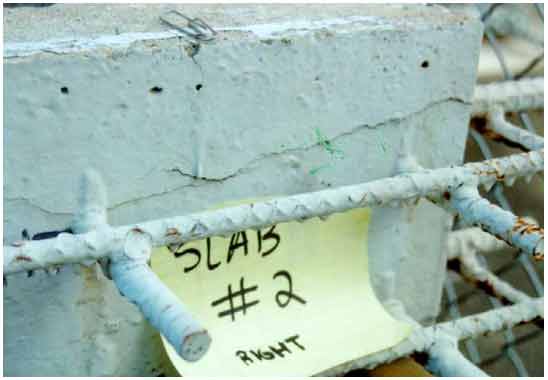
Figure 9. Photo. Crack on the right side of slab 2.
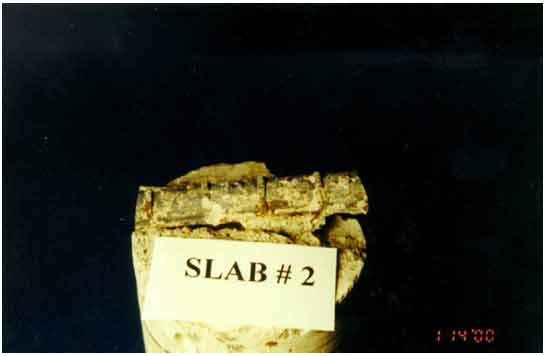
Figure 10. Photo. Autopsy of core extracted from slab 2 in December 1999.
In early 1995, slabs 3 and 4 started showing cracks on the sides, which widened and increased over time. Similar to the cracks on slab 2, many of these cracks originated at the protruding rebars and either connected or passed over them. Corrosion of the rebars just inside the concrete on the side of the slab resulted in a spall on slab 3 by September 1997 (see figure 11). Rust stains accompanied by cracks were observed on the sides of slab 4 as well (see figure 12). Corrosion of the rebar just inside the concrete also resulted in a delamination on slab 3 (see figure 13).
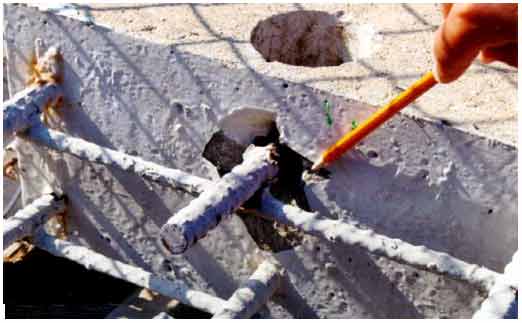
Figure 11. Photo. Corrosion and spalling on one rebar at the concrete-air interface on the side of slab 3 in September 1997.
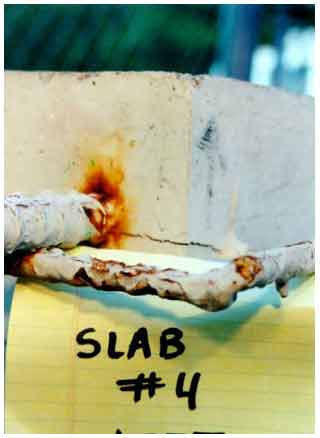
Figure 12. Photo. Rust staining and cracking on the side of slab 4.
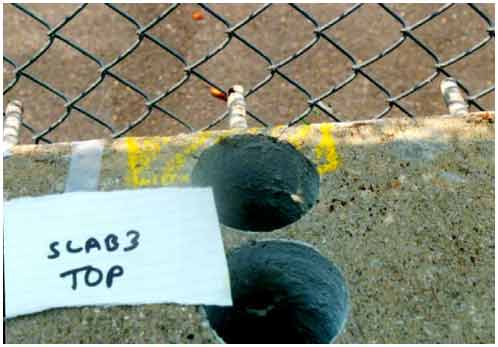
Figure 13. Photo. Delamination (marked in yellow) found on the top surface of slab 3.
These slabs exhibited hairline cracking on the top surface, and the number of hairline cracks on the top surface increased with time. On both slabs, one crack connected two core holes on the opposite sides of the slab. Many of the hairline cracks initiated at core holes. Rust stains were noted on the top surface of both slabs (see figure 14). Corrosion of ends of rebars and continuity wires in core holes were observed. No ongoing corrosion was detected on the extracted rebar during autopsy of the core collected in December 1999 (see figure 15).
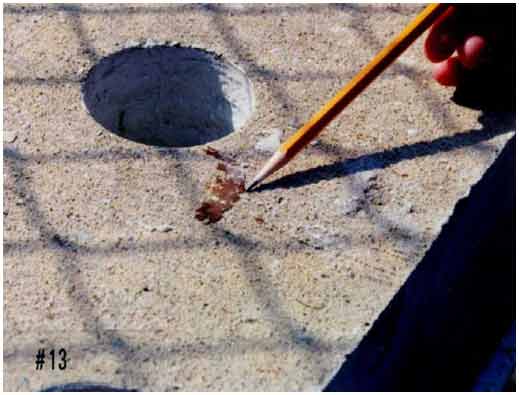
Figure 14. Photo. Rust staining on the top surface of slabs 3 and 4.
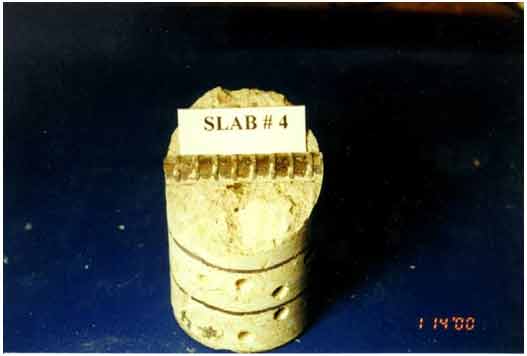
Figure 15. Photo. Autopsy of core extracted from slab 4 in December 1999.
By spring 1997, cracks on the top surface of slab 5 appeared adjacent to core holes. Two vertical cracks were also noted on one side along the wall formed by a core hole. A few rust stains were observed on the surface, but they were not accompanied by cracks (see figure 16). By late 1998, a delamination was noted along the edge of the slab and adjacent to a core hole with vertical cracks. By January 1998, concrete failure occurred adjacent to the core hole between the vertical cracks in the delaminations, and the delaminations had grown to the adjacent core hole (see figure 17). The number of cracks on the sides of the slab increased with time, and there were rust stains in core holes adjacent to ends of exposed rebars.
At the inception of this study, only one crack was observed on the side of slab 10. By January 1998, some rust stains appeared on the top surface of the slab, but they were not accompanied by cracks (see figure 18). The number of cracks on the sides of this slab increased with time, and there were rust stains in core holes adjacent to the ends of rebars. In May 1998, a pop-out (i.e., a small piece of pavement broken loose from the surface) adjacent to a core hole was observed.
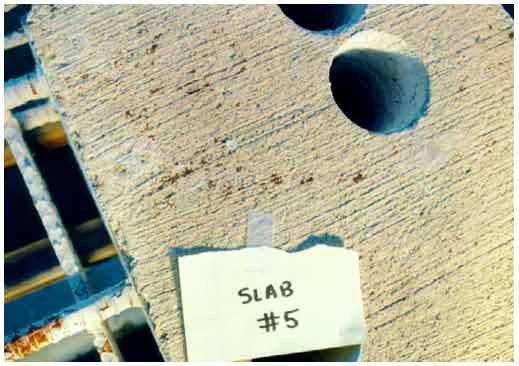
Figure 16. Photo. Rust stains on the top surface of slab 5.
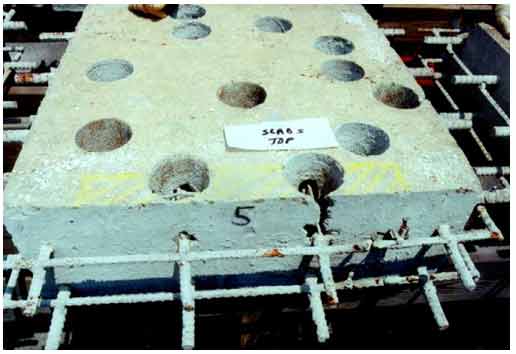
Figure 17. Photo. Delaminations (marked in yellow) and concrete failure near a core hole on slab 5.
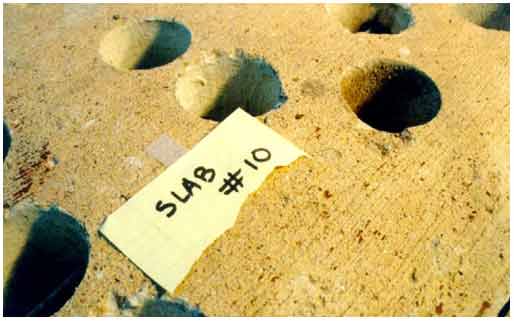
Figure 18. Photo. Rust stains on the top surface of slab 10.
No signs of deterioration were observed until spring 1997. Noncorrosion-related failure of the corner adjacent to a core hole on slab 11 (see figure 19) and failure of a core hole wall on slab 12 were observed. A rust stain appeared on the surface of slab 11, and rust stains were found at external sections of the rebars. By the end of the study, more cracks appeared on the sides of the slabs, and rust stains in core holes increased. An autopsy of the rebar extracted from a core in December 1999 showed no evidence of any corrosion (see figure 20).
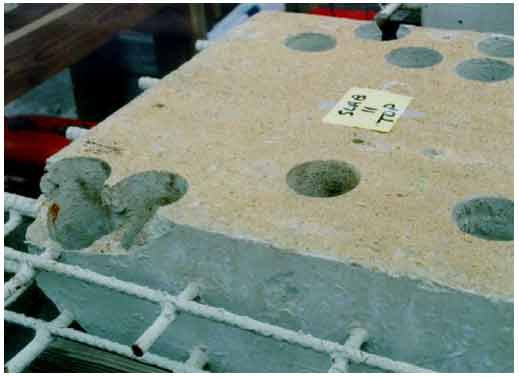
Figure 19. Photo. Noncorrosion-related concrete failure adjacent to core holes on one corner of slab 11 in spring 1997.
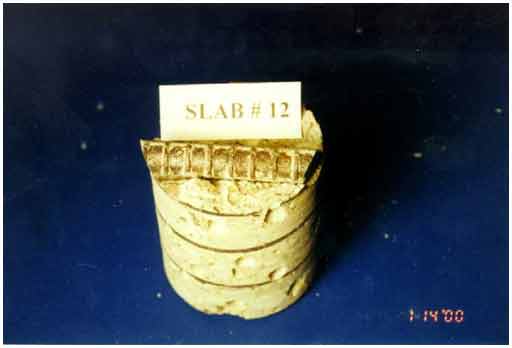
Figure 20. Photo. Autopsy of core extracted from slab 12 in December 1999.
At the beginning of the study, two fine cracks were observed on the top surface of slab 7, one of which was along a rebar. Two hairline cracks along rebars were also noted on the top surface of slab 8. No rust staining was associated with any of these cracks. By early 1997, a few cracks on the sides of the slabs appeared and were accompanied by rust stains at the external sections of rebars. In January 1998, a new crack and scattered minor rust stains were observed on the top surface of slab 8. By the end of the study, cracking on the sides of these slabs had increased, and there were rust stains inside the core holes. Rust stains created during the application of ECE by the use of steel mesh were not included in the analysis and are not included in this report.
No corrosion-induced damage was observed throughout the study on slab 9, with the exception of two rust stains that appeared in late 1997. A concrete spall in a core hole was noted in spring 1998, and some chipped concrete was observed adjacent to core holes in mid 1998.
To reduce the impact of temperature during measurement, macrocell currents were adjusted to 69.8 °F (21 °C) using a procedure developed by an FHWA study.(3) The impact of standardizing the macrocell currents to one temperature was minor in the analysis of the data.
The macrocell currents and the driving voltages of the slabs showed the difference between the control slab and the ECE slabs (see figure 21 and figure 22). The control slab's driving voltage and the macrocell currents were much higher throughout the study than that of the ECE slabs and correlated well with the observed damage.
The ECE slabs had much lower macrocell current and driving volts and exhibited lower levels of damage. The driving volts and macrocell currents for the ECE slabs varied within a narrow range, and no specific trend was observed over time. Analysis of variance of the data indicated that the driving volts and macrocell currents for slabs 3 and 4 were statistically different than those of the other ECE slabs. Figure 22 indicated that the driving volts for slabs 3 and 4 were somewhat higher than the volts for the other ECE slabs, especially after 40 months of monitoring. Such a difference was not noticeable in the macrocell data in figure 21. The higher driving volts and macrocell currents for these slabs correlated well with the amount of chlorides at the top mat steel level and the observed damage. The macrocell currents and driving volts for slabs 3 and 4 increased closer to the end of this study.
The macrocell currents and driving voltages of all ECE slabs were significantly lower than those of the control slab, and they indicated the level of reduction in corrosion of the rebars that had resulted from application of ECE. If the time-averaged macrocell current was calculated for each slab from the data in figure 21, the time-average macrocell current for the control slab was a minimum of 13 times larger than the time-average macrocell current of the individual ECE slabs.
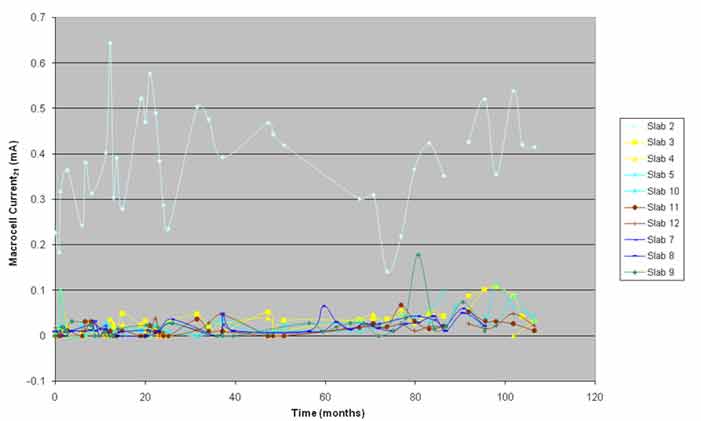
Figure 21. Graph. Macrocell current at 69.8 °F (21 °C) versus time.
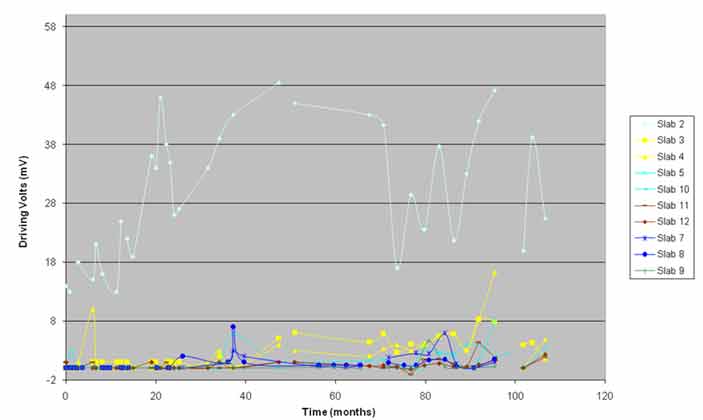
Figure 22. Graph. Driving volts versus time.
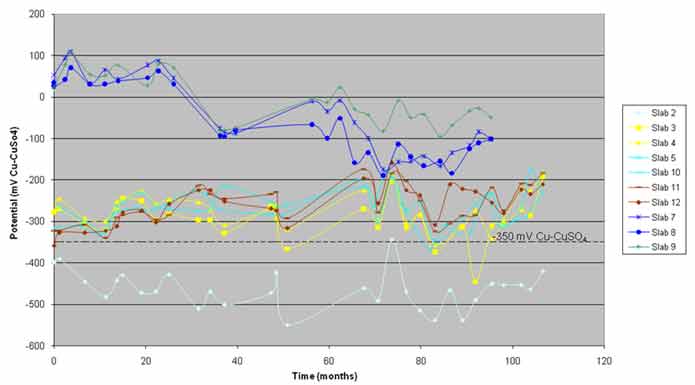
Figure 23. Graph. Average half-cell potential versus time.
At the start of the SHRP study, 40 half-cell measurements were made per slab with respect to the copper-copper sulfate reference electrode. With the collection of the cores, the number of half-cell measurements reduced with time. In this study, 12 measurements were made on each slab during each evaluation. The potentials on the n-ECE slabs were positive during the SHRP study. Valid half-cell potentials must be negative with respect to the copper-copper sulfate reference electrode. It was concluded that the reason for the unexpected positive readings of the n-ECE slabs was the formation of junction potentials because the pH of the top layer of concrete was not maintained at the normal alkaline levels of concrete.
The average half-cell potential variation for each slab in figure 23 suggests that the slabs can be subdivided into three categories: the first category contains the control slab, the second category contains pH-ECE slabs, and the third category contains n-ECE slabs. As expected, the control slab exhibited active (more negative than −350 mV) potentials, which correlated well with the damage observed, macrocell currents, and driving voltages for the slab.(4) The pH-ECE slabs exhibited average potentials in the uncertain range (−200 to −350 mV) with the exception of slabs 3, 4, and 10. On three occasions for slab 3 and on one occasion for slabs 4 and 10, there were average potentials in the active range.(4) The average potential of the n-ECE slabs steadily decreased (become more negative), and after 35 months of exposure, they exhibited negative values. After 70 months of exposure, slabs 7 and 8 stabilized in the −100 to −200 mV range, whereas slab 9 stabilized in the zero to −100 mV range. This trend can be explained by the migration of ions that resulted in the junction potentials created.
Figure 24 shows the distribution of active potentials measured on each slab. The control slab remained active throughout the study, and 100 percent of its potentials were active. Slabs 3 and 4 showed an increase in active potentials several times during the study, and at one time, all potentials on slab 3 were active. Slabs 5 and 10 showed an increase in active potentials once during the SHRP study and several times after 80 months of exposure. Slabs 11 and 12 exhibited active potentials once during the SHRP study. Macrocell currents and driving volts also showed a corresponding increase in activity for slabs 3–5 and 10.
SHRP researchers performed two to six corrosion rate measurements on each slab, depending on the type of evaluation. In this study, three measurements were performed on each slab during each evaluation. The linear polarization corrosion rate device (3LP-NBS) was used for all corrosion rate measurements. The average corrosion rate measurements for each slab as a function of time are presented in figure 25.
The average corrosion rate measurements for the n-ECE slabs were in the expected range and did not vary significantly over time. The macrocell currents, driving volts, and visual observations supported the corrosion rates for these slabs. The corrosion rate measurements on the control slab were in the expected range and were supported by the amount of damage observed on the slab. The variation in corrosion rate with time was somewhat in unison with the macrocell currents.
In contrast, the corrosion rates for the pH-ECE slabs were unexpectedly higher than the n-ECE slabs and were similar to the rates for the control slab. The corrosion rate data for these slabs were not supported by other data such as the macrocell currents, driving volts, and the physical condition of the slabs.
Corrosion rate measurements were influenced by many variables including concrete temperature, relative humidity inside the concrete, concrete resistance, etc. After the application of ECE, low corrosion rates are normally expected. As a result, the high corrosion rates observed for pH-ECE slabs contradicted that expectation. Either ECE was not effective or the rate measurements did not accurately reflect the true values. The effectiveness of the ECE process was demonstrated by all other data. Thus, the accuracy of the measurement was suspect. The difference in the corrosion rates measured between pH-ECE slabs and n-ECE slabs suggests that the control of pH impacts the ability to accurately measure corrosion rates. No experimentation was performed either in the SHRP study or in this study to ascertain the impact of pH control during the application of ECE on the measurement of corrosion rate.
The 3LP-NBS device does not have any control over the length of the rebar over which the measurement was made. For the purpose of calculating the corrosion rate, the length and size of the rebar under the probe of the device was used. Generally, the device makes the measurement over a much larger length of the rebar than the length that used in the calculation. The length of the rebar effected by the measurement was dependent on the depth of the rebar and the resistance of the concrete between the probe and the steel. An estimate of resistivity between the probe and steel can be obtained by looking at the resistance between the two mats of steel. Although the resistivity of the top layer of concrete and the layer of concrete between the two mats may not be the same, the change in resistivity probably would be in unison. Resistance between the two mats normalized to 69.8 °F (21 °C) is presented in figure 26, which shows that the resistance of the slabs increased over time. As increase in resistance reduced the error in the measurement of the rate and the actual corrosion currents also reduced. Thus, the increase in resistance should be accompanied by a reduction in the corrosion rate measurements. Figure 24 shows the reduction in corrosion rate with time as resistance increased. The variation in the corrosion rates with time is partially explained by the increase in resistance.
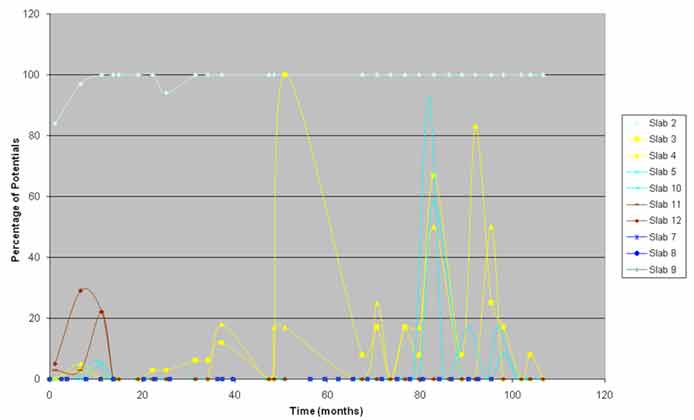
Figure 24. Graph. Percentage of active potentials versus time.
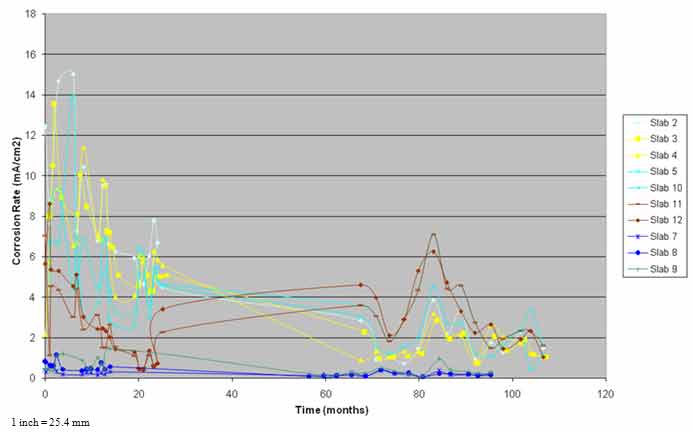
Figure 25. Graph. Corrosion rate versus time.
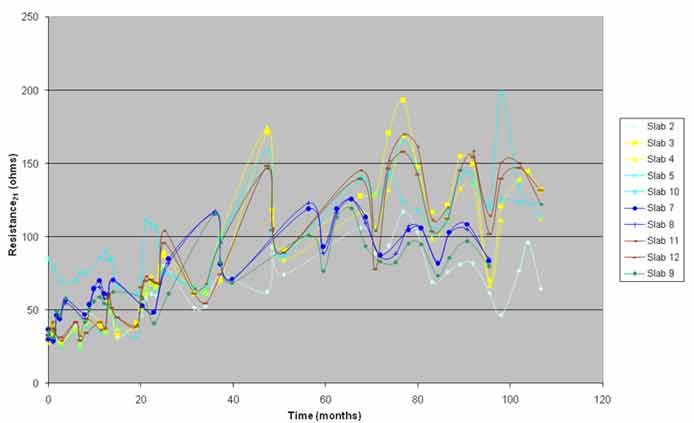
Figure 26. Graph. Resistance rate at 69.8 °F (21 °C) versus time.
The controlling parameter for initiation of corrosion of steel embedded in concrete is the ratio of chloride ions to hydroxyl ions at the steel-concrete interface. In untreated concrete, the concentration of hydroxyl ions at the steel-concrete interface varied within a narrow range. Because measuring the concentration of the hydroxyl ion at the steel-concrete was difficult, if not impossible, the chloride ion concentration (required to reach the critical chloride/hydroxyl ion ratio at the normally occurring concentration of hydroxyl ions in concrete) was used as the threshold designator. In ECE treated concrete, the hydroxyl concentration at the steel-concrete interface was much higher, and the generally accepted threshold value of chloride ion concentration for corrosion initiation was not applicable.
During ECE treatment, chloride ions were extracted from the concrete, producing a concentration gradient of chloride ions with depth. Simultaneously, the hydroxyl ion concentration at the steel-concrete interface was increased. Typically, the chloride ion concentration at the steel-concrete interface is lowered to levels below the generally accepted threshold of untreated concrete and increases with distance from the rebars in all directions, especially toward the surface where the temporary anode was installed. If the concentration of chloride ions increased and/or the concentration of hydroxyl ions was reduced at the steel-concrete interface, the critical chloride/hydroxyl ion ratio would be exceeded. Thus, the effectiveness of ECE was dependent on remigration and/or ingress of chloride ions and concentration of hydroxyl ions generated during ECE and their dissipation.
Because it was difficult to measure the hydroxyl ion content at the steel-concrete interface, the chloride ion concentration and detection of corrosion on the reinforcing steel must be used to ascertain the effectiveness of ECE. The presence of ongoing corrosion was detected by visual observation of tell tale signs of ongoing corrosion, detection of corrosion induced damage by delamination survey, and measurement of macrocell current, driving volts, half-cell potentials, and corrosion rates.
The chloride data for the ECE slabs indicated that the change in chloride ion concentration at the steel-concrete interface over 10.25 years was minimal (see figure 3). The difference in concentration of chloride ions between slabs 3 and 4 and the remaining slabs was attributed to the lower level of treatment (charge passed) for these two slabs. Figure 2 suggests that some remigration of chloride ions occurred in the third lift of concrete, although it was small in comparison to the control slab. At the end of the study, the concentration of chloride ions in all ECE slabs (except slabs 3 and 4) in the second and third lifts of concrete was uniform, and a sufficient gradient did not exist for significant further diffusion to occur. It should be noted that data in figure 1 and figure 2 came from only one core per slab which did not account for variations from one location to another in a slab. Although the data are limited, they are definite with explainable and expected trends.
A visual and delamination survey differentiated the control slab from the ECE slabs. The control slab suffered significant corrosion-induced damage, and the increase in damage was supported by macrocell, driving volt, half-cell, and corrosion rate data.
Although, cracking was observed on the sides of almost all slabs, it was not necessarily a reflection on the effectiveness of the ECE treatment. It was concluded that corrosion of the rebar at the concrete-air interface was not chloride induced. Instead, it was induced by exposure of the rebar to the environment due to weathering of the epoxy coating. This resulted in the formation of cracks at and near protruding rebars on the sides of the slab. Also, rebar ends exposed in core holes that were epoxy coated corroded and caused some cracking inside them.
Among ECE slabs, slabs 3 and 4 exhibited the highest level of cracking on the top surface. The macrocell, driving volt, and half-cell data indicated that corrosion activity was initiated in these slabs. If the cracking on the sides of slabs was eliminated from the analysis, only a few hairline cracks and rust stains were observed on the top surface of the ECE slabs. Evaluation of the origin of the rust stains on the surface of the ECE slabs indicated that they were not associated with corrosion of the embedded reinforcing steel. The pattern of distribution and the shallow penetration of the stains suggested that they were generated by corrosion of steel filings embedded in small cracks in the surface. The steel filings were produced during the extraction of steel in many of the cores.
The following conclusions were made:

