U.S. Department of Transportation
Federal Highway Administration
1200 New Jersey Avenue, SE
Washington, DC 20590
202-366-4000
Federal Highway Administration Research and Technology
Coordinating, Developing, and Delivering Highway Transportation Innovations
 |
| This report is an archived publication and may contain dated technical, contact, and link information |
|
Publication Number: FHWA-HRT-06-095
Date: May 2006 |
In certain respects this last chapter takes the reader back to the beginning of this document because its focus is to reaffirm the benefits of a corridor mindset of looking at transportation issues. The chapter presents two very different examples of CFA operations. The first example showcases a real-world application of the CFA operations framework. The second example uses a hypothetical major incident and the resulting operations both with and without CFA strategies in place.
The following example focuses on the planning and analysis required to develop relatively simple, low-tech coordination between freeway and arterial operations in a heavily traveled suburban area. The example is based in Springfield, VA, a suburb of Washington, DC. In this case, many of the institutional issues are less complex than typical coordinated operations given that the same agency, the Virginia Department of Transportation (VDOT), is responsible for freeway and arterial operations in this area. This example uses the CFA operations framework detailed in chapter 3.
In the heavily congested Northern Virginia region, VDOT is responsible for operating the vast majority of roadways. The agency operates a freeway management system, the Northern Virginia Smart Traffic Center (NVSTC) and an arterial signal control system, the Northern Virginia Smart Traffic Signal Systems (NVSTSS). While each system is well suited to manage traffic on their respective portions of the surface transportation network, there is little technical integration between them. A key way that VDOT has worked to integrate freeway and arterial operations in the region is to use the NVSTSS to select appropriate timing plans to best accommodate diverting freeway traffic when alerted by the NVSTC. To date, however, VDOT generally selects an existing timing plan (i.e., a.m. peak, p.m. peak, off-peak) as opposed to a plan specifically designed to accommodate diverting freeway traffic. Despite this practice, VDOT traffic engineers expected that improved integrated operations can be realized by developing timing plans better tailored for diversion.
To address this problem, VDOT selected a particular freeway/arterial diversion that is among the most frequently used in the region for a case study. This diversion is designed to accommodate southbound I-95 traffic in the vicinity of the Springfield Interchange (known as the "Mixing Bowl") where I-95, I-395 and I-495 meet in Fairfax County, VA. As seen in figure 20, southbound South Van Dorn Street to westbound Franconia Road comprise VDOT's designated incident diversion route in case of freeway lane(s) closure due to traffic incident, construction, or special event.
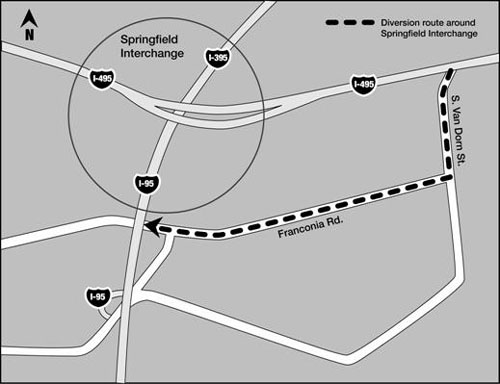
Figure 20. Drawing. Map of project area (black arrow shows the forward direction of diversion route.)
The route is approximately 4.0 km (2.5 mi) long. Traffic signal controls along the diversion route are not coordinated as a single system. The four traffic controllers on the Van Dorn Street are coordinated and are within one zone. The signal controller at the Van Dorn Street and Franconia Road is uncoordinated. The first four traffic controllers on the Franconia Roads along the diversion routes are coordinated and belong to a separate zone. The remaining controllers are also coordinated but are in a different zone.
The problem identified by VDOT engineers is to develop the best timing plans for use on arterials when freeway diversion occurs, making the best use of resources afforded by the NVSTC and NVSTSS.
In this scenario, both the arterial and freeway systems are operated by VDOT. This greatly simplifies the challenge of coalition building. For many years, VDOT has worked to break down artificial barriers between different operating units of the organization. For example, the managers of the NVSTC and NVSTSS both report to the same individual within the agency. However, beyond organizational structure, the key aspect to coalition building is a commitment to continued communication between operators of the NVSTC and NVSTSS.
There are multiple, and often conflicting, goals associated with this form of freeway and arterial coordinated operations. The goals are as follows:
Clearly, these goals are conflicting. As one gives more and more green time to the diversion movement, side street traffic suffers greater with each delay. Careful attention to the balance of these goals was important to VDOT in considering this form of integrated operations.
Performance measures selected to measure achievement of the goals and objectives were simply traveltime and throughput.
The concept of operations needs to identify:
The existing freeway (NVSTC) and arterial (NVSTSS) management systems are to be used in a coordinated manner to affect a freeway diversion route in response to freeway congestion. The system to be used is basically a low-tech implementation of a specific diversion route, and optimizing the system for the diversion. It primarily involves improved traffic signal timings.
The proposed strategy is totally on the State highway system, minimizing the need for stakeholder consensus building. The amount of resources required to develop, operate, and maintain is minimal. No policy changes are required.
As part of the development of a concept of operations, the following points were considered:
Alternatives that VDOT is considering to address this problem include both new timing strategies and modest geometric changes. In addition, new designs must be compared to the current operations strategy to assess if they result in significant improvements that warrant full development.
First, it is important to describe the capabilities provided by the NVSTSS. The system controls more than 1,000 signalized intersections in the region using a centralized, computer-based traffic signal control system. The system allows traffic signal operators to monitor traffic flows at intersections through a graphical user interface, to update signal timing plans in real time, and to maintain a database of signal timing plans and traffic data. Thus, the system will fully support the development of customized timing plans to dynamically activate when freeway to arterial diversion is necessary.
Currently, when a major crash occurs on a freeway, the NVSTC relays the location and severity of the crash to an NVSTSS operator. Then, the NVSTSS operator checks traffic conditions along the diversion route and updates signal timing plan accordingly. The current practice is to use the peak timing plan corresponding to the direction of the diversion. In the Van Dorn/Franconia diversion considered in this case study, the p.m. peak timing plan is implemented.
The primary alternative considered is a signal-timing plan optimized to accommodate diverting traffic flow. In this case, all 10 intersections of the diversion route are coordinated. The next section will detail the approach used to design this plan. In addition, based on experience and field inspection, a simple geometric change was considered as an alternative. Currently, the I-495 exit to the diversion route (southbound Van Dorn Street) consists of three lanes (one exclusive left turn, one exclusive right turn and one left and right turn shared lanes). An alternative was to modify this facility to include one exclusive left turn lane and two exclusive right turn lanes to better accommodate diversion.
Combining the issues discussed above results in three alternatives for consideration:
The scenarios considered were weekday off-peak period and p.m. peak period. These were chosen to examine diversion during already congested conditions (p.m. peak) when it is likely that little excess demand from the freeway can be serviced by the arterials and during uncongested conditions (off-peak) when it is expected that arterial diversion is more feasible.
The "base" projected diversion volume is assumed to be the additional volume resulting in a volume to capacity ratio of 0.95 at the critical intersection (in this case, the intersection of the I-495 exit and Van Dorn Street). Based on this definition, the base diversion volume that could be accommodated during off-peak was 1,670 vehicles/hour, and 100 vehicles/hour during p.m. peak conditions. Immediately, one will see that this clearly illustrates that very little benefit can be realized from diversion during the p.m. peak, given the already congested conditions of the arterial diversion route. However, this illustrates the potential benefits of using the route during off-peak.
To investigate the sensitivity of the alternatives to variations in diversion demand, the evaluation was conducted at the projected diversion volume, and at levels 10 percent greater and less. However, given that the projected additional feasible diversion demand is so low during the p.m. peak, the negative 10 percent scenario was not considered.
All the alternatives for the weekday off-peak period are illustrated in figure 21 and all the alternatives for the p.m. peak period are illustrated in figure 22.
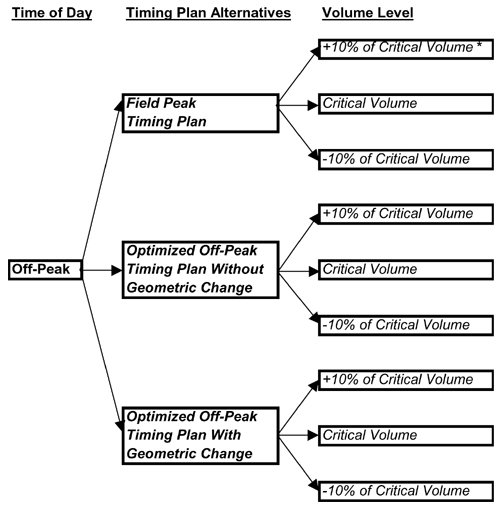
* Critical Volume is the critical intersection's critical movement's demand at the volume to capacity ratio 0.95.
Figure 21. Chart. Off-peak strategy alternatives.
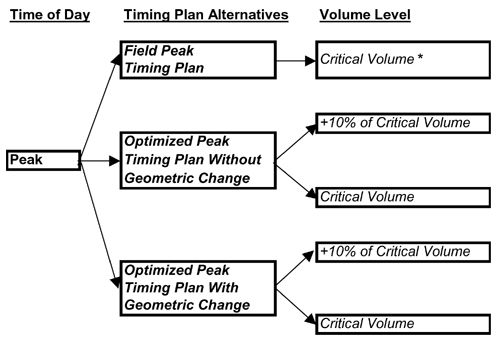
* Critical Volume is the critical intersection's critical movement's demand at the volume to capacity ratio 0.95.
Figure 22. Chart. Peak strategy alternatives.
The design and evaluation process required the collection of large amounts of data and careful attention to model calibration. While it does require significant staff or consultant resources, the process results in a design that is well understood before field implementation. The process involved to develop and evaluate the alternatives can be categorized into three major tasks:
The results of the simulation testing are categorized as follows:
The average traveltime was plotted against the cumulative throughput for each alternative. It revealed that a customized timing plan for diverting traffic is warranted during off-peak conditions only in the forward direction of the diversion route.
The three alternatives were analyzed in the forward direction of the diversion routes during the weekday off-peak period at critical volume condition and revealed the following:
The three alternatives were analyzed in the forward direction of the diversion routes during the p.m. peak period at critical volume condition and revealed the following:
The analysis showed that alternative 3 works the best during the p.m. peak period. The throughput of alternative 2 compared to alternative 1 is 44 more vehicles at a traveltime saving of 7 seconds and 5 seconds less delay. Thus the optimized timing plan with or without geometric change is not much better than the p.m. peak timing plan. Again the field p.m. peak timing plan provides a more favorable performance measure for the reverse and side streets. The analysis showed that diversion during the p.m. peak should be avoided, as almost no relief to freeway traffic will be provided while increasing arterial delay.
The corridor implementation plan for this particular scenario is simple: incorporate the newly developed diversion optimized timing plan into the centralized signal control system, and then train operators to use it during off-peak periods.
A longer range corridor implementation plan that VDOT expects to develop after this project is to analyze all freeway diversion routes and develop optimized timing plans to improve this form of freeway and arterial integration.
The design of the preferred alternative, a custom diversion-timing plan for use during off-peak periods, is essentially complete following the signal timing optimization analysis. This can be implemented within the centralized signal control system.
Based on the results of the evaluation, a design modifying lane-use restriction at the intersection of the I-495 exit and Van Dorn Street is not warranted. The small level of benefits seen in some scenarios simply does not call for the effort required to design this change.
Given the capabilities of NVSTSS's system, implementation of this new strategy is very simple. The new timing plan need simply be stored for use when warranted.
However, an important step to implement new timing plans is to validate the plans' effectiveness in the field. VDOT's NVSTSS devotes significant resources to data collection and field monitoring when a new timing plan is implemented. This is done to identify unexpected problems associated with the plan and then make minor adjustments. This is necessary because any model, no matter how detailed, is a simplification of the real world. Rarely can they capture every nuance that may impact the performance of a timing plan.
Unfortunately, field validation of the optimized diversion-timing plan is more difficult than "traditional" plans. For example, the a.m. peak occurs every weekday morning. This allows VDOT to gather forces and equipment to plan for the validation effort. On the other hand, VDOT can rarely plan for when a diversion to take place during off-peak periods. This makes it more difficult to adjust the plan based on field observations.
Operation of the proposed design is based solely on effective communications between NVSTC and NVSTSS operations staff. This will ensure that the plan is implemented (and replaced) as soon as warranted.
Maintenance needs relate primarily to monitoring changing traffic demands in the region. As time progresses, and development patterns change, traffic patterns will be different than those used to develop the customized diversion timing plan. As these conditions change, it will be necessary to re-optimize the signal timings.
As VDOT continues to identify and develop timing plans best suited for freeway diversion, it realizes that nothing will remain constant. The plans developed will need to be revisited on a frequent basis. In addition, incident debriefs between NVSTC and NVSTSS staff will be necessary to ensure that communications remain effective and timely.
This example applies the CFA framework to a relatively straightforward freeway diversion to a parallel arterial under congested freeway conditions. While there were minimal institutional issues in this case study, it does demonstrate how the analysis might be undertaken to determine an appropriate strategy.
The above example reinforced the CFA operations process that was detailed in chapter 3. The following example reinforces the focus of chapter 5, the use of technologies to enhance CFA operations. Technologies including legacy systems, existing ITS deployments, and new systems resulting from the CFA planning process are combined in a hypothetical example. This idealized example has been created to simulate a complex urban environment where several governing entities and multiple agencies have partnered to enhance a major east-west travel corridor. The situation is presented as a hypothetical example of what can happen as a result of a major incident without leveraging ITS technologies in a coordinated manner and how the incident can be more successfully handled with good usage and coordination of ITS technologies.
Consider a major urban area situated along a navigable river with multiple east-west bridge crossings (figure 23). The river is also the border between two States and the urban area is actually two different cities in two different States. We are now, in this example, dealing with at least four different governing entities and several more municipal agencies and/or transportation authorities. Such an urban environment may have several basic ITS operating systems with attendant control devices and DMSs that have been deployed along many highways and bridge approaches over the past decade. The only effective way to alert motorists to difficulties on one of the bridge crossings is to share information so motorist alerts can be posted sufficiently in advance to allow diversions in one jurisdiction and warnings of an incident in another jurisdiction.
It is a typical weekday, there is a slight drizzle, and traffic is building toward the p.m. peak hour.
4:15 p.m.—A minor fender-bender occurs on the eastbound lanes of the Northern Interstate river crossing linking the downtown areas of both cities. A traffic queue immediately starts to build on the eastbound lanes.
4:20 p.m.—The incident is undetected by authorities.
Eastbound traffic begins to back up to the last exit before the river, and motorists approaching the backup make quick decisions to bail out to the surface streets (Exit 123) and the old six-lane bridge crossing down river several miles.
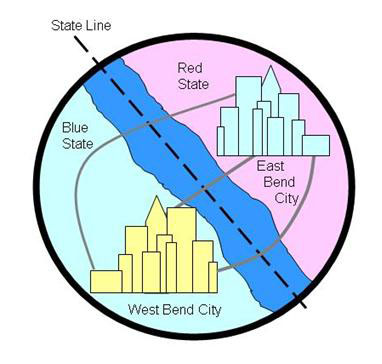
Figure 23. Chart. A major urban area situated along a navigable river with multiple east-west bridge crossings.
4:25 p.m.—The incident is still undetected by authorities.
Westbound traffic, now slowing due to motorists distracted by the incident, experiences a chain reaction collision involving four cars and several injuries. A regional transit bus driver, westbound on the Northern Interstate river-crossing, reports the westbound incident to his dispatcher at the same time the original eastbound accident is reported by cell phone by one of the involved motorists to Red State Highway Patrol who also reports that "no one is injured."
4:30 p.m.—Blue State's ITS TMC has a traffic flow reduction alert alarm going off and one of the TMC operators notes that traffic has slowed considerably at a TMC traffic monitoring location one mile before the Northern Interstate river crossing. A Red State Highway Patrolman contacts his base and reports an accident with no injuries at the same time the Regional Transit dispatcher reports an accident on the bridge with several injuries. West Bend City police dispatch is reporting unusually heavy traffic on city streets and severe congestion eastbound on the old six-lane arterial bridge. This is a particular problem for the West Bend City traffic engineer, who has programmed his new, ITS bridge lane-control signs and movable concrete divider to provide four lanes westbound and two lanes eastbound in accord with "normal p.m. peak hour traffic."
4:35 p.m.—West Bend City police are now hand-directing traffic to undo gridlock that has occurred on the streets approaching the six-lane arterial bridge which only has two lanes open for eastbound traffic. The oldest four-lane river crossing is now receiving the overflow traffic from its six-lane cousin upstream, and traffic is hopelessly backed into West Bend City where police report several fender benders probably "due to the wet highways." Emergency vehicles arrive at both the eastbound and westbound accident locations.
|
Even good intent and a cooperative spirit between governing entities may be inadequate to deal with the most mundane of traffic flow situations unless the processes described in this document have resulted in a deliberate CFA shared operations environment. |
4:45 p.m.—The local radio station, receiving information from its "Eye in the Sky" traffic chopper, is now reporting on the major bridge accident on Northern Interstate, jammed traffic regionwide, and suggesting motorists divert to the Southern Interstate. Unfortunately, the Southern Interstate bridge crossing witnessed the beginning of its long-term redecking project last night and is speed restricted with three narrowed lanes of traffic compared to its usual four lanes eastbound.
5:00 p.m.—Situation out of control! Communications ongoing between both city traffic engineers and both State DOTs is unproductive. The Blue State TMC is trying to divert traffic well in advance of the Northern Interstate river crossing via its DMSs but it is too little, too late. The regional transit authority is reporting major delays on many of their downtown lines in both West Bend City and East Bend City.
5:15 p.m.—The "Eye in the Sky" traffic chopper is reporting that traffic throughout the urban region is a mess today; little do they realize that their traffic reports, lacking coordination with those who operate the transportation systems, actually added to the chaos.
In analyzing the scenario described above, the areas where lack of a coordinated response had the most impact can be summarized as follows:
Now consider that same major urban area where the several bridge crossings are perceived by the multiple agencies and governing bodies as a corridor. The proper planning has been done, a framework has been developed, working agreements and relationships exist, scenarios and response strategies have been created, and operating ITS systems have been upgraded and integrated such that coordinated operations are a routine occurrence.
Once again, it is a typical weekday, there is a slight drizzle and traffic is building toward the p.m. peak hour.
4:15 p.m.—A minor fender-bender occurs on the eastbound lanes of the Northern Interstate river crossing linking the downtown areas of both cities. A traffic queue immediately starts to build on the eastbound lanes.
4:16 p.m.—The incident is detected by the surveillance and data collection cameras that cover 100 percent of this and all bridges in the urban region and is verified at the regional TMC.
4:17 p.m.—The lane control signs on the bridge immediately configure that lane out of service. Variable speed signs reduce the speed limit both eastbound and westbound on the bridge from 88.5 kilometers per hour (km/h) (55 miles per hour (mi/h)) to 56.3 km/h (35mi/h) in their emergency flashing mode. The DMSs at each bridge approach flash an accident alert. The eastbound DMS notes, "Accident ahead. Right lane closed," The westbound DMS notes, "Accident ahead. All lanes open. Reduce speed."
4:18 p.m.—The emergency response team is dispatched to remove the damaged vehicles. Preplanned diversion strategies in accord with "reduced eastbound Northern Interstate bridge flow during the p.m. peak hour scenario" are immediately brought online. Traffic eastbound is advised by DMS upstream that an accident has occurred on the eastbound lanes, the right lane is closed, and motorists may exit at Exit 123 and follow signs to the old six-lane river crossing. The surface street traffic signal system in West Bend City is instructed by the TMC to optimize southbound flow at the same time the six-lane bridge transition from its "normal p.m. peak hour operation" of four lanes westbound and two lanes eastbound is revised to allow three lanes in each direction. The regular transition to four lanes westbound and two lanes eastbound is delayed for the duration of the incident.
4:19 p.m.—The "Eye in the Sky" traffic chopper is reporting "slight delays on the Northern Interstate bridge crossing but it seems to be clearing. We'll fly on down to the bridge redecking on the Southern Interstate to see how the construction traffic is moving even though the TMC folks tell us traffic is moving normally."
4:30 p.m.—The incident is removed and the lane declared open via lane control signs.
4:35 p.m.—The incident over, traffic returns to normal. The West Bend City signal system is in normal p.m. peak hour operation, and the old six-lane bridge makes the transition to its normal p.m. peak hour operation.
In analyzing the scenario described above, the most significant successes and their results can be summarized as follows:
While the above example is hypothetical, it is nonetheless an accurate interpretation of what could be done with a well-planned CFA system enhanced with off-the-shelf ITS technologies. Likewise the above example is intended to demonstrate a complex urban environment and the substantial benefits that accrue when multiple ITS deployments work as an integrated urban system. In so doing, it is hoped that the reader will perceive and appreciate simple applications in a broad variety of corridor settings.
With its two examples, this chapter reinforces the essential message of this entire document, thinking in terms of transportation corridors. In so doing, the individual facilities within the corridor can be better optimized to serve its region. Essential to this process are technological devices and methods that enhance corridor optimization. The reader is guided to the technical publications referenced throughout this document for detailed information about associated programs and ITS related technologies.
FHWA-HRT-06-095

