U.S. Department of Transportation
Federal Highway Administration
1200 New Jersey Avenue, SE
Washington, DC 20590
202-366-4000
Federal Highway Administration Research and Technology
Coordinating, Developing, and Delivering Highway Transportation Innovations
 |
| This report is an archived publication and may contain dated technical, contact, and link information |
|
Publication Number: FHWA-HRT-04-094
Date: November 2004 |
||||||||||||||||||||||||||||||||||||||||||||||||||||||||||||||||||||||||||||||
Evaluation of LS-DYNA Soil Material Model 147PDF Version (2.87 MB)
PDF files can be viewed with the Acrobat® Reader® CHAPTER 9. DEVELOPER'S COMMENTSThis chapter was written by the developer of the soil material model. It begins with an itemization of topics (previously discussed by the user in chapters 2 through 8) that the developer concluded were worthy of additional discussion and explanation. These topics and the developer's comments are briefly itemized in table 16. Following all of the topics is a more indepth discussion of pertinent modeling issues and answers to some of the questions posed by the user. The developer wishes to thank the user for providing a detailed report on the initial use of the FHWA soil material model. The insights provided by a novice user of the soil model enabled the developer to incorporate needed improvements. However, it is the developer's opinion that the user's soil model evaluation revealed no substantial problems with the model. Instead, the evaluation exposed mainly what appears to be a misunderstanding of continuum mechanics material models and their use in finite element analysis. Table of Soil Modeling TopicsTable 16. Developer's response to user's soil model evaluation.
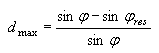
Itemized Soil Model TopicsIn this section, the developer discusses two of the more substantive issues raised by the user. Issue 1: Model Will Not Run to CompletionThe developer believes that the user made this statement because they found that their simulation of a direct shear soil test did not run for the entire range of displacement observed in the test. It is the opinion of the developer that the soil model performed correctly in this direct shear test simulation and no considerable action is required to "fix" the soil model. In the direct shear test, two metal cylinder halves containing a continuous soil volume are moved diametrically with respect to each other. Initially, the soil in one cylinder half interacts with that in the other at the continuous soil interface between the two. At first, the force needed to move the two halves of the test apparatus increases steadily up to a peak (as seen in figure 3 of this soil evaluation report). Then, as the soil in the interface region undergoes significant straining, it begins to sustain damage (causing it to soften) and its ability to resist continued displacement of the two cylinder halves decreases, leading to a significant decline from the peak value in the force needed to drive the displacement. Finally, once strain (or damage) is sufficiently great, the soil in the interface region separates (or fractures). From then on, the two soil halves interact only by sliding with friction against each other over the newly formed interface between them. In this part of the direct shear test, the force required to continue driving the displacement gradually decreases as the contact area between the two soil halves decreases. This last phase of the response can be seen in figure 3, starting at around 40 mm of displacement. The soil model is a continuum mechanics material model. It is designed to model the material response of the continuous soil material. Upon being used in the direct shear test simulation, it should predict the initial increase of the driving force in the experiment to peak value and the decrease of the force as the soil sustains damage. The soil model did this in the user's simulation (as seen in figure 6). It should also indicate material damage and separation (fracture) at the same force-displacement point observed in the experiment. The developer thinks that the soil model would have done this in the direct shear test simulation if the damage parameters had been properly adjusted. It is the job of the soil model to handle the portion of the simulation up to the point of material separation. The soil model is not responsible for treating the phase of the test (involving most of the force-displacement history in figure 3) in which two soil volumes interact principally through frictional contact as they slide with respect to each other. Such interaction typically is simulated in finite element analyses using sliding interfaces, or sliding surfaces, with friction. The user's finite element model simulation of the direct shear test does not provide for this sliding interface; so, fundamentally, the user's simulation is completely incapable of representing the force-displacement response once soil fracture occurs and the sliding interface between the two soil halves is created. Ideally, the soil model would create new finite elements or, at least, element faces at the newly created fracture surface that could be used during computational run time to add a sliding interface to the direct shear test analysis model. It does not. To the developer's knowledge, no existing material model does this for three-dimensional applications. Issue 2: Hourglass, ALE, and Element ChoiceThe user's soil model evaluation touches upon several issues that we collectively refer to here as the issue of "Hourglass, ALE, and Element Choice." Claiming that it is more accurate than the constant stress (1 gauss point) element, the user recommends the use of the fully integrated (8 gauss point) element in conjunction with the soil model. The user recommends using artificially reduced soil stiffness values to counter the well-known excessive stiffness of the fully integrated element. The user also suggests that use of ALE might be helpful in alleviating perceived soil model performance shortcomings. It is the developer's opinion that these issues have nothing to do with evaluation of the soil model, nor are any of these issues material model issues. No action with respect to the soil model is required to address these issues. The bold statement that the fully integrated element is more accurate than the constant stress element is unsubstantiated and, in fact, incorrect. The user likes the fully integrated element because it enables them to avoid dealing with hourglass control. However, to use the fully integrated element, the user recommends arbitrarily decreasing (i.e., "tweaking") soil stiffness properties to improve correlations obtained when using the element type. Hence, the recommendation is to use non-physical material properties in all analyses with the soil model. In contrast, the developer recommends the use of actual material properties, the constant stress element, and hourglass control. Neither the developer nor the user had an opportunity to evaluate the soil material model in conjunction with ALE. By bringing up ALE in their soil evaluation study, the user seems to be suggesting that it might help their direct shear test simulation to run to completion. Since the principal deficiency with the simulation model is its failure to offer any provisions for handling a newly created sliding interface between the soil halves, ALE, of course, is not a solution. Additional Evaluation TopicsMaterial Input Parameter StudyThe error with Spgrav has been fixed. This parameter is used to determine the initial volumetric strain associated with the air voids. The output for the material input variable spgrav has been changed to show "initial air voids" (the volumetric strain of the initial air voids), which is calculated from the input variables Spgrav, Rhowat, Rho, and Mcont. This calculated parameter is used in the simulation of pore-water pressure effects (moisture content effects). At this time, there is no data available for road base materials to determine the input parameters needed to simulate the pore-pressure effects. They may be determined by the testing of drained and undrained test specimens. Angle of Internal Friction: Damage and DilationOn page 23, the comment, "This result is counter to conventional soil mechanics theories" is only correct if there is no strain softening (damage). The amount of dilation (volume expansion) increases for a constant strain increment as the angle of internal friction increases. The strain softening (damage) is dependent on the dilation (i.e., as the dilation increases, so does the damage). Therefore, more damage occurs as the angle of internal friction increases. This increase in damage causes the apparent decrease in shear force as the angle of internal friction increases. The implication of these dependencies is that the damage input parameters must be changed in conjunction with the value of the internal angle of friction. Modified Yield SurfaceFigure 12 is somewhat misleading. The modified yield surface (hyperbolic approximation) cannot be set outside the Mohr-Coulomb yield surface. Since the parameter Ahypissquared in the yield function (see equation 14), it is always the absolute value. This behavior is shown in table 9 between test T16 and the baseline. Hence, there is no need to place a check on Ahyp to make sure that it is always equal to or greater than zero (see the conclusions). A caution possibly should be added to this section: "The input parameter Ahyp should not be set so large that the initial stress state lies outside the modified Drucker-Prager surface (hyperbolic approximation surface)." Iterations ParameterIn the discussion of the itermax parameter, it should be noted that the radial return method is used if itermax is set to 1. However, the radial return method is not accurate when strain softening is invoked or the yield surface is not smooth. There is a convergence tolerance for determining if the plastic stress state is close to the yield surface. DS-4 Simulation InstabilitiesThe instabilities in the DS-4 simulation are caused by a combination of the strain softening/erosion used in the material model and the element formulation. The FHWA soil material model includes strain softening (damage); once the element has been fully damaged, the model sets a flag to erode (eliminate) the element. This must be done because, at full damage, the element has no stiffness (internal forces). In the currentversion of LS-DYNA, the S/R solid element (8 gauss integration points) is eroded when the first gauss point is fully damaged. However, there are still internal forces associated with the eroded element because the other gauss points are not fully damaged. When the element is eroded, these internal forces are suddenly eliminated. This causes large unbalanced forces at the nodes of the eroded element, which, in turn, cause the shooting nodes behavior mentioned in this report. If damage/erosion of elements is not used because of this problem in the current version of LS-DYNA, then the well-known shear locking behavior dominates the simulation. The shear locking behavior manifests itself when the elements have large distortions (see note 4 for the *SECTION card in the LS-DYNA user's manual). The use of ALE may be used to overcome these problems. However, at long simulation times, the analysis becomes a simulation of almost two separate bodies separated by a slide surface with friction, which is not really a test of the FHWA soil material model. Determining Input Parameter ValuesIn many areas of the report, it is mentioned that the authors where unaware of any physical testing or theoretical means for determining the input parameters. In some of these cases, there are direct means (e.g., the Eccen parameter (see figure 2 of the soil model user's manual)).(2) For other cases, indirect methods, such as parameter fits, will need to be made using the material model. An example of this would be to use drained and undrained triaxial compression tests to determine the pore-water effects. In a few cases, there exists no theory. This is the case for the parameters involving strain softening (damage). With other materials, such as steel, concrete, and wood, there are parameters based on theory (fracture energy). To the developer's knowledge, such a theory does not exist at this time for soil. As mentioned in the soil model user's manual,(2) a method was developed for the FHWA soil material model that is similar to the fracture energy theory used for other materials. A second example of limited theory is pore-water (moisture) effects. To fully take into account the effects of pore water, a coupled fluid flow, solid mechanics analysis method is needed. However, the FHWA soil model makes an assumption that the soil deformation times are much shorter than fluid flow though the soil. Therefore, the moisture content (and other input parameters) is assumed to be constant for the simulation times used in vehicle impacts. Direct Shear Test SimulationThe user claims that the soil material model does not perform correctly in their direct shear simulation. This is a test in which two metal cylinder halves filled with soil are slid with respect to each other, resulting in shearing of the soil volume. Looking at the force predicted in their simulation as required to drive the deformation, the user states "the force builds up nicely" (peaking at a value close to the experimental data); next, "the soil begins to soften, as it should, until it reaches a valley at 24.6 mm of displacement"; and then, "the force begins to rise, which never occurs in physical tests." They claim that this means that the soil material model does not perform correctly. It is believed that this is the example analysis leading to the statement that the soil model "will not run to completion." The user's assessment of the performance of the soil material model in their direct shear simulation is erroneous. They appear either to have not thought out in detail the nature of the soil response in the direct shear test (and how to prepare a simulation capable of capturing that response) or are exhibiting a considerable misunderstanding of what is to be expected from continuum mechanics material models (of which the soil model is a member). Justification of these observations is provided in the following paragraphs. Soil response in the direct shear test occurs in two phases. During the first phase, even though half the soil tends to move in one direction and the balance in the opposite direction, the block of soil maintains its continuity. The material experiencing the greatest stress and strain is localized chiefly in a narrow region of the soil volume between the oppositely moving soil halves. The material in this narrow region sustains increasing strain as the direct shear test proceeds until material separation occurs and an interface develops between the two soil halves. Once this happens, the second phase of the direct shear test response begins. In this phase, the physical situation is best described as one-half of the original soil volume interacting with the other half only by sliding over the newly formed soil interface. However, the key point is that, in the second response phase, soil volumetric material response is no longer a controlling factor in how much force is required to continue displacement in the direct shear test. Instead, it is the frictional force acting over the interface between the two soil halves that correlates to the force needed to continue the shearing process. What does all this mean with respect to the FHWA soil model and how it performs in the direct shear simulation? There are two parts to the answer to this question. First, since the soil material model is a continuum model, for it to be useful, it must be able to correctly model the first phase of the direct shear test response. That is, it should accurately predict stresses developed throughout the entire soil volume, particularly in the transitional region between the two halves of the oppositely moving soil. It should predict the increase of stress up to some maximum and then the decrease of stress as the material softens because of damage. Finally, it should support separation or failure of the material if the strain exceeds levels for which the soil can remain in one piece. Second, again, since the soil model is a continuum model, it should not and cannot be viewed as the only part of the direct shear test simulation responsible for predicting the second phase of the response. As described above, this is dominated by the interaction across the interface of the two oppositely moving soil volumes. In analysis codes such as LS-DYNA, this sort of interaction is modeled using what are known as sliding interfaces. In this case, a sliding interface with friction would seem to be most appropriate. Such interaction is not handled by a material model. Based on a comparison of the direct shear simulation results obtained by the user using the FHWA soil model (figure 6) with the direct shear test results that they were attempting to model (figure 3), it appears that the FHWA soil model accurately correlates with the peak force and the displacement associated with that force as measured in the tests. The model also appears to soften accurately over an appropriate displacement range before it erroneously begins to harden again. Thus, it appears that the soil material model did not predict the fracture as it should have, although it otherwise correctly treated the first response phase of the direct shear test. Its failure to predict "failure" in this simulation is probably attributable to the inappropriate specification of material damage parameters. It is not evidence that there is a problem with the soil material theory or its computational implementation. Even if the soil material model (with the parameters used by the user in their direct shear test simulation) had correctly predicted material failure, the user would have failed to obtain good correlation with the test results for large displacements. This is because the analysis model (i.e., the entire finite element model) that they used is incapable of simulating the second phase of the direct shear test response. A sliding interface or surface is needed to do this. The soil material model is not designed to create one. (No material models in LS-DYNA are designed to do so!) The user states (page 30) that they would like "to correctly handle the direct shear test up to 100 or 200 mm of deflection, rather than only 25 mm in the current implementation." That being the case, the user will need to develop a better simulation model (i.e., the entire finite element model) of the test and obtain a far better understanding of what to expect from and how to use continuum material response models before they are likely to reach their goal. The user presents LS-DYNA material type 126 (modified honeycomb material) as an example of a material model that can handle very large deformations. They show an analysis example (figure 20) in which this model simulates extreme crushing of a material without presenting any analysis difficulties. They infer that a useful soil model must be able to do the same. While this is interesting, it is entirely irrelevant since the material crushing example involves only the deformation of a continuous material without the complication of material separation such as must occur in the direct shear test. To make the material crushing example relevant to the direct shear test simulation, punch-crushing the material in the former example would have to shear a hole into the crushing material rather than just crush it without causing development of new material surfaces. Material Model Parameters, Hourglassing, and Element ChoiceThe user performed an interesting evaluation of the material parameters used by the soil model. They pointed out some problems with a few of the developer's recommendations for parameter values; confirmed some of the other values by references to the literature; offered some good insight as to the care needed in obtaining values for other model parameters; and accurately noted that it is difficult, or impossible, to specify a particular test to measure some of the parameters. Sophisticated material models often contain some parameters whose values are not directly measurable, but may be inferred through correlations with test data. The user also states: "One of the most difficult tasks associated with finite element modeling is the selection of appropriate material properties to accurately represent physical behavior. This has led to, in many cases, the arbitrary 'tweaking' of models by matching simulation results to a known physical test, sometimes without regard to the reasonableness of the material input variables." The reason that this quotation is of note becomes apparent when considering the user's recommendation (page 43) that "it is recommended that element formulation 2" (fully integrated) "be used with the soil material model." The principal alternative to using the fully integrated element is the under-integrated element. The user's objection to the under-integrated element is that it can suffer from hourglassing. There are perfectly legitimate ways for controlling hourglassing, and the defense community has used them and the under-integrated element almost exclusively for more than 20 years. Hourglassing is understood and the control methods work. Of course, more than a beginner's understanding of finite element technology is required to correctly use hourglass control. The obvious problem with fully integrated elements is that they are too stiff. What is the user's recommendation for counteracting this deficiency? Consider what they write in the Conclusions and Recommendations section (page 49): "reasonable bulk and shear moduli for a 'sand and gravel' would be K = 80.5 MPa (0.0805 GPa) and G = 48.3 MPa (0.0480 GPa), respectively." Then, "However, these values yield an overly stiff response with the FHWA soil model. Suggested values are significantly lower" (by more than a factor of 10). This recommendation flies in the face of the implied condemnation of "arbitrary 'tweaking'" noted above. Obviously, the excess stiffness is a problem brought to the table by the element choice and not a consequence of the material model. User's Manual Questions and AnswersThe following questions were posed by an expert in soil mechanics from the user's team and were answered by the developer. The questions were posed by the user following a review of the developer's Manual for LS-DYNA Soil Material Model 147.(2) The questions resulted in changes to the soil model where appropriate. Question 1: In assessing damage, you set dmax as a function of the angle of internal friction ( Answer 1: The maximum damage allowed is related to the internal friction angle of residual strength by:
If The damage parameter is used to reduce the effective internal stress If the damage parameter d is allowed to go to 1, then the internal stress is zero, which for a finite element code such as LS-DYNA (explicit) causes the internal forces (element stiffness) to become zero. By not allowing the damage parameter d to become 1, this keeps a residual stiffness in the element. Setting Question 2: You state in your report that dilation of the soil signals a loss in friction between the particles that you represent by reduction of effective modulus. Any noncohesive soil undergoing shear needs to dilate to allow the particles to move around each other. It is not clear to me how this represents a loss of friction. Answer 2: This statement is somewhat confusing. The statement is based on data shown in Geotechnical Engineering by Holtz and Kovacs. They show data for dense sand (in a triaxial test) where the void ratio sharply increases as the peak stress is reached and continues to increase to a maximum value as the stress declines. For this data, the void ratio was determined by the increase or decrease of the volume of the sand specimen. Therefore, an increase in the void ratio can be interpreted as dilation (i.e., the dilation sharply increases as the peak stress is reached). We needed to use a strain value (volumetric strain) to implement the damage criterion algorithm because strain increments are the basic measurement in LS-DYNA. To avoid confusion, the statement has been changed to:
Question 3: In determining excess pore pressure, I do not understand how the dissipation is dealt with in your model. Generation of excess pore pressure in noncohesive soils is a very load- and dissipation rate-dependent phenomena. I do not see any permeability or tortuosity measures indicating parameters for dissipation. Answer 3: The excess pore-pressure method in the soil model does not include the dissipation of excess pore pressure as a function of time. The rate of dissipation can be a function of loading rate and soil parameters, such as permeability. However, at this time, the lack of experimental data on road base material on typical roadside tests would make this type of dissipative model useless. However, if experimental data and required parameters for roadside tests become available, then a dissipative model could be easily inserted. We believe that in most test reports of roadside safety tests that we have seen, moisture content and in situ void ratio are not reported. The void ratio can greatly change the basic strength of a given soil. Also, the void ratio is highly dependent on the amount of compaction. The parameters, such as permeability and tortuosity, are greatly dependent on the void ratio. We have tried to restrain the number of input parameters in the model that are difficult or impossible to obtain. Question 4: You state that the pore pressure is not allowed to become negative. In noncohesive soils, negative pore pressure can have profound effects on effective stress because of both capillarity and dilation during shear. I do not think that it is appropriate to set this constraint. Answer 4: The statement has been changed to: "The increment of pore-water pressure is zero if the incremental mean strain is negative (tensile)." This new statement is more descriptive of the actual coding used in the routine. See the equation for the pore-pressure effects on the bulk modulus on page 9 of the soil model user's manual.(2) Question 5: Your simulation of a direct shear test ends after about 40 to 50 mm of shear deflection. From the standpoint of deflections that we need to model, this is just getting to the interesting range. Is there a reason that you terminated the run at this short duration? Answer 5: LS-DYNA terminated the run at this time because of a known problem with how the element deletion algorithm is implemented for 8 gauss point brick elements. This was explained in the soil model user's manual(2) on page 42. We believe that the analysis after about 50 mm of deflection is not a test of the soil model, but requires a slide surface to correctly model discontinuous behavior of the two halves of the cylinder. As shown in figure 5, there are surfaces of the soil that start in contact with the soil, and at the end time of the analysis, are in contact with metal or air. Also, the interface between the two cylinder halves has become a noncontinuous surface (i.e., a slide surface). A continuum mechanics material model cannot accurately model this behavior; it may be modeled by a combination of tied/slide surfaces. |