U.S. Department of Transportation
Federal Highway Administration
1200 New Jersey Avenue, SE
Washington, DC 20590
202-366-4000
Federal Highway Administration Research and Technology
Coordinating, Developing, and Delivering Highway Transportation Innovations
 |
| This report is an archived publication and may contain dated technical, contact, and link information |
|
Publication Number: FHWA-RD-97-152
|
Guidelines for the Use of Raised Pavement Markers
SECTION 1. INTRODUCTION
The Manual on Uniform Traffic Control Devices (MUTCD, 1988) provides a general outline for how Raised Pavement Markers (RPMs) should be used, but more specific information is required in order to produce a set of guidelines that are usable by a field traffic engineer.(1) The Roadway Delineation Practices Handbook, produced by the Federal Highway Administration (FHWA) in 1994, gives more detailed instruction for some areas of RPM use (e.g., spacing and placement) but it is incomplete and is not presented in a clear, unambiguous manner.(2) In the next section of this report, some recommendations will be made on the basis of information provided by these two sources, along with information accumulated from a variety of other sources. Several areas require further research before recommendations can be made, and are also discussed in this section. Before moving on to recommendations, however, certain issues need to be clarified regarding research method and measurement of RPM performance so that experimental results can be more easily compared. After these issues are described, this introductory section will conclude with a discussion of driving performance and what is required to measure the proficiency of this performance, with specific reference to evaluating the use of RPMs as effective delineators. The Relationship Between Guidance Information And Gross Driving Performance Evidence That RPMs Improve Driver Performance
THE RELATIONSHIP BETWEEN GUIDANCE INFORMATION AND GROSS DRIVING PERFORMANCEThe task of driving can be performed using low–, medium– or high–level processing. If the guidance information is limited (as it is, for instance, when driving at night with rain or fog on a road with very poor delineation), the driver will use compensatory error tracking to maneuver the vehicle. According to Freedman, Staplin, Gilfillan, and Byrnes (1988), low–level maneuvering of a vehicle by error correction forces lower speeds, erratic movements and potentially unsafe driving. (3) When there is more guidance information available, the driver controls the vehicle by use of a steady pursuit mode. If guidance information is well supplied, the driver can anticipate upcoming events and use precognitive control to perform the required maneuvers. For the driver to have access to as much anticipatory information as possible, especially at night or with adverse weather conditions, long–range delineation is required. Long–range delineation is particularly useful to prepare the driver for upcoming changes in road geometry (e.g., approaching curves), road structure (e.g., gores, bifurcations, road narrowings), or required changes in driver speeds (e.g., at intersections, construction zones). Long–range delineation presents information to the driver when the perceptual process first begins. Shinar, McDowell and Rockwell (1977) demonstrated that the curve negotiation process perceptually begins well before the curve, at a preview distance of 2.5 to 3.5 s.(4) The Roadway Delineation Practices Handbook (1994) cites Freedman et al. as finding 2 and 3 s to be acceptable minimum preview distances for short and long ranges, respectively.(2,3) Allen et al. (1977) indicated that a 3– to 4–s preview distance is required in adverse weather conditions.(5) And Blaauw and Padmos (1982) use a more conservative 5–s preview distance to evaluate the performance of road delineation.(6) On the basis of these studies, short–range delineation should provide a minimum preview distance of 2 s, and long–range delineation should provide a minimum preview distance of 3–4 s. Curve delineation with RPMs has been the focus of much research. It is important to ensure that the driver has as much information as possible about the most important part of the curve in a timely fashion. The curve–assessment process was shown in studies by Cohen and Studach (1977), McLean and Hoffman (1973) (cited in Fildes and Triggs, 1985) (7), and Shinar et al. (4) to start well in advance of the vehicle entering the curve (at least 100 m (327.9 ft) before); far delineation is therefore essential to provide anticipatory information. But before we can measure whether RPMs provide adequate long–range information for curve navigation, it is important to know how drivers maneuver through curves under optimal conditions.
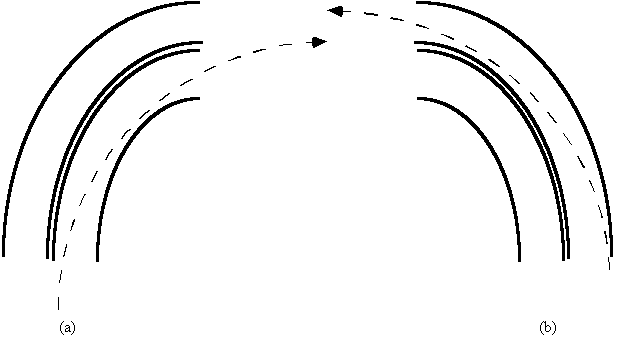
DRIVER NAVIGATION OF CURVESSeveral studies have investigated how drivers maneuver through curves. According to studies by Johnson (1984), Swenson (1985), and McLean (1983) (cited in Zador, Stein, Wright and Hall, 1987), (8) the actual path that drivers follow when traveling around a curve is not in the center of the lane. Many drivers tend to cut the sharpness of a corner by steering a straighter path around a curve; this is called curve lengthening. As shown in Figure 1a, for the right curve, the driver has shifted toward the centerline before entering the curve, and then shifts away from centerline as the vehicle travels through the curve. In contrast, Figure 1b shows that, for the left curve, the driver has shifted to the right edge before entering the curve, and then shifts toward the centerline as the vehicle travels through the curve. According to Zador et al., the benefit of the curve–lengthening strategy is that the driver can reduce the lateral acceleration through a curve and thereby reduce peak friction demand. However, the strategy may also bring vehicles closer to the roadway boundaries and reduce the driver's margin of safety.(8)
Figure 1. An example of the path taken by a vehicle when the corner–cutting strategy is used for maneuvering through (a) a right curve and (b) a left curve, on a two–lane, two–way road.
MEASURING DRIVER PERFORMANCEUsing Accident Analyses As discussed by Pagano (1972), the use of accident information (e.g., rates and types) to determine the effects of highway improvements on driver performance can be time–consuming and has varying reliability, depending on several variables (e.g., season, weather, location, time of day, etc.).(9) The interpretation and comparison of accident data also require controlling for variables such as geographical region (e.g., avoid comparing urban areas with rural areas, predominantly hilly vs. flat areas etc.), type of accident (e.g., single–vehicle road departure accidents, head–on collisions, sideswipe collisions, rear–end collisions, etc.), source of accident (e.g., weather, delineation, driver impairment, obstruction, driver drowsiness, etc.), type of RPM used, or traffic speeds. It is difficult to determine whether delineation improvements are effective if studies do not account for these and other variables. For example, Bali, Potts, Fee and Taylor (1978) showed that, when RPMs were used to delineate the centerline, there was a lower accident rate than when it was delineated with paint.(10) A before–and–after study by Matthias (1988) indicated that the installation of retroreflective RPMs on the centerline appeared to have contributed to the 56–percent reduction in nighttime accidents along the study section.(11) However, the accident data collected by Nemeth et al. (1986) indicated that the addition of RPMs may not make a difference under all circumstances, especially where snow and ice are a problem.(12) Using Performance Measures Because of the concerns mentioned in the subsection above, driving performance measures such as vehicle speed, lateral position, and lane encroachments have been used to correlate driver behavior and accident rates, enabling researchers to measure changes in driving performance without having to rely on accident records. However, even if driving measures are predominantly used to determine driver performance, accident data will still be required to validate the results. The methodology used to gather and interpret accident data should therefore be thorough and consistent. Pagano used performance measures to estimate the occurrence of different accident types.(9) For example, edgeline encroachments would be a factor in a model of single–vehicle road departure accidents, whereas encroachments of the centerline into the opposing lane would be a factor in a model of head–on collision or sideswipe accidents. Pagano collected data from nine sites (all of which were two–lane rural roads) to obtain some initial validation results, and according to his model the following correlation appeared to exist for horizontal curves: a strong correlation between accident rate and variance of lateral placement; some evidence that accident rates are correlated with deceleration rates; almost no correlation between accident rates and the variance in speed distributions; and negative correlation showing no support of the hypothesis that mean speed reductions will result in reduction in accident rates—in fact, it shows the reverse.(9) With these and other driving measures, researchers have studied the effect of the use of RPMs on driver performance. According to Zador et al., several sources agree that decreases in the variability of speed and/or variability in lateral position of a vehicle are major benefits of improved curve delineation.(8) The sources include: Nedas and Luminello (1982) and Stimpson, McGee, Kittelson and Ruddy (1977) (cited by Zador et al.)(8); and Taylor, McGee, Seguin, and Hostetter (1972)(13). Variability appears to be the key element in assessing the driver's ability to control the vehicle; erratic maneuvers give the indication that the driver is using low–level processing to control vehicle maneuvers.(8,13) In some cases the notion of "center–is–best" or "slower is better" is used to describe good driving behavior (e.g., Krammes and Tyer, 1991(14) and Kallberg, 1993(15)). This evaluation of driver performance is not based on controlled versus noncontrolled driving, but rather on mean speed or actual position in lane, and may overlook the benefits of improved delineation. It also ignores the possibility that curve lengthening is desirable. Deceleration rates rather than mean speeds appear to be useful, and lane position relative to lanelines are useful in conjunction with variability measures. Lateral position reveals whether the driver crosses the lane boundaries (center/edgelines) and therefore could potentially have an accident. One potential disadvantage of using the curve–lengthening strategy to maneuver through curves is that the vehicle is driven closer to roadway boundaries. For instance, a study by Stimpson, Kittelson, and Berg (1977) revealed that, in the case of an isolated horizontal curve between the point of curvature and curve midpoint, the driver tended to move closer to the shoulder for the inside curve and closer to the centerline for the outside curve.(16) The accident model used in this study indicated that, as the magnitude and frequency of the displacement of the vehicle increases, the potential for either departure accidents or head–on collisions also seems to increase. However, if studies show less or no change in boundary encroachments (into the edgeline and/or centerline), then the frequency of accidents should be reduced, since safer, more controlled driving is performed by the driver.
EVIDENCE THAT RPMs IMPROVE DRIVER PERFORMANCEOn the basis of the previous information, it is assumed that the preferred driver behavior would entail using anticipatory information to maneuver the vehicle in a well–controlled manner. Driving measures would then show low variability for speed, deceleration rates through curves that would reflect advance warning, and a mean speed that is no greater than that achieved during clear–day conditions. The measure would indicate that the lateral position does not encroach onto the shoulder or adjacent lanes and there would be low variability in lateral position. If RPMs provide adequate long–range information, this should be reflected in the driving performance measures (e.g., deceleration rate and lateral control when maneuvering horizontal curves). As the following studies show, RPMs do in fact provide long–range information that produces more controlled driving. Freedman et al. compared upgraded delineation (including RPMs with other far–delineation), which provided long–range information, with a baseline delineation scheme that provided short–range information.(3) Their results showed that the traffic speed tended to be more uniform (providing better traffic flow), that there was evidence of curve lengthening, and that drivers were less likely to use high beams and more likely to dim lights for opposing traffic with upgraded delineation. As was to be expected from curve lengthening, the frequency of near encroachments increased as the drivers hugged the centerline, but in spite of this, the frequency of centerline encroachments was significantly lower (by less than half).(3) It would be interesting to compare the results with a similar study using strictly RPMs as the upgraded delineator rather than RPMs in combination with other far–delineators. Earlier studies using RPMs show similar results. The experimental results of Allen et al. indicated that, when only striping was used for guidance, a dangerous combination of increasing lateral variability and decreasing mean distance from the lane–line occurred with many drivers over successive circuits on a highway. However, performance recovered when the driver returned to the road segment delineated with supplemental RPMs.(5) Zador et al. found that, when RPMs were used to delineate right curves (centerline with RPMs and painted edgelines), the drivers increased curve lengthening in day and night conditions.(8) When RPMs were used to delineate left curves (centerline with RPMs and painted edgelines), the drivers reduced curve lengthening at night, but increased curve lengthening in day conditions. Overall, Zador et al. concluded that there is strong evidence that supplemental delineation with RPMs effectively warns drivers of approaching curves.(8) It would be beneficial to have more information about how RPMs affect the number of boundary encroachments in curves in order to ensure that, by adding RPMs and increasing curve–lengthening behavior, the number of departure or side–swipe accidents does not also increase. For instance, Matthias found that, along with advantages of RPM retroreflective properties, the tactile and auditory warning provided by RPMs seemed to alert drivers to the crossing of the centerline during the day.(11) The before–and–after accident study found a reduction in the number of unsafe passing and road–departure accidents. Before the use of supplemental RPMs, eight accidents where a vehicle had inadvertently crossed the centerline occurred at night and seven accidents occurred during daylight hours, whereas only five accidents were reported at night and three accidents during the daylight hours in the after period.(11) As mentioned in the subsection referring to accident data, measuring the number of boundary encroachments both incursions over the edgeline and the centerline would give a more controlled estimate of how the use of RPMs might impact the potential of drivers to run off the road or encroach into the opposing lane. Although it is evident that studies show RPMs to be beneficial, the advantages of better delineation should also balance with the driver's capability to respond to emergency situations at night. The use of RPMs may allow the driver to safely control the vehicle at higher speeds, but RPMs cannot provide the same advance information about an impending collision with a road hazard (e.g., an animal or person crossing the road). As discussed by Kallberg, successful steering and braking maneuvers are strongly speed–dependent, and given that detection distances are shorter at night than during the day, the driver requires more time to react to an impending collision.(15) Therefore, if the driver travels faster because far–delineation (in this study, post–mounted delineation) provides sufficient driving cues, there is a potential danger for hazard collisions to increase. According to the accident model used by Kallberg, the number of injury accidents in darkness could potentially increase by 40 to 60 percent.(15) This study should be considered when determining where RPMs should be used (e.g., perhaps RPMs should not be used on deer–crossing sections of winding mountain roads that have low levels of ambient lighting).
ISSUES TO OBSERVEAlthough there are similarities in most studies investigating RPMs, there are enough differences to make it difficult to compare their research results. There are several approaches for accident analyses and for measuring driving performance. Required driver visibility distances used to evaluate RPM performance have not yet been established. It would also be very useful if common, consistent terminology was developed. These future research issues generated from the subsection above appear here within a box, as will other issues that are proposed throughout this document. The issues are numbered continuously and are compiled into a final list that is presented in section 4. Future Research: 1. Future accident analyses should consider how variables such as road geometry, average daily traffic (ADT), and geographical region will affect the interpretation of results. Previous studies that have averaged over such variables should be re–evaluated. 2. Measurement of driving performance, including analyses of potential accidents because of curve lengthening when RPMs are used, should be investigated further. 3. Studies should report the driving situation that was investigated in terms specific to those set by FHWA guidelines. For example, if spacing specifications are described on the basis of the degree of curvature for horizontal curves, studies should report the road geometry in terms of degree of curvature. The reflectivity of RPMs should be measured in SI units and reported with reference to the minimum reflectivity criteria (yet to be established). These criteria along with required visibility distance should be used to evaluate RPM performance.
FHWA-RD-97-152
|