U.S. Department of Transportation
Federal Highway Administration
1200 New Jersey Avenue, SE
Washington, DC 20590
202-366-4000


Skip to content
Facebook iconYouTube iconTwitter iconFlickr iconLinkedInInstagram

Federal Highway Administration Research and Technology
Coordinating, Developing, and Delivering Highway Transportation Innovations

Report
This report is an archived publication and may contain dated technical, contact, and link information
Publication Number: FHWA-HRT-10-068
Date:November 2010

Crosswalk Marking Field Visibility Study


CHAPTER 6. DATA ANALYSIS


OVERVIEW

CROSSWALK MARKINGS


OVERVIEW

During data collection in the vehicle, the rear-seat experimenter recorded when crosswalks were identified by the participant. During a second lap, the participant's appearance rating for each crosswalk was recorded. Following the driving portion of the study, the participant rank-ordered photographs of crosswalks to reflect his or her preferences.


Top


CROSSWALK MARKINGS

The prime objectives of this study were to determine the relative visibility of three crosswalk patterns through the use of detection distance and to identify the variables that affect this distance. The differences in detection distances were evaluated with consideration of variables grouped into the following classes:

  • Light (day or night).

  • Site characteristics (static conditions at the site, always the same for each participant).

  • Traffic characteristics (conditions at the site when the crosswalk was identified; conditions could be different for each participant and at each crosswalk).

  • Vehicle characteristics.

  • Driver characteristics.

Table 10 lists the variables that were originally considered. All variables were considered in the nighttime evaluations. The variable for retroreflectivity of pavement markings was not included in the daytime analysis. For some variables, using groups (categories) as well as continuous values was explored. For example, the eye height values were examined as a continuous value in some models and grouped into four ranges in others. Including a variable as a categorical variable after grouping, rather than as a continuous variable, can sometimes be advantageous in that the nonlinear relationship between the variable and detection distance can be detected (when the actual relationship is not linear).

Table 10. Original list of potential variables for analysis of crosswalk detection distance.

Class Variable

Light

Day or night

Site

Location of markings (study or new sites, existing intersections, and existing midblock)

Marking type

  • Study sites (No. of sites): transverse (3), continental (3), bar pairs (3).

  • Existing sites (No. of sites): midblock transverse (1), midblock continental (1), all–way stop transverse (4 or 5 depending on route), all–way stop continental (1), signal (1).

Cross section of roadway (two lanes with TWLTL, four lanes undivided, two lanes with bike lanes)

Width of roadway (40, 42, or 50 ft)

Posted speed limit (30 or 45 mi/h)

Retroreflectivity of markings (only used for nighttime evaluations)

Traffic conditions

Presence of traffic conditions that may have affected visibility, for example, distance to lead vehicle, opposing traffic, etc. (yes or no)

Driver speed (mi/h)

Number of pedestrians

  • moving toward crossing on left side of roadway.

  • moving away from crossing on left side of roadway.

  • in crosswalk.

  • in roadway between driver and crosswalk.

  • moving toward crossing on right side of roadway.

  • moving away from crossing on right side of roadway.

Vehicle

Vehicle driven (SUV or sedan)

Driver

Eye height (inches)

Gender (male or female)

Age group (younger than 55 years old or 55 years old and older)

The presence of a pedestrian or bicycle in the participant's view was found to be not significant in several preliminary models. The researchers expect this is more of a reflection of the low number of events with the pedestrian/bicycle variable rather than the presence of pedestrians or bicyclists not having an influence. Less than 4 percent of all events for both study sites and existing sites included a pedestrian or bicycle. For study sites, less than 1 percent of the detection distances occurred when a pedestrian was in the participant's field of view. Therefore, this variable was removed from the study site evaluations.

Original investigations tried to uniquely use the variables listed in table 10 . The limited range in some of the values (maximum crossing width difference of only 10 ft between sites) and the overlap between values (e.g., the 45 mi/h sites always had no sidewalks) created concerns about the modeling process. Therefore, a new variable–street group–was developed. The street group variable accounted for the following roadway characteristics:

  • Posted speed limit (45 or 30 mi/h).

  • Roadway cross–section width (40 ft, 42 ft, or 40–50 ft).

  • Presence of sidewalks (no sidewalks, sidewalks on only one side, or sidewalks on both sides).

  • Number of lanes (two lanes with TWLTL, wide two lanes with bike lanes, or four lanes undivided).

  • General characteristics (rural in feel, urban in feel, or mixed feel).

Table 11 shows the characteristics for each street group. The vehicle type overlapped with the driver eye height groups, so those variables were combined in the models that included driver eye heights in groups. Table 12 lists the revised list of potential variables.

Table 11. Street group characteristics.

Street Group Posted Speed Limit (mi/h) Roadway Cross-Section Width (ft) Presence of Sidewalk Number of Lanes Feel
Street Group 1 45 40 None Two lanes + TWLTL Rural
Street Group 2 30 40–50 One side Wide two lanes with bike lanes or 4 lanes undivided Mixed
Street Group 3 30 42 Both sides Two lanes + TWLTL Urban
Street Group 4 30 70–92 Both sides Four lanes Urban
Street Group 5 40 75 Both sides Six lanes Urban


Table 12. Revised list of potential variables for analysis of crosswalk detection distance.

Class Variable Name Description
Light Separate analysis was conducted for daytime and nighttime data
Site Marking type Mark_Type Type of marking (transverse, continental, bar pairs)
Location Loc

Location

  • Study: study sites with new marking.

  • Ei: existing markings at intersections.

  • Em: existing markings at midblock.

Analyses were conducted separately for the markings located at study sites and the existing markings located at intersections (Ei) or midblock (Em).

Street group Street Group Streets assigned to five groups using the following characteristics: posted speed limit, cross section width, sidewalk presence, rural or urban feel. See table 11.
Retro-reflectivity values or groups Retro Values Retroreflectivity of markings (only used for nighttime evaluations)
Retro Groups Retroreflectivity (only used for nighttime evaluations) grouped initially into the following:
  • Low: less than 200 mcd/m2/lx.

  • S-300: retroreflectivity readings of 309 or 331.

  • S-500: retroreflectivity readings of 524 or 570.

  • New: retroreflectivity readings greater than 600.

Later grouped into the following for the existing site evaluation because all S-300 were at midblock and all S-500 were at intersections:

  • Low: less than 200 mcd/m2/lx.

  • Service: retroreflectivity readings above 200 mcd/m2/lx.

Traffic conditions Traffic presence Traf_Pres Presence of traffic that may have affected visibility (yes or no)
Driver speed Driver_Sp Speed (mi/h) when participant said “crosswalk”
Pedestrian or bicycle presence Ped/
Bike_Pres
Number of pedestrians or bicyclist in driver’s view
Vehicle Vehicle type Vehicle Vehicle being driven (SUV or Sedan)
Driver Eye height Eye_Height Driver’s eye height (continuous) (42.0–47.0 inches for sedan drivers and 50.0–55.5 inches for SUV drivers)
Gender Gender Gender (male or female)
Age group Age_Group Age group (< 55 years old or ≥ 55 years old)

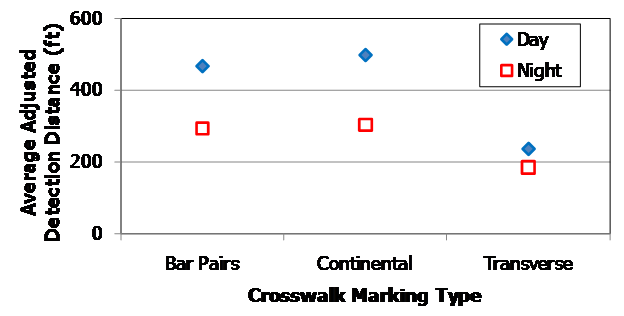
While the preference was to identify if retroreflectivity affects detection distance, the existing sites available for this study did not permit such an evaluation. Most existing sites had retroreflectivity readings less than 38 mcd/m2/lx. Those existing sites with higher retroreflectivity values had continental markings located at intersections or had transverse markings located at midblock crossings, which created confounding issues. Both continuous readings and groups of similar readings were explored. However, the retroreflectivity variable had to be dropped in the evaluations of the existing sites. An evaluation of retroreflectivity was not considered for the study sites because similar marking material was used at all the study sites to ensure that retroreflectivity would not be a factor. The focus of this study was on different marking patterns. The evaluation of retroreflectivity would have been a side benefit that, unfortunately, was not possible.

Figure 42 shows the average detection distance for each crosswalk subdivided by daytime and nighttime conditions, and figure 43 shows the data grouped by location type. As expected, the average adjusted detection distance was always longer during the day than at night. For several locations, such as transverse markings at an intersection, the detection distance was similar in both the daytime and the nighttime, with some being different by only a few feet. Initial statistical evaluations support the observation that effects of several variables on detection distances are different in the daytime as compared to the nighttime. Therefore, the evaluations were subdivided into daytime and nighttime conditions. Initial evaluations also revealed the need to evaluate the study sites separately from the markings at existing locations.

Of particular interest is the detection distance to the markings installed for this study. Figure 44 shows the average detection distance for the three test markings: transverse, continental, and bar pairs. Again, there was a difference between the average adjusted detection distance for daytime and nighttime conditions, with a minimal difference for the transverse marking sites.

The analyses of the adjusted detection distance data were conducted using Analysis of Covariance (ANACOVA) mixed models treating the variables in table 12 as fixed factors/covariates and drivers and crosswalks as random factors. Models were estimated by the restricted maximum likelihood method implemented in the JMP® statistical package (a SAS® product). Several models were explored to determine the best models to describe the variables that influence detection distance. In addition to the main effects, models with two–way interactions were examined. The analysis began with a model that included all main effects variables and logical two–way interaction variables called the "extended" model. Several of the interactions were not significant and were dropped from the models when the p–value was less than 0.05. This revised model was called the "reduced" model.


This graph shows each crosswalk in the order of appearance on the y-axis and the average adjusted detection distance for each crosswalk on the x-axis. The x-axis scale is from 0 to 700 ft. The y-axis shows 19 crosswalks for the clockwise route as well as 19 crosswalks for the counterclockwise route. The average adjusted distance for daytime and nighttime is shown separately for each crosswalk, with the daytime distance marked as a solid blue bar and the nighttime distance a hollow red bar. In all instances, the daytime distance is longer than the nighttime distance.
S = Crosswalk at study site.
Ei = Crosswalk at existing intersection.
Em = Crosswalk at existing midblock site.
* = Site with short available viewing distance or with a dip in road prior to intersection.

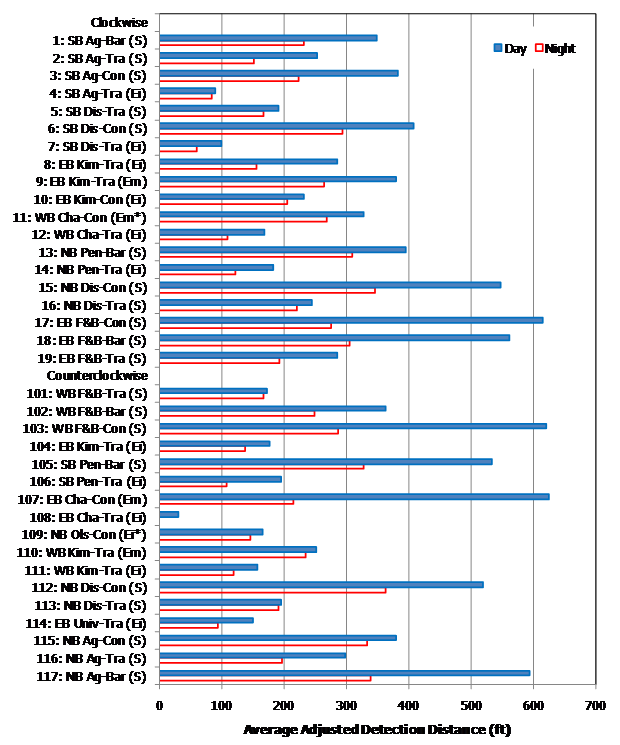
Figure 42. Graph. Average adjusted detection distance at each crosswalk in order of appearance.


This graph shows crosswalk sites grouped by location type on the y-axis and average adjusted detection distance for each crosswalk on the x-axis. The x-axis scale is from 0 to 700 ft. There are 20 study site crosswalks, 4 existing midblock crosswalks, and 12 intersection crosswalks. The average adjusted distance for daytime and nighttime is shown separately for each crosswalk, with the daytime distance marked as a solid blue bar and the nighttime distance a hollow red bar. In all instances, the daytime distance is longer than the nighttime distance.
S = Crosswalk at study site.
Ei = Crosswalk at existing intersection.
Em = Crosswalk at existing midblock site.
* = Site with short available viewing distance or with a dip in road prior to intersection.

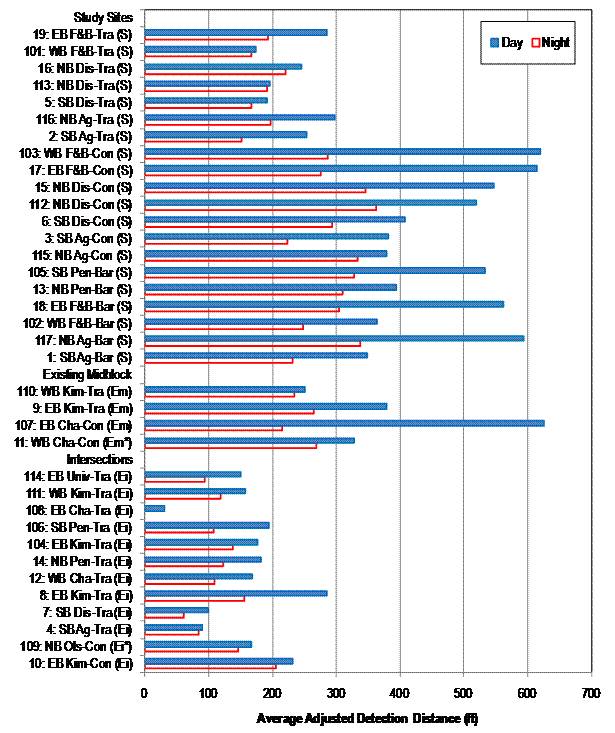
Figure 43. Graph. Average adjusted detection distance at each crosswalk grouped by location type.


This graph shows the average adjusted detection distance on a scale from 0 to 600 ft on the y-axis and the crosswalk type on the x-axis. The x-axis shows bar pairs, continental, and transverse. Average adjusted detection distance is shown for day and night conditions, with daytime data points represented by blue diamonds and nighttime data points represented by hollow red squares. The daytime points are  higher than the nighttime points for bar pairs and continental, while the points for transverse are very close together.

Figure 44. Graph. Average adjusted detection distance for crosswalk markings at study sites.

Daytime Detection–Study Sites

Evaluations began with examining which variables affected daytime detection distance at the nine sites where the markings were installed for this study. Data for both approaches were included for a total of 18 crosswalks. Table 13 lists the results for the model that includes all potential main effect variables along with two–way interactions (the analysis output for random effects is suppressed and not shown in the table for space). The variables that were statistically significant at the 0.05 level include the following:

  • Marking type.

  • Street group.

  • Interaction of marking type and traffic presence.

  • Interaction of driver speed and street group.

While there were several significant variables, the model also contained several variables that were not significant. The next step in model development was to remove insignificant two–way interaction variables until an acceptable model was reached. As variables were eliminated or other variables tried, the significant variables changed. The reduced model that the researchers think provides good information on which two–way interaction variables influence the adjusted daytime detection distance at the study sites is shown in table 14.

Table 13. ANACOVA findings for daytime adjusted detection distance for extended model (includes potential variables and two-way interactions) for study sites.

Response Adjusted Detection Distance

Summary of Fit

RSquare 0.785541
RSquare Adj 0.745412
Root Mean Square Error 103.78
Mean of Response 400.7076
Observations (or Sum Wgts) 388

Fixed Effect Tests

Source Nparm DF DFDen F Ratio Prob > F
Age_Group 1 1 36.51 0.0921 0.7633
Driver_Sp 1 1 317.4 0.0522 0.8195
Eye_Height[Vehicle] 2 2 98.51 2.8941 0.0601
Gender 1 1 31 0.2336 0.6323
Mark_Type 2 2 76.15 3.9613 0.0231*
Street Group 2 2 145.5 3.2332 0.0423*
Traf_Pres 1 1 305.5 3.3649 0.0676
Vehicle 1 1 102 2.6035 0.1097
Age_Group*Gender 1 1 27.24 0.0101 0.9208
Age_Group*Street Group 2 2 300.3 2.0055 0.1364
Age_Group*Vehicle 1 1 27.87 0.1398 0.7113
Driver_Sp*Age_Group 1 1 310.8 0.1653 0.6846
Driver_Sp*Gender 1 1 311.7 0.0014 0.9700
Driver_Sp*Street Group 2 2 305.2 8.3582 0.0003*
Driver_Sp*Traf_Pres 1 1 301.1 0.8945 0.3450
Driver_Sp*Vehicle 1 1 309.1 0.4684 0.4943
Eye_Height*Age_Group[Vehicle] 2 2 28.23 0.0698 0.9327
Eye_HeightDriver_Sp[Vehicle] 2 2 310.8 0.4202 0.6573
Eye_HeightGender[Vehicle] 2 2 27.98 0.1313 0.8775
Eye_HeightMark_Type[Vehicle] 4 4 292.6 1.9733 0.0986
Eye_HeightStreet Group[Vehicle] 4 4 301.3 0.9380 0.4422
Eye_Height*Traf_Pres[Vehicle] 2 2 305.3 2.4345 0.0893
Gender*Street Group 2 2 304 1.3179 0.2692
Gender*Vehicle 1 1 28.18 0.1237 0.7277
Mark_Type*Age_Group 2 2 289.3 0.9164 0.4011
Mark_Type*Driver_Sp 2 2 295.9 1.1047 0.3327
Mark_Type*Gender 2 2 291.8 2.7458 0.0659
Mark_Type*Street Group 4 4 14.31 1.6267 0.2215
Mark_Type*Traf_Pres 2 2 292.4 4.0622 0.0182*
Mark_Type*Vehicle 2 2 291.2 2.4786 0.0856
Traf_Pres*Age_Group 1 1 303.8 1.2749 0.2597
Traf_Pres*Gender 1 1 307.8 0.1585 0.6908
Traf_Pres*Street Group 2 2 304.9 1.4474 0.2368
Traf_Pres*Vehicle 1 1 304.8 0.1713 0.6793
Vehicle*Street Group 2 2 299.2 1.5668 0.2104
Note: Abbreviation list provided in front section of report. The horizontal rule separates the main effect variables from the two–way interactions. Asterisks (*) in the Prob > F column represent effects that are statistically significant at the 0.05 level.


Table 14. ANACOVA findings for daytime adjusted detection distance for reduced model for study sites.

Response Adjusted Detection Distance

Summary of Fit

RSquare 0.751547
RSquare Adj 0.740131
Root Mean Square Error 105.557
Mean of Response 400.7076
Observations (or Sum Wgts) 388

Parameter Estimates

Term Estimate Std Error DFDen t Ratio Prob > |t|
Intercept 502.61731 79.79161 163.9 6.30 < 0.0001*
Mark_Type[BAR] 35.693741 30.40154 20.14 1.17 0.2541
Mark_Type[CON] 61.548665 29.77275 21.91 2.07 0.0507
Driver_Sp -3.270855 1.890211 369.6 -1.73 0.0844
Traf_Pres[NO] 13.584216 11.70817 347.8 1.16 0.2467
Age_Group[<55] 4.876435 12.78203 34.35 0.38 0.7052
Gender[FEMALE] 27.593795 14.39381 34.51 1.92 0.0635
Vehicle[SEDAN] 70.859695 50.0485 34.54 1.42 0.1658
Street Group[Group 1] 65.32718 35.84712 37.59 1.82 0.0764
Street Group[Group 2] -62.13144 29.60266 23.15 -2.10 0.0469*
Vehicle[SEDAN]:(Eye_Height-48.6611) 21.086442 17.13312 35.44 1.23 0.2265
Vehicle[SUV]:(Eye_Height-48.6611) 12.079989 13.44581 34.89 0.90 0.3751
Mark_Type[BAR]*Traf_Pres[NO] 17.828553 14.23658 334.3 1.25 0.2113
Mark_Type[CON]*Traf_Pres[NO] 33.633254 15.01947 331.2 2.24 0.0258*
(Driver_Sp-31.3311)*Street Group[Group 1] 0.3886957 2.441723 350.7 0.16 0.8736
(Driver_Sp-31.3311)*Street Group[Group 2] -8.125032 2.113117 351.9 -3.85 0.0001*
Gender[FEMALE]*Street Group[Group 1] 25.475109 7.957429 322.6 3.20 0.0015*
Gender[FEMALE]*Street Group[Group 2] -15.1095 7.407964 323.7 -2.04 0.0422*

Fixed Effect Tests

Source Nparm DF DFDen F Ratio Prob > F
Age_Group 1 1 34.35 0.1455 0.7052
Driver_Sp 1 1 369.6 2.9943 0.0844
Eye_Height[Vehicle] 2 2 35.19 1.1164 0.3388
Gender 1 1 34.51 3.6751 0.0635
Mark_Type 2 2 21.35 5.4494 0.0122*
Street Group 2 2 24.93 2.5070 0.1018
Traf_Pres 1 1 347.8 1.3461 0.2467
Vehicle 1 1 34.54 2.0045 0.1658
Driver_Sp*Street Group 2 2 351.2 8.5846 0.0002*
Gender*Street Group 2 2 323.5 5.3384 0.0052*
Mark_Type*Traf_Pres 2 2 333.8 5.9120 0.0030*
Note: Abbreviation list provided in front section of report. The horizontal rule separates the main effect variables from the two–way interactions. Asterisks (*) in the Prob > F and Prob > |t| columns represent effects that are statistically significant at the 0.05 level.

The two–way interaction variables that influenced daytime detection distance are as follows:

  • Driver speed and street group.

  • Gender and street group.

  • Marking type and presence of traffic.

None of the main effect driver variables, which included driver eye height, gender, and age group, were significant at the 0.05 level. While gender was not surprising, a difference due to age group was expected. The selection of participants was designed to ensure adequate representation of the 55 years old and older group by having half of the participants in that age group. Figure 45 shows the average adjusted detection distance subdivided by age group and light. The graph supports the finding that age group was not a significant variable for this particular study. In each marking type and light combination, the average adjusted detection distance was similar for younger and older participants.

This graph shows the average adjusted detection distance on a scale from 0 to 600 ft on the y-axis and crosswalk marking type on the x-axis. The x-axis shows bar pairs, continental, and transverse. Average adjusted detection distance is shown for day and night and younger and older driver conditions. Solid blue diamonds represent day, younger drivers, and hollow blue diamonds represent night, younger drivers. Solid red squares represent day, older drivers, and hollow red squares represent night, older drivers. The points for younger and older day drivers, which are very close together, are higher than the points for the younger and older night drivers for bar pairs and continental. All four data points are very close together for transverse.

Figure 45. Graph. Average adjusted detection distance by age group and light at study sites.


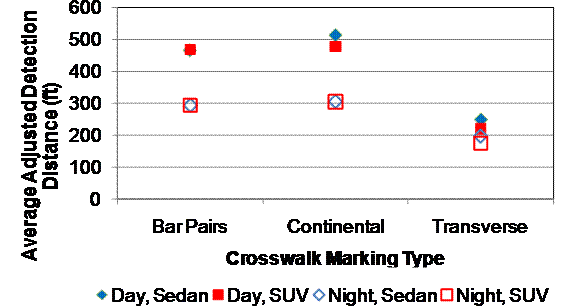
Vehicle type and driver eye height were also not significant for the daytime condition. Figure 46 shows the average adjusted detection distance subdivided by light and vehicle type. For bar pairs, there were no differences between sedan and SUV in the average values. A small difference occurred in daytime for continental markings. Transverse markings had the most variation in detection distance by vehicle type.

This graph shows the average adjusted detection distance on a scale from 0 to 600 ft on the y-axis and crosswalk marking type on the x-axis. The x-axis shows bar pairs, continental, and transverse. Average adjusted detection distance is shown for day and night and sedan and SUV driver conditions. Solid blue diamonds represent day, sedan drivers, and hollow blue diamonds represent night, sedan drivers. Solid red squares represent day, SUV drivers, and hollow red squares represent night, SUV drivers. The points for SUV and sedan day drivers, which are very close together, are higher than the points for the SUV and sedan night drivers for bar pairs and continental. All four data points are very close together for transverse.

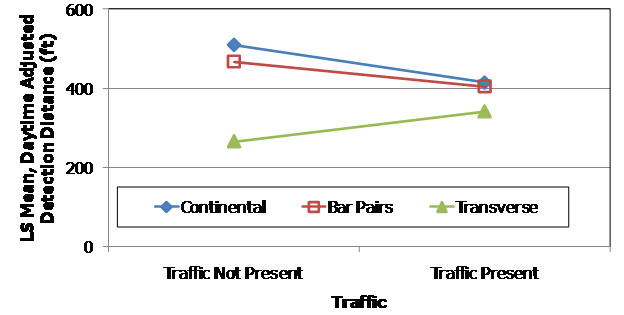
Figure 46. Graph. Average adjusted detection distance by vehicle type and light at study sites.

Marking Type and Traffic Presence Interaction

A significant interaction between marking type and traffic presence was identified for the daytime adjusted detection distances. This significant interaction indicates that the effect of one factor (e.g., marking type) may be different for each level of the other factor (e.g., traffic presence) and may need to be assessed conditionally on each level of the other factor. Table 15 provides the results for the least square means table and the Tukey test.


Table 15. Effect details of traffic presence and marking type interaction on daytime detection distance at study sites.

Mark_Type*Traf_Pres

Least Squares Means Table

Level Least Sq Mean   Std Error
BAR, NO 467.24424   60.124129
BAR, YES 404.41870   68.013657
CON, NO 508.90386   58.490411
CON, YES 414.46893   70.472726
TRA, NO 265.01773   58.071455
TRA, YES 340.77291   69.539467

LSMeans Differences Tukey HSD

α=0.050

Level     Least Sq Mean
CON, NO A   508.90386
BAR, NO A   467.24424
CON, YES A B 414.46893
BAR, YES A B 404.41870
TRA, YES A B 340.77291
TRA, NO   B 265.01773
Note: Abbreviation list provided in front section of report. Levels not connected by the same letter are significantly different.

The interaction plot indicating the effect of marking type on detection distance conditional on the levels of traffic present is shown in figure 47. It can be observed that the least square mean detection distances for bar pairs and continental are longer than that for transverse markings, and the difference is larger when traffic is not present compared to when traffic is present. The Tukey's test (see table 15 ) shows that when traffic is not present, the detection distances for continental and bar pairs are similar (508 and 467 ft, respectively) but significantly different from transverse markings (265 ft), whereas there is no significant difference among the three marking types when traffic is present.

This graph shows the least square mean for daytime adjusted detection distance on a scale from 0 to 600 ft on the y-axis. Traffic is shown on the x axis, with categories of traffic not present and traffic present. Three lines represent continental, bar pairs, and transverse crosswalks. The lines for continental and bar pairs start near 500 ft for traffic not present and slope down to about 400 ft for traffic present. The line for transverse starts near 250 ft for traffic not present and slopes up to about 350 ft for traffic present.

Figure 47. Graph. Least square mean daytime adjusted detection distance by marking type and traffic presence at study sites.


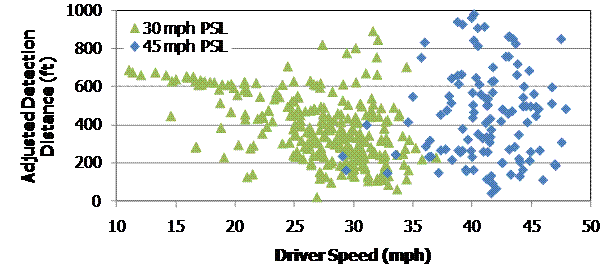
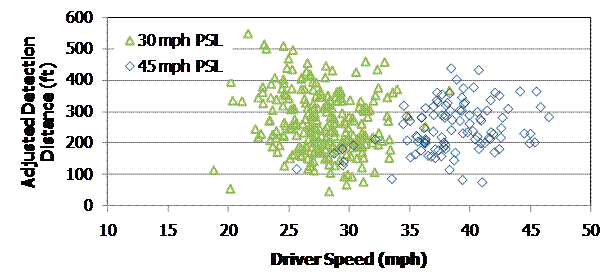
Driver Speed and Street Group Interaction

The driver speed and street group interaction was statistically significant for daytime detection distance. As an initial examination, plots of adjusted detection distance and driver speed by light level and posted speed limit were generated. Figure 48 shows the plot for daytime, and figure 49 shows the plot for nighttime. As can be seen in figure 48 , the driver speeds on the 45-mi/h road were higher than the driver speeds at the 30-mi/h sites. Another pattern revealed is that around adjusted detection distances of 600 to 700 ft, several drivers were at speeds less than 20 mi/h. A closer investigation of those data points revealed that those drivers were still accelerating after completing a turn.

This graph shows adjusted detection distance on a scale from 0 to 1,000 ft on the y-axis and driver speed on a scale of 10 to 50 mi/h on the x-axis. Individual data points for the 30 mi/h posted speed limit are represented by green triangles and range from just above 0 to about 900 ft adjusted detection distances. Individual data points for the 45 mi/h posted speed limit are represented by blue diamonds and range from slightly above 0 to almost 1,000 ft adjusted detection distances. In relation to the x-axis, the data points cluster around the posted speed limits.

Figure 48. Graph. Adjusted detection distance by driver speed, posted speed limit, and daytime at study sites.


This graph shows adjusted detection distance on a scale from 0 to 600 ft on the y-axis and driver speed on a scale of 10 to 50 mi/h on the x-axis. Individual data points for the 30 mi/h posted speed limit are represented by green triangles and range from about 50 to about 550 ft adjusted detection distances. Individual data points for the 45 mi/h posted speed limit are represented by blue diamonds and range from about 90 to about 450 ft adjusted detection distances. In relation to the x-axis, the data points cluster slightly below the posted speed limits.

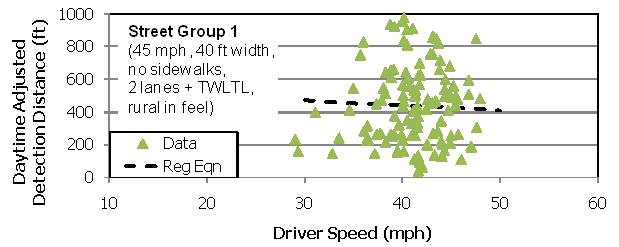
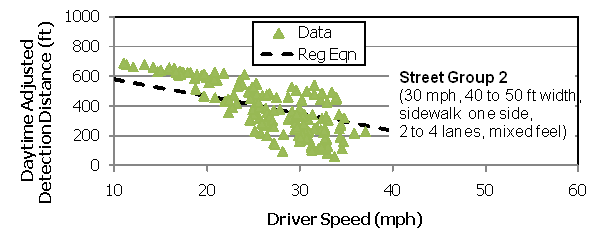
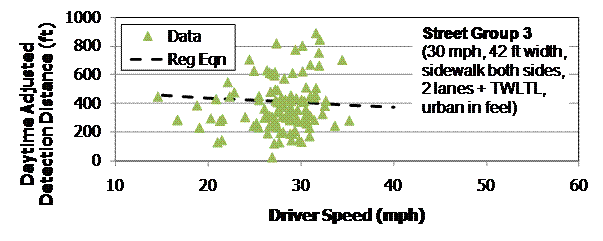
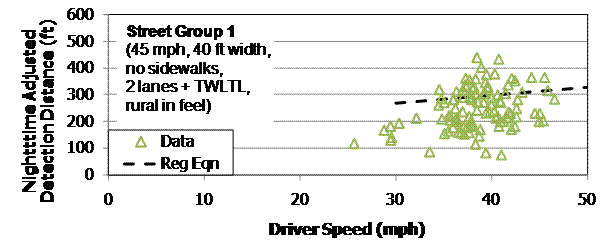
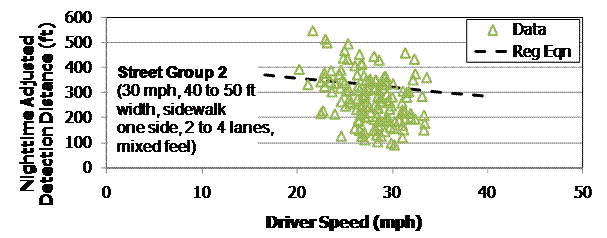
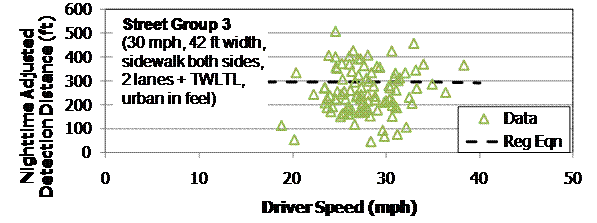
Figure 49. Graph. Adjusted detection distance by driver speed, posted speed limit, and nighttime at study sites.

Because the model indicated that the driver speed and street group interaction was significant, plots were generated of adjusted detection distance by driver speed for each of the street groups. Figure 50 shows the relationship between driver speed and detection distance for street group 1. Street group 2 is shown in figure 51 , and street group 3 is shown in figure 52 . The figures also show a plot of the regression equation line that would be generated using the coefficients from the reduced model. The following conditions were assumed when generating the plots of regression lines:

  • Transverse pavement markings.

  • Traffic present.

  • SUV.

  • 48.66–inch eye height.

  • Older age group.

  • Male drivers.

The plots for street group 2 show the relationship between low speed and long detection distances; although, closer evaluation of the data revealed that the observation should be that when drivers are at low speed because of turning or accelerating after a turn, they detect crosswalks at a longer distance. A visual review of these graphs shows that higher speeds are associated with shorter detection distances (for street group 3, only slightly shorter detection distances).

This graph shows adjusted detection distance on a scale from 0 to 1,000 ft on the y axis and driver speed on a scale of 10 to 60 mi/h on the x-axis. Individual data points are shown for street group 1 (45 mi/h, 40 ft width, no crosswalks, two lanes plus two-way left-turn lane, rural in feel). The data points extend from just below 30 mi/h to just below 50 mi/h and from just above 0 ft to almost 1,000 ft in daytime adjusted detection distances. There is also a black dashed regression line, which runs from 30 to 50 mi/h, starting at just below 500 ft and sloping down to about 400 ft.

Figure 50. Graph. Daytime adjusted detection distance by driver speed for street group 1 at study sites.


This graph shows adjusted detection distance on a scale from 0 to 1,000 ft on the y axis and driver speed on a scale of 10 to 60 mi/h on the x-axis. Individual data points are shown for street group 2 (30 mi/h, 40 to 50 ft width, crosswalk one side, two to four lanes, mixed feel). The data points extend from just above 10 mi/h to just below 40 mi/h and from just above 0 ft to about 700 ft in daytime adjusted detection distances. There is also a black dashed regression line, which runs from 0 to 40 mi/h, starting just below 600 ft and sloping down to just above 200 ft.

Figure 51. Graph. Daytime adjusted detection distance by driver speed for street group 2 at study sites.


This graph shows adjusted detection distance on a scale from 0 to 1000 ft on the y axis and driver speed on a scale of 10 to 60 mi/h on the x-axis. Individual data points are shown for street group 3 (30 mi/h, 42 ft width, crosswalk both sides, 2 lanes plus two-way left-turn lane, urban in feel). The data points extend from about 15 mi/h to about 35 mi/h and from just above 0 to about 700 ft in daytime adjusted detection distances. There is also a black, dashed regression line, which runs from 15 to 40 mi/h, starting at just below 500 ft and sloping down to just below 400 ft.

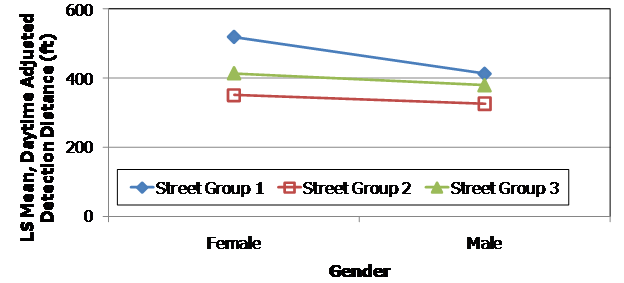
Figure 52. Graph. Daytime adjusted detection distance by driver speed for street group 3 at study sites.

Gender and Street Group Interaction

The interaction between street group and gender was statistically significant in the reduced model (see table 14 ). The interaction plot indicating the effect of street group on detection distance conditional on gender is shown in figure 53 . The least square mean detection distance for street group 1 is longer for female than for male while differences between female and male for the other street group levels is minimal. The least square means along with two difference tests (Tukey HSD and Student's t) are provided in table 16 , which supports the above observation. There is no reason to believe that women have better eyesight than men (especially for only one street group and not other street groups), and the researchers attribute the gender difference to attention differences or response bias in that women were more willing to "guess" early to identify the marking.

This graph shows the least square mean for daytime adjusted detection distance on the y axis and gender on the x-axis. Three lines represent street group 1, street group 2, and street group 3. The street group 1 line starts above 500 ft for female and slopes down to just above 400 ft for male. The street group 2 line starts at about 350 ft for female and slopes very slightly down to above 300 ft for male. The street group 3 line starts just above 400 ft for female and slopes down to just below 400 ft for male.

Figure 53. Graph. Least square mean daytime adjusted detection distance by gender and street group at study sites.


Table 16. Effect details of street group and gender interaction variable on daytime detection distance at study sites.

Least Squares Means Table

Level Least Sq Mean Std Error
Group 1, FEMALE 518.53381 71.339583
Group 1, MALE 412.39601 67.803389
Group 2, FEMALE 350.49059 63.193574
Group 2, MALE 325.52200 58.453838
Group 3, FEMALE 414.17017 65.700710
Group 3, MALE 379.71380 61.347242

LSMeans Differences, Tukey HSD

α=0.050

Level     Least Sq Mean
Group 1, FEMALE A   518.53381
Group 3, FEMALE A B 414.17017
Group 1, MALE   B 412.39601
Group 3, MALE A B 379.71380
Group 2, FEMALE A B 350.49059
Group 2, MALE   B 325.52200

LSMeans Differences, Student's t

α=0.050

Level     Least Sq Mean
Group 1, FEMALE A   518.53381
Group 3, FEMALE A B 414.17017
Group 1, MALE   B 412.39601
Group 3, MALE   B 379.71380
Group 2, FEMALE   B 350.49059
Group 2, MALE   B 325.52200
Note: Abbreviation list provided in front section of report. Levels not connected by the same letter are significantly different.


Top


Nighttime Detection–Study Sites

This section presents the findings on nighttime detection at the study sites. Table 17 shows the results when potential main effect variables and two–way interactions are included in the model for nighttime detection (i.e., extended model). Table 18 shows the effect details. Most of the variables were not significant; only the following variables had a p–value less than 0.05:

  • Interaction of vehicle and street group.

  • Interaction of eye height and street group.

  • Marking type.

Table 17. ANACOVA Findings for nighttime adjusted detection distance for extended model (includes potential variables and two-way interactions) for study sites.

Response Adjusted Detection Distance

Summary of Fit

RSquare 0.726408
RSquare Adj 0.677254
Root Mean Square Error 54.73319
Mean of Response 261.4497
Observations (or Sum Wgts) 349

Fixed Effect Tests

Source Nparm DF DFDen F Ratio Prob > F
Age_Group 1 1 65.78 0.0323 0.8580
Driver_Sp 1 1 281.8 0.3457 0.5570
Eye_Height[Vehicle] 2 2 23.57 0.4550 0.6399
Gender 1 1 26.11 0.0408 0.8415
Mark_Type 2 2 41.76 8.0342 0.0011*
Street Group 2 2 83.62 1.0485 0.3550
Traf_Pres 1 1 272.5 0.1405 0.7081
Vehicle 1 1 23.18 0.2385 0.6298
Age_Group*Gender 1 1 24 0.0001 0.9921
Age_Group*Street Group 2 2 275.8 0.6185 0.5395
Age_Group*Vehicle 1 1 23.12 0.0441 0.8355
Driver_Sp*Age_Group 1 1 286.1 0.0003 0.9872
Driver_Sp*Gender 1 1 281.7 2.4676 0.1173
Driver_Sp*Street Group 2 2 278.4 2.9832 0.0522
Driver_Sp*Traf_Pres 1 1 264.5 0.0509 0.8216
Driver_Sp*Vehicle 1 1 285.2 0.0138 0.9066
Eye_Height[Vehicle]*Age_Group[Vehicle] 2 2 24.2 0.0633 0.9389
Eye_Height[Vehicle]*Driver_Sp[Vehicle] 2 2 285 0.3753 0.6874
Eye_Height[Vehicle]*Gender[Vehicle] 2 2 24.4 0.2007 0.8195
Eye_Height[Vehicle]*Mark_Type[Vehicle] 4 4 268.8 0.5281 0.7152
Eye_Height[Vehicle]*Street Group[Vehicle] 4 4 277 2.7455 0.0288*
Gender*Street Group 2 2 270.5 2.9509 0.0540
Gender*Vehicle 1 1 22.89 0.2524 0.6202
Mark_Type*Age_Group 2 2 263.9 0.7341 0.4809
Mark_Type*Driver_Sp 2 2 269.2 0.9436 0.3905
Mark_Type*Gender 2 2 263.5 0.0725 0.9301
Mark_Type*Street Group 4 4 12.49 0.6039 0.6670
Mark_Type*Vehicle 2 2 267.1 0.5994 0.5499
Traf_Pres*Age_Group 1 1 271 0.5789 0.4474
Vehicle*Street Group 2 2 277.1 3.5033 0.0314*

Note: Abbreviation list provided in front section of report. The horizontal rule separates the main effect variables from the two–way interactions. Asterisks (*) in the Prob > F column represent effects that are statistically significant at the 0.05 level.


Table 18. Effect details for variables in table 17.

Mark_Type

Least Squares Means Table

Level Least Sq Mean Std Error
BAR 314.94222 45.047031
CON 339.39226 44.181831
TRA 209.62588 46.026183

LSMeans Differences Tukey HSD

α=0.050

Level     Least Sq Mean
CON A   339.39226
BAR A   314.94222
TRA   B 209.62588

Vehicle*Street Group

Least Squares Means Table

Level Least Sq Mean   Std Error
SEDAN, Group 1 291.38321   78.116675
SEDAN, Group 2 298.62097   68.575350
SEDAN, Group 3 324.20488   68.539445
SUV, Group 1 235.88453   67.749519
SUV, Group 2 345.19379   50.663010
SUV, Group 3 232.63335   55.367679

LSMeans Differences Tukey HSD

α=0.050

Level   Least Sq Mean
SUV, Group 2 A 345.19379
SEDAN, Group 3 A 324.20488
SEDAN, Group 2 A 298.62097
SEDAN, Group 1 A 291.38321
SUV, Group 1 A 235.88453
SUV, Group 3 A 232.63335
Note: Abbreviation list provided in front section of report. Levels not connected by the same letter are significantly different.

Several additional combinations of main effects and two–way interactions were explored in the modeling efforts. Again, the elimination of non–significant variables changed the p–value of other variables, resulting in some variables becoming significant. Removing non–significant two–way interaction variables for the nighttime detection data resulted in the eye height and street group interaction term becoming not significant. In addition, some two–way interaction variables that were not significant became significant (e.g., driver speed and gender as well as driver speed and street group). Table 19 shows the resulting model, and table 20 shows the effect details.

Table 19. ANACOVA findings for nighttime adjusted detection distance for reduced model for study sites.

Response Adjusted Detection Distance

Summary of Fit

RSquare 0.687944
RSquare Adj 0.674864
Root Mean Square Error 55.30777
Mean of Response 261.4497
Observations (or Sum Wgts) 349

Parameter Estimates

Term Estimate Std Error DFDen t Ratio Prob > |t|
Intercept 298.35687 54.72263 223.5 5.45 < 0.0001*
Mark_Type[BAR] 33.485489 11.68135 14.48 2.87 0.0121*
Mark_Type[CON] 40.649419 11.13278 14.16 3.65 0.0026*
Driver_Sp -0.12983 1.391714 306.4 -0.09 0.9257
Traf_Pres[NO] -8.706513 17.78169 307.7 -0.49 0.6247
Age_Group[<55] 6.2600997 6.765981 30.15 0.93 0.3622
Gender[FEMALE] -0.944633 8.0266 30.08 -0.12 0.9071
Vehicle[SEDAN] 11.979836 22.82694 30.84 0.52 0.6035
Street Group[Group 1] -24.59589 15.50594 40.65 -1.59 0.1204
Street Group[Group 2] 22.915578 12.96046 27.33 1.77 0.0882
Vehicle[SEDAN]:(Eye_Height-48.265) 10.51826 7.517456 30.38 1.40 0.1719
Vehicle[SUV]:(Eye_Height-48.265) -7.229076 7.063262 31.9 -1.02 0.3138
(Driver_Sp-31.029)*Gender[FEMALE] -1.30988 0.537722 302.2 -2.44 0.0154*
(Driver_Sp-31.029)*Street Group[Group 1] 3.179567 1.497779 322.9 2.12 0.0345*
(Driver_Sp-31.029)*Street Group[Group 2] -3.626649 1.613191 312.8 -2.25 0.0253*

Fixed Effect Tests

Source Nparm DF DFDen F Ratio Prob > F
Age_Group 1 1 30.15 0.8561 0.3622
Driver_Sp 1 1 306.4 0.0087 0.9257
Eye_Height[Vehicle] 2 2 31.13 1.5595 0.2262
Gender 1 1 30.08 0.0139 0.9071
Mark_Type 2 2 14.4 22.1189 < 0.0001*
Street Group 2 2 28.28 1.8156 0.1812
Traf_Pres 1 1 307.7 0.2397 0.6247
Vehicle 1 1 30.84 0.2754 0.6035
Driver_Sp*Gender 1 1 302.2 5.9340 0.0154*
Driver_Sp*Street Group 2 2 316.9 3.2324 0.0408*
Note: Abbreviation list provided in front section of report. The horizontal rule separates the main effect variables from the two–way interactions. Asterisks (*) in the Prob > F and Prob > |t| columns represent effects that are statistically significant at the 0.05 level.


Table 20. Effect details for variables in table 19 .

Mark_Type

Least Squares Means Table

Level Least Sq Mean   Std Error
BAR 327.81389   33.016531
CON 334.97782   32.526158
TRA 220.19349   32.389847

LSMeans Differences Tukey HSD

α=0.050

Level     Least Sq Mean
CON A   334.97782
BAR A   327.81389
TRA   B 220.19349

Traf_Pres

Least Squares Means Table

Level Least Sq Mean   Std Error
NO 285.62188   24.379877
YES 303.03491   43.726314

LSMeans Differences Student's t

α=0.050

Level   Least Sq Mean
YES A 303.03491
NO A 285.62188

Age_Group

Least Squares Means Table

Level Least Sq Mean   Std Error
< 55 300.58850   31.849965
≥ 55 288.06830   30.840379

LSMeans Differences Student's t

α=0.050

Level   Least Sq Mea
< 55 A 300.58850
≥ 55 A 288.06830

Gender

Least Squares Means Table

Level Least Sq Mean   Std Error
FEMALE 293.38376   33.671583
MALE 295.27303   29.479982

LSMeans Differences Student's t

α=0.050

Level   Least Sq Mean
MALE A 295.27303
FEMALE A 293.38376

Vehicle

Least Squares Means Table

Level Least Sq Mean   Std Error
SEDAN 306.30823   39.834548
SUV 282.34856   36.460101

LSMeans Differences Student's t

α=0.050

Level   Least Sq Mean
SEDAN A 306.30823
SUV A 282.34856

Street Group

Least Squares Means Table

Level Least Sq Mean   Std Error
Group 1 269.73251   35.991041
Group 2 317.24397   32.058958
Group 3 296.00871   32.832548

LSMeans Differences Tukey HSD

α=0.050

Level   Least Sq Mean
Group 2 A 317.24397
Group 3 A 296.00871
Group 1 A 269.73251
Note: Abbreviation list provided in front section of report. Levels not connected by the same letter are significantly different.

Driver Speed and Street Group

Similar to the daytime analysis, the driver speed and street group interaction term was statistically significant. The plots showing the nighttime detection data along with a plot of the line that would be generated using the regression coefficients are shown in figure 54 for street group 1, figure 55 for street group 2, and figure 56 for street group 3. The following conditions were assumed when generating the plots of regression lines:

  • Transverse pavement markings.

  • Traffic present.

  • SUV.

  • 48.3–inch eye height.

  • Older age group.

  • Male drivers.

The plots show that the relationship between driver speed and nighttime adjusted detection distance is different for the different street groups. For street group 3, the influence of driver speed on detection distance was nominal. For street group 2, the influence of driver speed was similar to the influence seen for the daytime data–longer detection distances are associated with lower speeds. The relationship for street group 1, however, was the opposite. Detection distances were longer at higher speeds.

This graph shows adjusted detection distance on a scale from 0 to 600 ft on the y-axis and driver speed on a scale of 0 to 50 mi/h on the x-axis. Individual data points are shown for street group 1 (45 mi/h, 40 ft width, no crosswalks, two lanes plus two-way left-turn lane, rural in feel). The data points extend from about 25 mi/h to just above 45 mi/h and from just below 100 ft to about 450 ft in nighttime adjusted detection distances. There is also a black dashed regression line, which runs from 25 to 50 mi/h, starting at about 250 ft and sloping up to just above 300 ft.

Figure 54. Graph. Nighttime adjusted detection distance by driver speed for street group 1 at study sites.


This graph shows adjusted detection distance on a scale from 0 to 600 ft on the y axis and driver speed on a scale of 0 to 50 mi/h on the x-axis. Individual data points are shown for street group 2 (30 mi/h, 40 to 50 ft width, crosswalk one side, two to four lanes, mixed feel). The data points extend from 20 to about 35 mi/h and from just below 100 to about 550 ft in nighttime adjusted detection distances. There is also a black, dashed regression line, which runs from 20 to 40 mi/h, starting at just above 350 ft and sloping down to just below 300 ft.

Figure 55. Graph. Nighttime adjusted detection distance by driver speed for street group 2 at study sites.


This graph shows adjusted detection distance on a scale from 0 to 600 ft on the y axis and driver speed on a scale of 0 to 50 mi/h on the x-axis. Individual data points are shown for street group 3 (30 mi/h, 42 ft width, crosswalk both sides, two lanes plus two-way left-turn lane, urban in feel). The data points extend from just below 20 to just below 40 mi/h and from about 50 to about 500 ft in nighttime adjusted detection distances. There is also a black, dashed regression line, which runs from 15 to 40 mi/h, remaining fairly straight at about 300 ft.

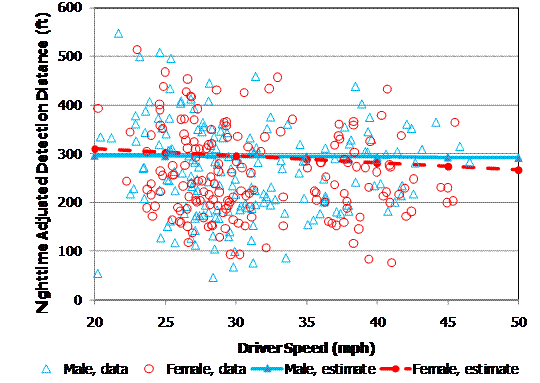
Figure 56. Graph. Nighttime adjusted detection distance by driver speed for street group 3 at study sites.

Driver Speed and Street Group

The gender and driver speed interaction was statistically significant. Figure 57 shows the original data along with the estimated regression lines for male and female using the parameter estimates. The plots of the regression lines for male and female are not parallel, and they cross at about 30 mi/h, which would contribute to the finding that there is an interaction between gender and speed. Given that the difference in predictions is 14 ft at 20 mi/h and –19 ft at 45 mi/h, the finding may be statistically significant but probably not of practical difference.

This graph shows nighttime adjusted detection distance on a scale from 0 to 600 ft on the y-axis and driver speed on a scale of 20 to 50 mi/h on the x-axis. Individual data points are shown as blue triangles for males and red circles for females. The data points cluster between 25 and 30 mi/h. They extend from 20 to just above 45 mi/h and from about 50 to about 550 ft in nighttime adjusted detection distances. There is a blue solid regression line for male, which runs from 20 to 50 mi/h, sloping just barely downward from the 300 ft line. There is a red dashed regression line for female, which starts just above 300 ft and slopes gradually to just above 250 ft.

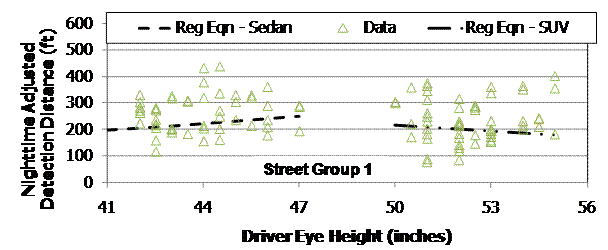
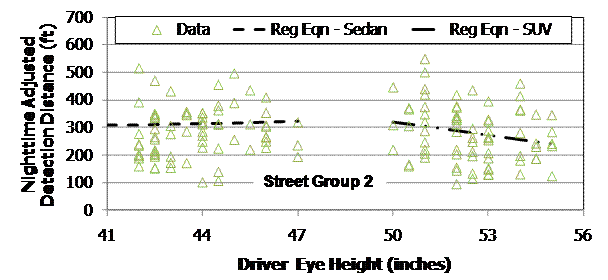
Figure 57. Graph. Nighttime adjusted detection distance by gender and driver speed at study sites.

Eye Height and Street Group along with Vehicle and Street Group

Within the extended model, the interaction term driver eye height and street group was statistically significant along with the interaction term of vehicle and street group. The nighttime adjusted detection distance data by driver eye height and street group are shown for street group 1 in figure 58 , street group 2 in figure 59 , and street group 3 in figure 60 . The following conditions were assumed when generating plots of regression lines:

  • Transverse pavement markings.

  • Speed is 31 mi/h.

  • Older age group.

  • Male drivers.

Because all driver eye heights below 48 inches were in the sedan and all driver eye heights of 50 inches and greater were in the SUV (i.e., driver eye height is nested within vehicle type), the plots also show the detection data by vehicle. As unique main effect variables, driver eye height, vehicle type, and street group were not significant. This could indicate that the effect of driver eye height or vehicle type changes depending upon the street group, which would be surprising because the expectation is that driver eye height or vehicle type would have the same effect regardless of the characteristics of the roads.

This graph shows nighttime adjusted detection distance on a scale from 0 to 600 ft on the y-axis and driver eye height on a scale of 41 to 56 inches on the x-axis. Individual data points are shown in two clusters. The first cluster shows the sedan drivers, with points extending from about 42 to 47 inches and from just above 100 to about 450 ft in nighttime adjusted detection distances. There is a black dashed regression line for sedan drivers that runs from 41 to 47 inches, starting at 200 ft and sloping up to about 250 ft. The second cluster of data points shows the SUV drivers, with points extending from 50 to about 55 inches and from just below 100 to 400 ft in nighttime adjusted detection distances. There is a black dash-and-dot regression line for SUV drivers that runs from 50 to 55 inches, starting just above 200 ft and sloping down to just below 200 ft.

Figure 58. Graph. Nighttime adjusted detection distance by vehicle type and driver eye height for street group 1 at study sites.


This graph shows nighttime adjusted detection distance on a scale from 0 to 700 ft on the y-axis and driver eye height on a scale of 41 to 56 inches on the x-axis. Individual data points are shown in two clusters. The first cluster shows the sedan drivers, with points extending from about 42 to 47 inches and from 100 to just above 500 ft in nighttime adjusted detection distances. There is a black dashed regression line for sedan drivers that runs from 41 to 47 inches, starting at 300 ft and sloping slightly up to just above 300 ft. The second cluster of data points shows the SUV drivers, with points extending from 50 to about 55 inches and from just below 100to about 550 ft in nighttime adjusted detection distances. There is a black dash-and-dot regression line for SUV drivers that runs from 50 to 55 inches, starting just above 300 ft and sloping down to about 250 ft.

Figure 59. Graph. Nighttime adjusted detection distance by vehicle type and driver eye height for street group 2 at study sites.


This graph shows nighttime adjusted detection distance on a scale from 0 to 700 ft on the y-axis and driver eye height on a scale of 41 to 56 inches on the x-axis. Individual data points are shown in two clusters. The first cluster shows the sedan drivers, with points extending from about 42 to 47 inches and from 100 to 400 ft in nighttime adjusted detection distances. There is a black dashed regression line for sedan drivers that runs from 41 to 47 inches, starting just above 200 ft and sloping slightly up to just below 300 ft. The second cluster of data points shows the SUV drivers, with points extending from 50 to about 55 inches and from about 50 to 500 ft in nighttime adjusted detection distances. There is a black dash-and-dot regression line for SUV drivers that runs from 50 to 55 inches, starting just below 300 ft and sloping down gradually to about 250 ft.

Figure 60. Graph. Nighttime adjusted detection distance by vehicle type and driver eye height for street group 3 at study sites.


The overall expectation for driver eye height was that as driver eye height increases, the nighttime adjusted detection distance would be longer. Taller drivers should be able to see farther. For vehicle type, the relationship between detection distance and vehicle type is not known because of the different headlamps. To account for the potential effects of headlamps, vehicle type was kept as a separate variable from driver eye height.

The two–way interaction of vehicle type and street group was statistically significant in the extended model. The headlamps on the different vehicles along with the street lighting available on a street could affect the detection distances along the different streets. The Tukey test for vehicle and street group interaction (see table 20 ) showed that the least square means for the different combinations of vehicle type and street group were not significantly different. Even though the initial statistical evaluation, F–test, found these terms significant, the multiple comparison procedure, Tukey test, did not find a difference. While a difference due to vehicle type would not be unexpected, having the impact of vehicle type change because the vehicle was on a different street would not be expected.

The relationship found for the sedan drivers showed longer nighttime adjusted detection distances for drivers sitting higher. An opposite relationship was found for the SUV drivers. As eye height increased, the adjusted detection distance decreased. Regression lines were generated using the coefficients from the extended model as shown in figure 58 , figure 59 , and figure 60 . The regression lines show general patterns rather than specific values, since the plot of the line includes several assumptions, such as marking type and speed. In most combinations (e.g., SUV drivers on street group 2) the predicted differences between the lowest and highest eye height drivers would be considered practically different, so driver eye height may be a variable of interest. A better understanding of why increasing eye height improves detection distance in the sedan but decreases detection distance in the SUV is needed. This question is beyond the scope of the study, especially given that the interaction terms of marking type with vehicle type or eye height were not statistically significant. The interaction with marking type would be of greater interest. The interaction terms of vehicle and street group and eye height and street group were not significant in the reduced model, which is an additional reason to set aside this finding.

Marking Type

Marking type is the only main effect significant variable in the models (see table 17 and table 19 ). None of the interaction terms that included marking type were statistically significant for nighttime adjusted detection distance at the study sites. As shown in table 20 , the detection distance is similar for the continental and bar pairs markings (about 328–335 ft), and the detection distance to the continental and bar pairs markings is different from the detection distance to the transverse markings (about 220 ft).


Top


Daytime Detection–Existing Sites

Issues arose in the analysis of the data at the existing sites due to potential confounding between marking type and street group. The limited number of sites was a major obstacle in the evaluation. There was only one set of midblock continental crossing data because the data for the opposite approach (with an available viewing distance of only 339 ft) were removed from the data set. There was also only one midblock transverse marking crossing with data available for both approaches. Because of this limited number of sites, the midblock sites always had the same street groups (only street group 2 for the continental site and street group 4 for the transverse site). Only continental and transverse markings were used at the existing sites; there were no bar pair markings.

Reviewing patterns of the data also indicated that a square root transformation of detection distance was needed to satisfy an underlying assumption for ANACOVA. The data were transformed back to original form (i.e., the results were squared) in the graphs developed to illustrate findings.

Table 21 and table 22 show the summary of fit findings and fixed effect results for the daytime detection of existing markings when using all main effect variables along with reasonable two–way interaction variables. The response variable was transformed using a square root. The significant variables for daytime adjusted detection distance at existing sites include the following:

  • Interaction of marking type and location.

  • Interaction of driver speed and location.

  • Marking type.

  • Location.

Table 21. ANACOVA summary of fit findings for daytime adjusted detection distance for extended model (includes potential variables and two–way interactions) for existing sites.

Response Square Root Adjusted Detection Distance

Summary of Fit

RSquare 0.903852
RSquare Adj 0.862806
Root Mean Square Error 2.234199
Mean of Response 14.33578
Observations (or Sum Wgts) 245
Note: Abbreviation list provided in front section of report. A square–root transformation was applied to the data.


Table 22. ANACOVA fixed effects findings for daytime adjusted detection distance for extended model (includes potential variables and two–way interactions) for existing sites.

Fixed Effect Tests

Source Nparm DF DFDen F Ratio Prob > F
Age_Group 1 1 43.72 0.0005 0.9825
Driver_Sp 1 1 162.9 0.3737 0.5418
Eye_Height[Vehicle] 2 2 142.5 1.7863 0.1713
Gender 1 1 40.3 1.3573 0.2509
Loc 1 1 117.7 8.5329 0.0042*
Mark_Type 1 1 109.2 4.2945 0.0406*
Ped/Bike_Pres 1 1 155.2 0.0067 0.9348
Street Group 3 3 89.03 1.2662 0.2909
Traf_Pres 1 1 158.3 0.1002 0.7519
Vehicle 1 1 143.4 0.7320 0.3937
Age_Group*Gender 1 1 25.17 0.5552 0.4631
Age_Group*Loc 1 1 146.6 3.0087 0.0849
Age_Group*Street Group 3 3 149.3 1.7658 0.1562
Age_Group*Vehicle 1 1 25.82 2.7776 0.1077
Driver_Sp*Age_Group 1 1 166.2 1.2538 0.2644
Driver_Sp*Gender 1 1 166.3 3.6359 0.0583
Driver_Sp*Loc 1 1 161.2 49.6153 <.0001*
Driver_Sp*Ped/Bike_Pres 1 1 161.7 0.1781 0.6736
Driver_Sp*Street Group 3 3 151.5 0.3501 0.7891
Driver_Sp*Traf_Pres 1 1 158.1 0.0332 0.8557
Driver_Sp*Vehicle 1 1 162.9 2.7089 0.1017
Eye_Height*Age_Group[Vehicle] 2 2 27.82 1.2638 0.2983
Eye_Height*Driver_Sp[Vehicle] 2 2 157.9 0.9817 0.3770
Eye_Height*Gender[Vehicle] 2 2 29.68 1.1480 0.3310
Eye_Height*Loc[Vehicle] 2 2 147.2 2.3291 0.1010
Eye_Height*Mark_Type[Vehicle] 2 2 146.9 2.1699 0.1178
Eye_Height*Ped/Bike_Pres[Vehicle] 2 2 154.9 0.0312 0.9693
Eye_Height*Street Group[Vehicle] 6 6 150.1 0.7802 0.5867
Eye_Height*Traf_Pres[Vehicle] 2 2 156 0.3270 0.7216
Gender*Loc 1 1 149.5 0.2338 0.6294
Gender*Street Group 3 3 150.2 0.2601 0.8541
Gender*Vehicle 1 1 28.34 2.1389 0.1546
Mark_Type*Age_Group 1 1 143.8 2.5675 0.1113
Mark_Type*Driver_Sp 1 1 147.2 0.0190 0.8905
Mark_Type*Gender 1 1 150.9 2.2527 0.1355
Mark_Type*Loc 1 1 8.059 13.3022 0.0064*
Mark_Type*Ped/Bike_Pres 1 1 151.9 0.2005 0.6550
Mark_Type*Traf_Pres 1 1 151.7 1.5928 0.2089
Mark_Type*Vehicle 1 1 145.9 2.9372 0.0887
Ped/Bike_Pres*Age_Group 1 1 163.7 0.2310 0.6315
Ped/Bike_Pres*Gender 1 1 158.9 0.1145 0.7355
Ped/Bike_Pres*Loc 1 1 148.4 0.0006 0.9799
Ped/Bike_Pres*Vehicle 1 1 153.8 0.0072 0.9327
Traf_Pres*Age_Group 1 1 153.5 0.3345 0.5639
Traf_Pres*Gender 1 1 157.2 1.4259 0.2342
Traf_Pres*Loc 1 1 155.6 0.1321 0.7167
Traf_Pres*Ped/Bike_Pres 1 1 154.2 1.2313 0.2689
Traf_Pres*Vehicle 1 1 158.2 0.0613 0.8048
Vehicle*Loc 1 1 148.9 3.5603 0.0611
Vehicle*Street Group 3 3 149.6 0.2391 0.8690
Note: Abbreviation list provided in front section of report. The horizontal rule separates the main effect variables from the two–way interactions. Asterisks (*) in the Prob > F column represent effects that are statistically significant at the 0.05 level.

Table 23 provides the model that reflects only significant interaction terms and main effect variables that are part of a statistically significant two-way interaction term. Table 24 provides the effects details for this model. Statistically significant interaction terms are as follows:

  • Location and marking type.

  • Location and driver speed.

  • Location and age group.

Table 23. ANACOVA findings for daytime adjusted detection distance for reduced model for existing sites.

Response Square Root Adjusted Detection Distance

Summary of Fit

RSquare 0.866385
RSquare Adj 0.862438
Root Mean Square Error 2.237075
Mean of Response 14.33578
Observations (or Sum Wgts) 245

Parameter Estimates

Term Estimate Std Error DFDen t Ratio Prob > |t|
Intercept 19.236047 1.564591 223.1 12.29 < 0.0001*
Mark_Type[CON] 2.3179499 0.427766 9.118 5.42 0.0004*
Driver_Sp -0.029766 0.054706 225.3 -0.54 0.5869
Loc[Ei] -4.898095 0.497594 16.33 -9.84 < 0.0001*
Age_Group[< 55] 0.1409495 0.247201 43.87 0.57 0.5715
Loc[Ei]*Mark_Type[CON] -1.56501 0.427635 9.102 -3.66 0.0051*
Loc[Ei]*(Driver_Sp-22.9289) 0.5004652 0.055108 227.1 9.08 < 0.0001*
Loc[Ei]*Age_Group[< 55] -0.398108 0.167933 196.1 -2.37 0.0187*

Fixed Effect Tests

Source Nparm DF DFDen F Ratio Prob > F
Mark_Type 1 1 9.118 29.3626 0.0004*
Driver_Sp 1 1 225.3 0.2960 0.5869
Loc 1 1 16.33 96.8957 < 0.0001*
Age_Group 1 1 43.87 0.3251 0.5715
Loc*Mark_Type 1 1 9.102 13.3933 0.0051*
Loc*Driver_Sp 1 1 227.1 82.4737 < 0.0001*
Loc*Age_Group 1 1 196.1 5.6199 0.0187*
Note: Abbreviation list provided in front section of report. A square–root transformation was applied to the data. The horizontal rule separates the main effect variables from the two–way interactions.


Table 24. Effects details for variables in table 23.

Mark_Type

Least Squares Means Table

Level Least Sq Mean   Std Error
CON 20.871501   0.79140242
TRA 16.235601   0.54885479

LSMeans Differences Student's t

α=0.050

Level     Least Sq Mean
CON A   20.871501
TRA   B 16.235601

Loc

Least Squares Means Table

Level Least Sq Mean   Std Error
Ei 13.655456   0.50117427
Em 23.451646   0.89756016

LSMeans Differences Student's t

α=0.050

Level     Least Sq Mean
Em A   23.451646
Ei   B 13.655456

Age_Groups

Least Squares Means Table

Level Least Sq Mean   Std Error
< 55 18.694501   0.57909702
≥ 55 18.412602   0.59030037

LSMeans Differences Student's t

α=0.050

Level   Least Sq Mean
< 55 A 18.694501
≥ 55 A 18.412602
Loc*Mark_Type

Least Squares Means Table

Level Least Sq Mean   Std Error
Ei, CON 14.408397   0.8561985
Ei, TRA 12.902516   0.4401467
Em, CON 27.334605   1.3058417
Em, TRA 19.568686   0.9720994

LSMeans Differences Tukey HSD

α=0.050

Level       Least Sq Mean
Em, CON A     27.334605
Em, TRA   B   19.568686
Ei, CON     C 14.408397
Ei, TRA     C 12.902516

Loc*Age_Group

Least Squares Means Table

Level Least Sq Mean   Std Error
Ei,< 55 13.398298   0.54764873
Ei, ≥ 55 13.912615   0.57341631
Em,< 55 23.990703   0.96036704
Em, ≥ 55 22.912589   0.95905659

LSMeans Differences Tukey HSD

α=0.050

Level     Least Sq Mean
Em,< 55 A   23.990703
Em, ≥ 55 A   22.912589
Ei, ≥ 55   B 13.912615
Ei,< 55   B 13.398298
Note: Abbreviation list provided in front section of report. A square–root transformation was applied to the data. Levels not connected by same letter are significantly different.


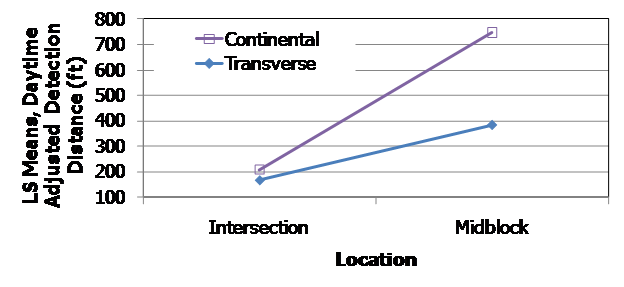
Marking Type and Location

The interaction between marking type and location was significant (see figure 61 ). The continental markings were always detected at a greater distance as compared to the transverse markings. The Tukey results (see table 24 ) show that the detection distances to the continental or transverse markings at intersections are not significantly different. The detection distance to midblock continental is statistically different from the detection distance to midblock transverse markings.

The difference between the continental and the transverse markings is more apparent at the midblock locations, as illustrated in figure 61 . Both transverse and continental marking midblock sites had pedestrian warning signs (W11–2). These sites are located on either side of a basketball arena near large parking lots used by TAMU students. Therefore, both sites have heavy pedestrian traffic associated with students going to classes during the day. One site was a two-lane street with bike lanes, and the other was a four–lane divided roadway, so the roadway width may be a factor. If one assumes that the roadway width is not a factor, a general observation could be that at a midblock location the continental markings were detected at about twice the distance upstream as the transverse markings. Another interpretation of the finding is that the additional 350 ft of detection distance between transverse and continental markings reflects 8 s of increased awareness of the presence of the markings at 30–mi/h operating speeds.

This graph shows the least square mean for daytime adjusted detection distance on a scale from 0 to 800 ft on the y-axis and location on the x-axis. The two location types are intersection and midblock. Two lines represent continental and transverse. Both lines start near 200 ft for intersection. The continental line slopes up to just below 800 ft and the transverse line slopes up to just below 400 ft for midblock.

Figure 61. Graph. Least square mean daytime adjusted detection distance by marking type and location at existing sites.


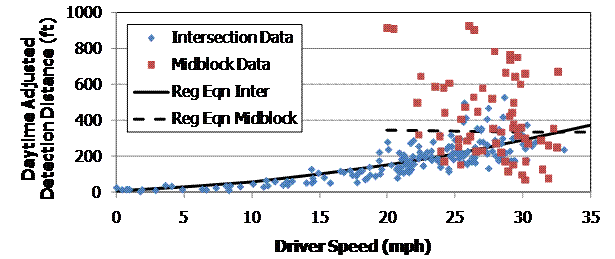
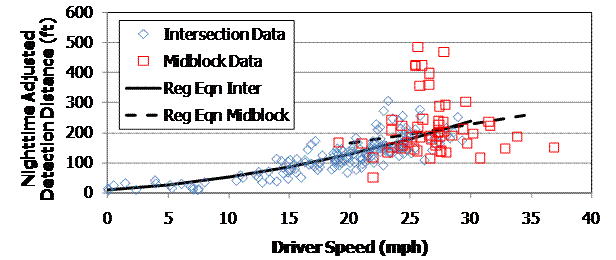
Location and Driver Speed

Driver speed was not significant. However, the interaction between driver speed and location was significant. Figure 62 shows the individual data points along with the regression line that would be generated using the coefficients from the reduced model (see table 23 ). The lower speeds on the approaches to the stop– or signal–controlled intersections can easily be seen. The effects of driver speed are statistically different for the midblock locations and the intersection locations. At the intersection locations, shorter adjusted detection distances were associated with lower speeds while the opposite occurred at the midblock locations. Faster drivers at the midblock locations had slightly shorter detection distances. The low detection distance and low speed at the intersections is related to the drivers coming to a complete stop at the intersection. Several drivers focused more on the stopping maneuver than on the task of identifying the crosswalk. They would make comments such as "oh yes, crosswalk," indicating that they only recalled the crosswalk identification task after initiating the stopping maneuver.

This graph shows daytime adjusted detection distance on a scale of 0 to 1000 ft on the y-axis. Driver speed is on the x-axis on a scale of 0 to 35 mi/h. Data points for intersections are represented by blue diamonds. The points extend from 0 to about 33 mi/h and from 0 to about 500 ft. Data points for midblock are represented by red squares and extend from about 20 to about 33 mi/h and from about 100 to about 900 ft. Two regression lines are shown. A solid black line for intersections runs from 0 to 35 mi/h, starting at 0 ft and sloping gradually upward to just below 400 ft. A dashed black line for midblock runs from 20 to 35 mi/h, remaining fairly level at about 350 ft.

Figure 62. Graph. Daytime adjusted detection distance by driver speed and location at existing sites.


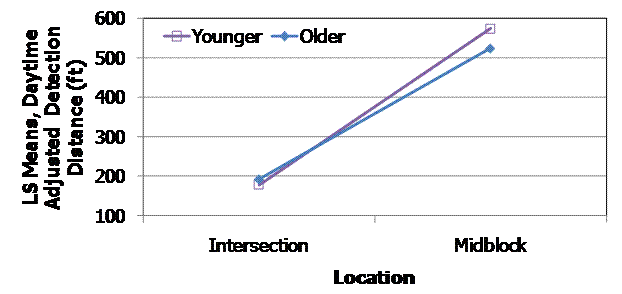
Age Group and Location

Age group was not significant. However, the interaction between age group and location was significant. As shown in figure 63, younger drivers had slightly shorter detection distances than older drivers at the intersections (180 ft compared to 194 ft). For the midblock sites, the pattern was reversed; younger drivers had greater detection distances (576 ft compared to 525 ft). The Tukey results shown in table 24 reveal that detection distances are not statistically different for the two age groups at the midblock locations or at the intersections. Stated in another manner, the detection distance is different for midblock and intersection locations. Detection distance is not different for older and younger drivers at the midblock locations or at the intersections.

This graph shows the least square mean for daytime adjusted detection distance on a scale from 0 to 600 ft on the y-axis and location on the x-axis. The two location types are intersection and midblock. Two lines represent younger and older drivers. Both lines start near 200 ft for intersection. The continental line slopes up to just below 600 ft, and the transverse line slopes up to just above 500 ft for midblock.

Figure 63. Graph. Least square mean daytime adjusted detection distance by driver age and location at existing sites.


Top


Nighttime Detection–Existing Sites

Similar to the analysis of the existing site daytime data, the analysis of the existing site nighttime data had potential confounding issues. In addition to the overlaps between marking type and street group was an overlap between marking type and retroreflectivity group. At the stop-controlled intersections, all of the transverse markings had retroreflectivity readings less than 38 mcd/m2/lx and the continental markings had readings in the 500s (524 or 570 mcd/m2/lx). On the other hand, at the midblock locations, all of the continental markings had retroreflectivity readings of 81 mcd/m2/lx and the continental markings had readings in the 300s (309 or 331 mcd/m2/lx). Therefore, retroreflectivity was not included in the model.

Similar to the daytime analysis, the nighttime data indicated that a square root transformation of detection distance was needed to satisfy an underlying assumption for ANACOVA. The data were transformed back to original form (i.e., the results were squared) in the graphs developed to illustrate findings. Table 25 (summary of fit) and table 26 (fixed effect tests) show the results for the nighttime detection of existing markings when using all main effect variables along with reasonable two–way interaction variables. The response variable was transformed using a square root. The significant two–way interaction variables for nighttime adjusted detection distance at existing sites include the following:

  • Driver speed and location.

  • Gender and location.

Table 25. ANACOVA summary of fit findings for nighttime adjusted detection distance for extended model (includes potential variables and two–way interactions) for existing sites.

Response Square Root Adjusted Detection Distance

Summary of Fit  
RSquare 0.839382
RSquare Adj 0.763414
Root Mean Square Error 1.674317
Mean of Response 11.67063
Observations (or Sum Wgts) 219
Note: Abbreviation list provided in front section of report.


Table 26. ANACOVA fixed effect tests findings for nighttime adjusted detection distance for extended model (includes potential variables and two–way interactions) for existing sites.

Fixed Effect Tests

Source Nparm DF DFDen F Ratio Prob > F
Age_Group 1 1 147.6 0.4825 0.4884
Driver_Sp 1 1 142.9 4.2601 0.0408*
Eye_Height[Vehicle] 2 2 146.5 0.2699 0.7638
Gender 1 1 147.9 2.4619 0.1188
Loc 1 1 148 1.5435 0.2161
Mark_Type 1 1 139.6 0.1174 0.7324
Ped/Bike_Pres 1 1 147.8 0.1832 0.6693
Street Group 3 3 130.9 0.1993 0.8967
Traf_Pres 1 1 147.2 0.0793 0.7786
Vehicle 1 1 146.3 0.0180 0.8936
Age_Group*Gender 1 1 144.2 0.0029 0.9572
Age_Group*Loc 1 1 144.3 2.0896 0.1505
Age_Group*Street Group 3 3 143.4 0.8255 0.4819
Age_Group*Vehicle 1 1 142.7 0.3809 0.5381
Driver_Sp*Age_Group 1 1 147.6 3.1912 0.0761
Driver_Sp*Loc 1 1 147.2 24.6120 < 0.0001*
Driver_Sp*Ped/Bike_Pres 1 1 142 1.1750 0.2802
Driver_Sp*Street Group 3 3 145.3 0.2328 0.8734
Driver_Sp*Traf_Pres 1 1 147.3 0.0090 0.9247
Driver_Sp*Vehicle 1 1 144.9 0.9253 0.3377
Eye_Height*Age_Group[Vehicle] 2 2 146.1 0.8108 0.4465
Eye_Height*Driver_Sp[Vehicle] 2 2 145.4 0.1828 0.8331
Eye_Height*Gender[Vehicle] 2 2 143.8 0.1963 0.8220
Eye_Height*Loc[Vehicle] 2 2 145.1 2.7651 0.0663
Eye_Height*Mark_Type[Vehicle] 2 2 145.8 1.0681 0.3463
Eye_Height*Ped/Bike_Pres[Vehicle] 2 2 145.7 2.2295 0.1112
Eye_Height*Street Group[Vehicle] 6 6 143.7 0.9592 0.4551
Eye_Height*Traf_Pres[Vehicle] 2 2 147.3 0.1932 0.8245
Gender*Loc 1 1 143.3 34.3619 < 0.0001*
Gender*Street Group 3 3 142.6 0.6398 0.5906
Gender*Vehicle 1 1 148 0.0607 0.8057
Mark_Type*Age_Group 1 1 143.7 0.4522 0.5024
Mark_Type*Driver_Sp 1 1 147.4 3.1338 0.0788
Mark_Type*Gender 1 1 143.1 0.0170 0.8963
Mark_Type*Loc 1 1 10.6 2.6708 0.1315
Mark_Type*Ped/Bike_Pres 1 1 147.5 0.1602 0.6896
Mark_Type*Traf_Pres 1 1 146.6 0.0022 0.9630
Mark_Type*Vehicle 1 1 144.1 0.4123 0.5218
Ped/Bike_Pres*Age_Group 1 1 145.9 0.6445 0.4234
Ped/Bike_Pres*Gender 1 1 147.4 0.0674 0.7955
Ped/Bike_Pres*Loc 1 1 148 0.1634 0.6866
Ped/Bike_Pres*Vehicle 1 1 142.1 2.7309 0.1006
Traf_Pres*Age_Group 1 1 145.4 0.0074 0.9316
Traf_Pres*Loc 1 1 145.1 2.6451 0.1060
Traf_Pres*Vehicle 1 1 146.9 0.0645 0.7998
Vehicle*Loc 1 1 146.7 0.2459 0.6207
Vehicle*Street Group 3 3 144.1 1.6618 0.1779
Notes: Abbreviation list provided in front section of report. The horizontal rule separates the main effect variables from the two-way interactions. Asterisks (*) in the Prob > F column represent effects that are statistically significant at the 0.05 level.

The reduced model that only includes significant two–way interaction terms along with main effects variables is shown in table 27 . The least square means and Student's t test results are provided in table 28.

Although marking type was not significant either as a main effect or part of a two–way interaction in the extended model, it was significant under the reduced model for the nighttime existing site data.

Table 27. ANACOVA findings for nighttime adjusted detection distance for reduced model for existing sites.

Response Square Root Adjusted Detection Distance

Summary of Fit  
RSquare 0.784536
RSquare Adj 0.778438
Root Mean Square Error 1.67663
Mean of Response 11.67063
Observations (or Sum Wgts) 219

Parameter Estimates

Term Estimate Std Error DFDen t Ratio Prob > |t|
Intercept 8.5579982 1.147526 201.8 7.46 < 0.0001*
Mark_Type[CON] 0.5071214 0.214537 8.673 2.36 0.0433*
Driver_Sp 0.217536 0.042904 210.5 5.07 < 0.0001*
Gender[FEMALE] 0.7442613 0.159262 44.75 4.67 < 0.0001*
Loc[Ei] -1.336532 0.320496 36.25 -4.17 0.0002*
Loc[Ei]*(Driver_Sp-21.0628) 0.1857927 0.042542 211.9 4.37 < 0.0001*
Loc[Ei]*Gender[FEMALE] -0.733821 0.134929 183.1 -5.44 < 0.0001*

Fixed Effect Tests

Source Nparm DF DFDen F Ratio Prob > F
Mark_Type 1 1 8.673 5.5875 0.0433*
Driver_Sp 1 1 210.5 25.7078 < 0.0001*
Gender 1 1 44.75 21.8387 < 0.0001*
Loc 1 1 36.25 17.3906 0.0002*
Loc*Driver_Sp 1 1 211.9 19.0727 < 0.0001*
Loc*Gender 1 1 183.1 29.5781 < 0.0001*
Note: Abbreviation list provided in front section of report. A square–root transformation was applied to the data. The horizontal rule separates the main effect variables from the two–way interactions. Asterisks (*) in the Prob > F and Prob > |t| columns represent effects that are statistically significant at the 0.05 level.


Table 28. Effects details for variables in table 27.

Mark_Type

Least Squares Means Table

Level Least Sq Mean   Std Error

CON

13.647036


0.44162265

TRA

12.632794


0.35248148

LSMeans Differences Student's t

α=0.050

Level     Least Sq Mean
CON A   13.647036
TRA   B 12.632794

Gender

Least Squares Means Table

Level Least Sq Mean   Std Error

FEMALE

13.884176


0.38485597

MALE

12.395654


0.36032780

LSMeans Differences Student's t

α=0.050

Level     Least Sq Mean
FEMALE A   13.884176
MALE   B 12.395654
Loc

Least Squares Means Table

Level Least Sq Mean   Std Error
Ei 11.803383   0.25872210
Em 14.476447   0.60474724

LSMeans Differences Student's t

α=0.050

Level     Least Sq Mean
Em A   14.476447
Ei   B 11.803383

Loc*Gender

Least Squares Means Table

Level Least Sq Mean   Std Error
Ei, FEMALE 11.813823   0.30883108
Ei, MALE 11.792943   0.29868711
Em, FEMALE 15.954529   0.67715160
Em, MALE 12.998365   0.62965734

LSMeans Differences Tukey HSD

α=0.050

Level     Least Sq Mean
Em, FEMALE A   15.954529
Em, MALE   B 12.998365
Ei, FEMALE   B 11.813823
Ei, MALE   B 11.792943
Note: Abbreviation list provided in front section of report. A square–root transformation was applied to the data. Levels not connected by the same letter are significantly different.

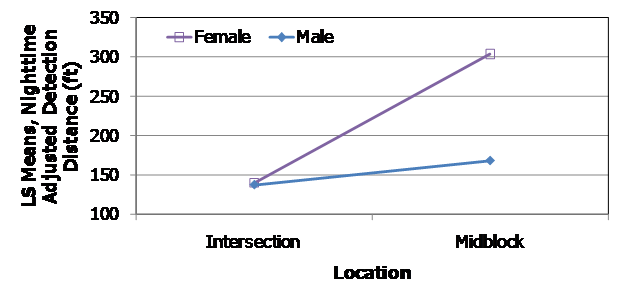
Driver Speed and Location

Similar to the findings for the daytime, driver speed was significant along with the interaction term of driver speed and location. Figure 64 illustrates the findings for driver speed and location. For existing crosswalks at stop– or signal–controlled intersections, lower speeds are associated with shorter detection distances. The statistical evaluation found a similar trend for midblock locations; longer detection distances are associated with higher speeds (see plot of regression equation).

Gender and Location

The interaction between gender and location was significant, with women seeing the crosswalk markings at a greater distance upstream for the midblock locations. A similar difference between male and female detection distance was found for the study sites. As previously noted, there is no reason to believe that women have better eyesight than men. This gender difference might be attributable to attention differences or response bias in that women were more willing to "guess" early to identify the marking.Figure 65 illustrates the trend. The difference for gender was over 136 ft at the midblock locations, which was statistically significant based on Tukey's test (see table 28 ). The difference was minimal for the intersections and was not statistically significant.

This graph shows nighttime adjusted detection distance on a scale of 0 to 600 ft on the y-axis. Driver speed is on the x-axis on a scale of 0 to 40 mi/h. Data points for intersections are represented by blue diamonds. The points extend from 0 to about 30 mi/h and from 0 to about 300 ft. Data points for midblock are represented by red squares and extend from just below 20 to about 38 mi/h and from about 50to just below 500 ft. Two regression lines are shown. A solid black line for intersections runs from 0 to 30 mi/h, starting at 0 ft and sloping gradually upward to about 250 ft. A dashed black line for midblock runs from 20 to 30 mi/h, starting just above 150 ft and sloping up to just above 250 ft.

Figure 64. Graph. Nighttime adjusted detection distance by driver speed and location at existing sites.


This graph shows the least square mean for nighttime adjusted detection distance on a scale from 0 to 350 ft on the y-axis and location on the x-axis. The two location types are intersection and midblock. Two lines represent female and male drivers. Both lines start just below 150 ft for intersection. The female line slopes up to just above 300 ft, and the male line slopes up to about 175 ft for midblock.

Figure 65. Graph. Least square mean nighttime adjusted detection distance by gender and location at existing sites.


Marking Type

Marking type was statistically significant in the reduced model (see table 27 and table 28 ). Similar to the study site evaluation, none of the interaction terms that included marking type were statistically significant for nighttime adjusted detection distance at the existing sites. The least square mean detection distance to the continental markings was 186 ft (after applying a squaring transformation) as compared to 160 ft to the transverse markings. The Tukey test (see table 28 ) did identify these distances as being significantly different.


Top


Comparison of Findings

Table 29 summarizes the findings from the statistical evaluations of the adjusted detection distances. The results are subdivided by the site type (study or existing) and light (day or night). Preliminary evaluations demonstrated that evaluations needed to be conducted separately for the study sites (where the markings were installed at midblock locations) and the existing sites (where the markings were already present at midblock locations with pedestrian warning signs or at intersections). The preliminary evaluations also clearly showed a difference in detection distance for day and night. Since the nighttime condition had an additional variable, retroreflectivity, to consider and some of the variables were believed to have different effects during the night (such as vehicle type and driver eye height), separate analyses were done for daytime and nighttime conditions. The average detection distances by location, day or night, and marking type is shown in table 30. In all combinations, daytime detection distances are longer than nighttime detection distances.

As shown in table 29, the marking type (bar pair, continental, or transverse) for the study sites was statistically significant. The detection distances to bar pairs and continental markings were similar, and they were statistically different from the detection distance to the transverse markings.

For the study sites, the presence of traffic had an impact on detection distance, in most cases limiting the ability to see the markings farther upstream, as expected. The impact of traffic on the transverse markings was minimal as the detection distance to these markings was already small compared to the detection distances for bar pairs or continental. Overall, shorter detection distances were associated with higher speeds. However, in most cases, it was only slightly shorter detection distances. The characteristics of the streets also influenced the detection of the crosswalk markings. An unexpected result was that the street group with 45–mi/h posted speed limit had longer nighttime adjusted detection distances for the higher speeds. This was opposite the finding for daytime conditions; daytime adjusted detection distances were (slightly) shorter for the higher speeds. Variables that included gender, driver eye height, and vehicle type as part of an interaction term were found to be statistically significant; however, closer examination found them to not be of practical significance.

For the existing sites, marking type had a significant effect on detection distance. During the day, the detection distances to the continental or transverse markings at intersections were not significantly different. The detection distance to midblock continental was statistically different (longer) from the detection distance to midblock transverse markings. During nighttime conditions, variables in addition to marking type, such as location (midblock or intersection) and driver speed, had an effect on detection distances at the existing sites. Driver speeds had mixed effects on detection distance depending upon location (intersection or midblock) and light level (day or night). For intersections, an increase in driver speed was associated with longer detection distances for both the daytime and nighttime conditions. All of the intersections included in this project were either stop–controlled or signal–controlled. Several drivers appeared to be more focused on the stop maneuver than the detection task and would not call out the recognition of a crosswalk until close to the stop bar. For midblock (or uncontrolled approaches), the finding was dependent on light level. Nighttime detection distance at midblock was similar to intersections; longer detection distances were associated with the higher speeds. For daytime, the opposite occurred; higher driver speeds were associated with shorter detection distances to the midblock crosswalk. While the higher driver speeds were associated with shorter detection distances, the differences were small and would not be considered of practical difference.

Table 29. Summary of adjusted detection distance findings.

Variable

Study Sites

(Bar, Con, Tra
at Midblock Locations)

Existing Sites

(Con, Tra at Intersections and Midblock Locations)

Day

Night

Day

Night

Driver speed       SS(R)
Gender       SS(R)
Location NA NA SS(E), SS(R) SS(R)
Marking type SS(E), SS(R) SS(E), SS(R) SS(E), SS(R) SS(R)
Street group SS(E)      
Age group X location NA NA SS(R)  
Driver speed X gender   SS(R)    
Driver speed X location NA NA SS(E), SS(R) SS(E), SS(R)
Driver speed X street group SS(E), SS(R) SS(R)    
Eye height X street group   SS(E)    
Gender X location NA NA   SS(E), SS(R)
Gender X street group SS(R)      
Marking type X location NA NA SS(E), SS(R)  
Marking type X traffic presence SS(E), SS(R)      
Street group X vehicle   SS(E)    
Traffic presence X location NA NA   SS(E)
Blank cell = Variable not significant in either the extended or reduced variable models.
SS(R) = Statistically significant (at 0.05 level) in the reduced variable model.
SS(E) = Statistically significant (at 0.05 level) in the extended variable model.
NA = Not applicable, location was not a variable for the study sites since all were at midblock.


Table 30. Average adjusted detection distances.

Location

Light

Average Adjusted Detection Distance (ft)

Bar Pair Continental Transverse

Existing intersection

Day NA 195 170
Night NA 161 115

Existing midblock

Day NA 625 313
Night NA 215 221

New study sites

Day 466 497 235
Night 293 304 185
NA = Not applicable.


Top


FHWA-HRT-10-068


Previous | Table of Contents | Next

Federal Highway Administration | 1200 New Jersey Avenue, SE | Washington, DC 20590 | 202-366-4000
Turner-Fairbank Highway Research Center | 6300 Georgetown Pike | McLean, VA | 22101