Pedestrian and Bicyclist Traffic Control Device Evaluation Methods
CHAPTER 3. PLANNING THE EVALUATION
OVERVIEW
Planning an evaluation involves a series of steps and decisions. A successful evaluation that is thorough and acceptable requires careful consideration. The problem that the proposed traffic control device will resolve must be clearly defined. The evaluation design and method employed must be appropriate for the condition being addressed. Additionally, the evaluation should clearly consider what will be varied and what characteristics will be held constant in order to assess the treatment's influence on a MOE. The steps discussed in this chapter are included in table 1.
Table 1. Steps to plan an evaluation of traffic control devices.
Step |
Name of Step |
Question Answered |
1 |
Problem identification |
What is the safety or traffic operations issue? |
2 |
Research question |
What is the research question? |
3 |
Measures of effectiveness |
How will performance be assessed? |
4 |
Evaluation designs |
What is the study approach? |
5 |
Evaluation methods |
How will users, traffic operations, or crashes be measured? |
6 |
Selecting components to the evaluation plan |
How can time, budget, and practicality be balanced to execute the plan? |
PLANNING STEP 1: PROBLEM IDENTIFICATION
The evaluation process begins when a safety or traffic operations issue is observed. Because this report discusses the evaluation of traffic control devices, the process focuses on issues involving a traffic control device or where a traffic control device can be part of the solution. Certainly, some safety and operations problems cannot be solved by traffic control devices and may require a change in alignment, roadside treatments, or enforcement.
The safety or operations problem may have been identified by citizen complaint, police citations and safety concerns, a routine review of traffic operations, or a formal roadway safety audit. Once the issue is identified, candidate countermeasures can be examined by reading research reports or talking with vendors or other professionals.
The first step in planning an evaluation is to identify the characteristics of the problem that the countermeasure will address. The characteristics of the problem can be identified by the methods shown in table 2.
Table 2. Methods to identify problem characteristics.
Observations of Pedestrian or Bicyclist Movements |
Observations of Vehicular Movements |
Historical Records |
- Law enforcement
- Local residents or business owners
- Surveillance cameras
|
- Traffic counters
- Surveillance cameras
- Traffic survey
|
- Crash records
- Citation records
- Citizen complaint logs
|
The characteristics of the problem should help classify the problem in one of the following areas:
-
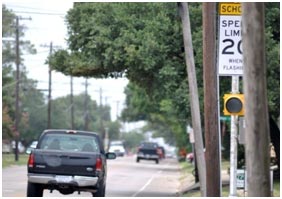
Visibility: The road user did not see the traffic control device (see figure 8).
Comprehension: The road user did not understand the traffic control device (see figure 9). -
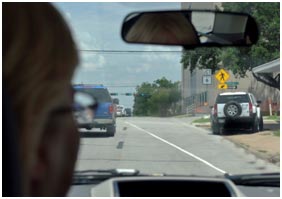
Compliance: The road user ignored the traffic control device (see figure 10).
-
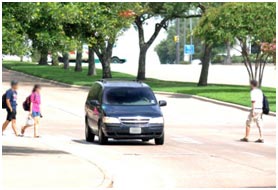
Opportunity: The road user needs a change in a traffic pattern to facilitate crossings (see figure 11).
 |
| © Texas Transportation Institute |
Figure 8. Photo. Driver's view of traffic control devices obstructed
by utility poles and trees.
 |
| © Texas Transportation Institute |
Figure 9. Photo. Driver confused by pavement markings remaining from a work zone.
 |
| © Texas Transportation Institute |
Figure 10. Photo. Driver not yielding to pedestrians in a crosswalk.
 |
| © Texas Transportation Institute |
Figure 11. Photo. Pedestrian cannot find acceptable gap due to high traffic volume.
Understanding the characteristics of the problem helps determine how to proceed. When available traffic engineering solutions from MUTCD are not sufficient and a new traffic control device is developed, experimentation may be necessary. Within this process, the next step is to formulate the research question.
PLANNING STEP 2: RESEARCH QUESTION
Once the problem and potential countermeasure(s) has been identified, a research or evaluation question (also called a hypothesis) should be formulated. The hypothesis should be devised so that it can be tested in a study. Generally, it follows the thinking, "If an independent variable changes, will there also be a change in a certain dependent variable?" An independent variable is one that the experimenter manipulates—its value is independent of any response from the people or vehicles being tested. A dependent variable is the component that is being measured—its value is dependent on responses from the people or vehicles being tested. It may be helpful to think of the independent variable as the treatment being evaluated and the dependent variable as the MOE used. The null hypothesis in scientific reasoning is the assumption that the independent variable has no (or null) effect on the dependent variable. The null hypothesis would answer the research question in the negative: "There is no change when this independent variable changes."
Examples of research questions include the following:
Will the new traffic control device increase the number of vehicles that yield to pedestrians? Is the new traffic control device easier for people to understand than an existing traffic control device that is available in MUTCD?
Chapter 6 of the Institute of Transportation Engineers (ITE) Traffic Engineering Handbook provides information on statistical analyses applicable to the traffic engineering profession.(4) It includes a discussion on hypothesis testing. Notable scientific reasoning and statistical analysis starts with a presumption that the treatment has no effect. The statistical tests evaluate whether this presumption is accurate given the data. In other words, one should enter an evaluation as a skeptic and let the data and statistical analysis determine whether a treatment is effective.
It is often easiest to think about research questions in terms of the alternative hypothesis, also called the research hypothesis. This is a simple statement of the expected effect of the treatment. Useful research hypotheses avoid qualitative terms such as "better" and instead use language that describes the direction of change of a MOE. Some examples of research hypotheses for bicyclist and pedestrian traffic control device evaluations are as follows:
The number of vehicles yielding to pedestrians will be greater when there is a flashing beacon present compared to when there is no beacon present. The number of bicycle-motor vehicle conflicts within 100 ft of the intersection will decrease after the new pavement markings are present compared to the existing markings. The proportion of pedestrians crossing at the marked crosswalk to those crossing at unmarked locations will increase after the new pavement markings are present compared to the existing markings. The speed of approaching vehicles will be lower at locations that have the advance warning signs installed compared to locations without advance warning signs.
PLANNING STEP 3: MEASURES OF EFFECTIVENESS
A key step in developing an evaluation plan is to determine appropriate MOEs. A selected MOE should reflect the user behavior that is anticipated to change due to the traffic control device or that is somehow related to the problem being addressed. Thought must be given to the likely cause of the problem and how that cause relates to features of the potential traffic control
device countermeasure.
MOEs are observable behaviors or events that can be influenced by a countermeasure or treatment. Characteristics of MOEs include the following:
-
Valid: A MOE can measure what it is supposed to measure.
-
Sensitive: A MOE can discriminate between performance changes in the before and
after conditions.
-
Collectable: A MOE can be measured with available resources.
-
Reliable: A MOE can measure the same phenomenon each time it is used.
In many research reports, the MOE is the dependent variable. The dependent variable typically refers to responses made by people or motor vehicles (i.e., the values of the variable depend on a person's response). This is contrasted to the independent variable, which is independent of a person's response. The independent variable is the element changed by the experimenter during the evaluation—it is the treatment.
Examples of MOEs are listed in table 3. A traffic control device may be installed to improve operations or safety. Safety devices are intended to improve safety through the reduction of crashes. Because crashes occur relatively infrequently, they can be an unstable MOE. Also, some treatments are designed to only alter certain behaviors, so they will not influence all crash types and may result in a nonmeasurable change in total crashes.
Table 3. Examples of MOEs for field evaluations.
Crashes |
Pedestrian Behaviors |
Traffic Operations |
- Number of crashes
- Number of crashes by type
- Crash rate
|
- Pedestrian compliance (with signals, crosswalk, etc.)
- Inadequate looking
- Hesitation or backup
- Conflicts with through or turning vehicles
- Pedestrian activation of device (percent)
|
- Volume (by road user group or by movement)
- Speed (by road user group)
- Deceleration pattern on approach
- Turn counts
- Delay (by road user group)
- Percent stopping or yielding
- Conflicts
|
Because pedestrian and bicyclist crashes are rare, a countermeasure may not have a notable effect on crashes within a reasonable study period. In such cases, a surrogate measure may be used instead of crashes. Surrogate measures include behaviors by bicyclists, pedestrians, or motor vehicles that are related to crash likelihood.
Appendix A of this report gives examples of the process used to select a MOE.
PLANNING STEP 4: EVALUATION DESIGNS
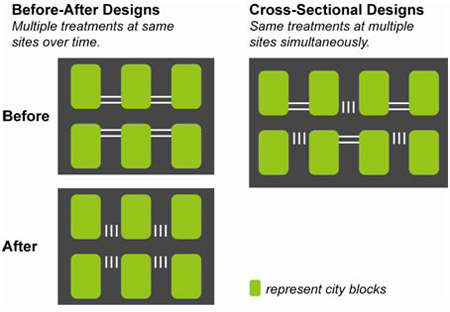
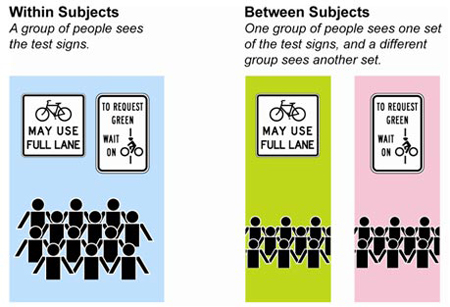
The effectiveness of a traffic control device can be measured in two basic ways: over time or across different locations. A longitudinal study measures the effect of a treatment over time. In traffic safety, these studies are referred to as before-after studies. A cross sectional study takes a portion of time and looks at treatment effects across different locations. Either of these two evaluation designs can be used when measuring traffic responses in observational studies or when measuring human responses in controlled experiments. Observational studies are different than controlled experiments in that the investigator may have limited or no control over the assignment of treatments to sites or the characteristics of the sites (e.g., traffic volume, development, etc.).
Table 4, figure 12, and figure 13 illustrate the analogy between the two basic evaluation approaches when applied to testing. The before-after design uses the same locations to test treatments over time, and the cross sectional design tests multiple treatments at matched sites during a single time period. Appendix B of this report gives examples of experimental design and the basics of statistical analysis.
Table 4. Overview of evaluation designs.
Study Type |
Longitudinal |
Cross Sectional |
Observational studies |
A traffic control device is installed in the field at one or more sites. Road user reactions to the traffic control devices are compared before and after the device’s installation. |
A group of sites with a traffic control device is compared to a group of sites without the traffic control device. |
Controlled experiments |
All candidate treatments are shown to all participants over time. |
A group of participants views one device, and another group views a different device. |
 |
| © Texas Transportation Institute |
Figure 12. Illustration. Observational study evaluation designs
for crosswalk marking patterns.
 |
| © Texas Transportation Institute |
Figure 13. Illustration. Controlled experiment designs within subjects and between subjects.
PLANNING STEP 5: EVALUATION METHODS
The exact methodology and MOEs employed to evaluate a user's reaction to a traffic control device is dependent on the characteristics of the proposed treatment and the analysis of the problem as described in the previous section. At a high level, the effectiveness of a countermeasure can be evaluated by examining its effect on one or more of the following:
These three areas form the basic structure of this section of the report. Within each of these sections, details are provided that present the benefits and drawbacks to each method.
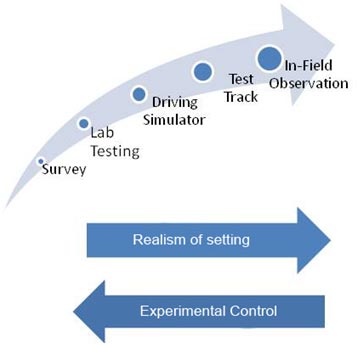
Methods focused on traffic operations and user behavior have advantages and disadvantages that generally fall along a continuum as shown in figure 14. As the realism of the setting of an evaluation method increases, the amount of experimental control possible typically decreases, and confounding variables begin to be introduced. Laboratory methods, such as comprehension tests, can have a high degree of experimental control but a lower degree of realism. A particular traffic control device may perform well in a laboratory comprehension test, but when placed in the field, it may show a low degree of driver compliance. Evaluation methods are discussed in more detail in appendix C of this report.
 |
| © Texas Transportation Institute |
Figure 14. Illustration. Tradeoff between realism of the setting and experimental control.
When selecting a research method, the tradeoffs shown in figure 14 must be considered. For example, if an agency wants to evaluate a new symbol sign for advance signs for shared use trail crossings, it could choose any of the methods in figure 14. A survey asking people what they think the new symbol means could be conducted in a short amount of time. At the other end of the continuum, an agency could install a sign with the new symbol and observe yielding behavior at the crossing when bicycles are present. It may take several months to capture enough occurrences of motor vehicle-bicycle conflicts to have a valid statistical sample. Additionally, in the field study, factors such as weather and traffic conditions have to be considered when interpreting the results. All of these tradeoffs, along with cost and the need for specialized equipment or facilities, must be carefully weighed when selecting a study method.
PLANNING STEP 6: SELECTING COMPONENTS TO THE EVALUATION PLAN
The evaluation plan must directly relate to what is being tested. The previous sections presented different study designs and methods. The selection of the evaluation method must weigh cost considerations against which approach will best answer the research question formulated.
Several choices must be made when developing an evaluation plan. The choices include the MOEs, study design (e.g., before-after versus cross sectional), and study method (examining users versus traffic operations versus crashes). Within the study method decision, specific details of the data collection instruments and procedures must be made, most of which require consideration of how one choice affects other features of the overall evaluation plan.
Budget and time affect all evaluation plan developments. Tradeoffs between sample size, MOEs, and budget must be considered. Because these tradeoffs exist, care must be taken when selecting the appropriate methodology to answer the research question at hand. Elements to consider while selecting the appropriate method include the following:
Crash characteristics common to the problem. Driver, pedestrian, or bicyclist behaviors related to crashes, conflicts, or disruptions to traffic operations. Availability of necessary measuring equipment and measurement locations. Relationship of a MOE to the problem behavior identified. Use of a carefully planned succession of evaluations to control costs.
Table 5 relates a sample of study methods to factors contributing to an observed problem. The table illustrates the applicable study method for the given contributing factor. For example, if the contributing factor is the visibility of the device, a survey would not answer whether the proposed traffic control device would improve conditions. After refining the traffic control device using laboratory methods, a field test could address the question of how the traffic
control device would perform in the real world. Using laboratory methods allows for greater control over confounding factors and allows researchers to refine the traffic control device prior to field installation.
Table 5. Evaluation methods applied to specific contributing factors.
Evaluation Method |
Visibility |
Comprehension |
Compliance |
Opportunity |
Examining Users |
Interactive structured interviews |
|
X |
|
|
Focus groups |
|
X |
|
|
Non-interactive surveys |
|
X |
|
|
Controlled experiments |
|
X |
|
|
Traditional laboratory |
|
X |
|
|
Driving simulator |
|
X |
|
X |
Test track |
X |
X |
|
X |
Roads closed to public travel |
X |
X |
|
|
Roads open to public travel |
X |
X |
X |
X |
Examining Traffic Operations |
Volume |
|
|
|
X |
Road user behavior (e.g., selected paths) |
|
|
X |
|
Erratic maneuvers or conflicts |
|
|
X |
|
Compliance, violations, and
risk taking |
|
|
X |
|
Citations |
|
|
X |
|
Speed |
|
|
X |
|
Delay or travel time |
|
|
|
X |
Gap |
|
|
|
X |
Other potential/unique measures |
|
|
|
X |
Examining Crashes |
Crash history |
X |
X |
X |
X |
|


